
Published: April 14th, 2026
Morgan Stanley is scheduled to report first-quarter profits this week. It has been expanding its operations and reducing its dependence on equity markets for income. The company's greater emphasis on investments and wealth management, along with its strategic partnerships and acquisitions, provides support.
As of December 31, 2025, the company's total client assets stood at $9.3 trillion, bringing it closer to the $10 trillion asset administration goal established by previous CEO James Gorman. The wealth administration arm's personal standard retirement account (IRA) AUM had surpassed $1 trillion, demonstrating strong growth across the workplace.
Given the favorable operating environment, Morgan Stanley is anticipated to have produced a high IB performance in the first quarter. The $2.02 billion Analysts Consensus Estimate for IB revenue represents a 29.5% increase from the previous year.
The company's Asia region revenues increased 23% compared to the previous year to $9.42 billion in 2025, and a similar trend is anticipated to continue this year. Additionally, Morgan Stanley's alliance with Mitsubishi UFJ Financial Group, Inc. will continue to support profitable operations and solidify its standing in Japan's market.
Let's see the full outlook from the MS analysis:
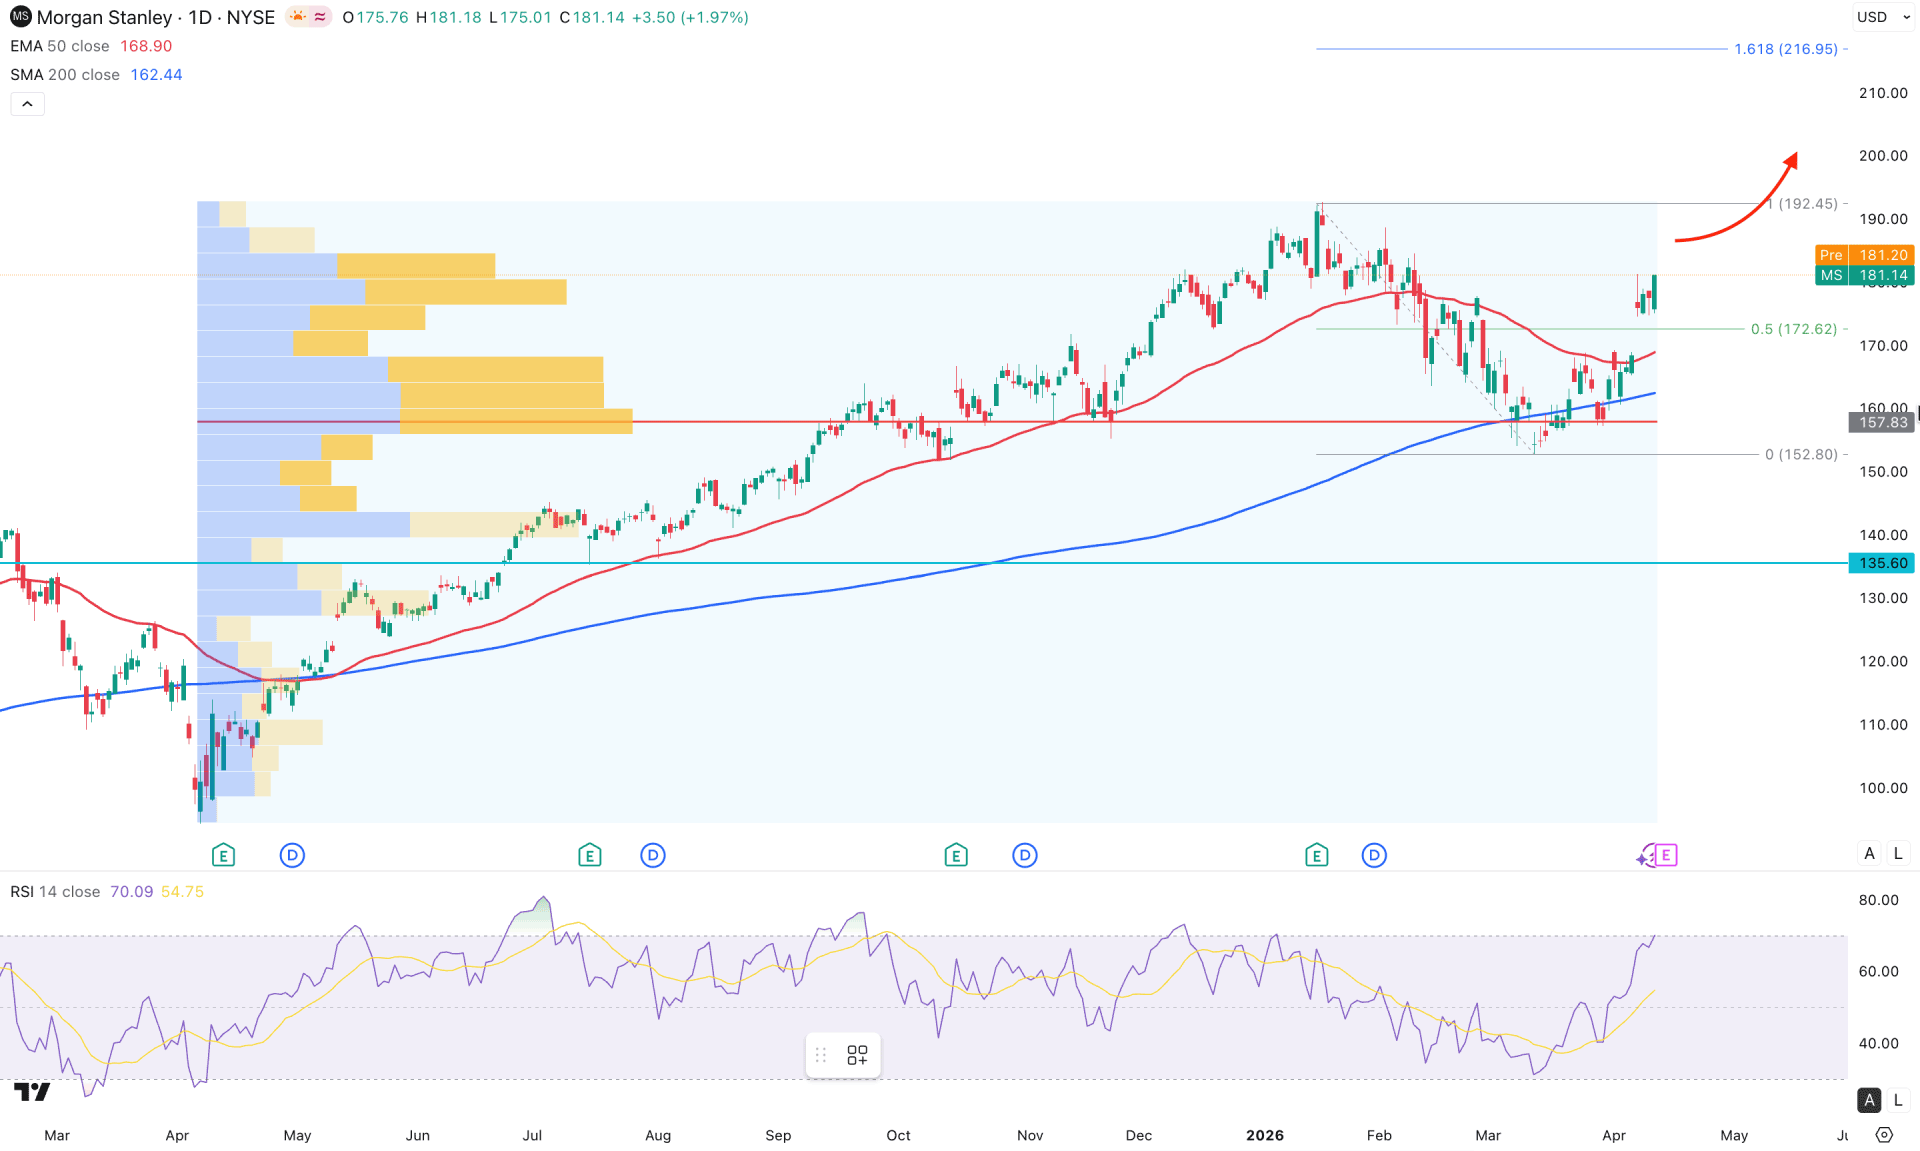
In Morgan Stanley's daily chart, the major market momentum remains bullish, even if a decent downside correction is possible from the January 2026 top. The price moved lower but formed a strong bullish V-shaped recovery from the 152.80 bottom. It is a sign of a strong market reversal, as the major market trend remains bullish.
On the higher timeframe, impulsive buying pressure is visible, pushing the price significantly higher from the existing all-time high set in 2024. However, the strong bullish reversal catalyst in February 2025 has become questionable after forming a gravestone doji candle in the next month, followed by a bullish breakout. Still, the current price is moving above the 169.63 monthly flip zone, signaling strong bullish continuation.
Looking at the volume structure, a strong bullish breakout from the 157.83 high-volume line is evident, with the price stable above the support area. Primarily, it is a sign of institutional buyers' involvement in the market that could take the price even higher.
Coming to the main price chart, multiple bullish candles are visible above the 50-day EMA line, supported by the bullish slope in the 200-day SMA. As long as the entire price action is above these two crucial dynamic lines, the main aim for this stock is to look for long trades only.
Following the market momentum, the Relative Strength Index extended the upward pressure and reached the 70.00 overbought line, but has yet to move beyond the overbought area. On the other hand, the Average Directional Index has rebounded and crossed the 20.00 level from the 16.66 area. It is a sign of a strong trend formation after the bearish corrective wave.
Based on the market structure, the immediate support is at the 50-day EMA, currently at 169.39. Below this level, the 157.83 high-volume line could serve as secondary support. A break below these dynamic lines could invalidate the bullish possibility and could take the price lower below the 152.80 level.
On the other hand, the market momentum remains bullish as long as the price stays above the 50-day EMA. In that case, the primary aim for this stock is to test the 192.45 key resistance level before heading beyond the 200.00 psychological barrier.
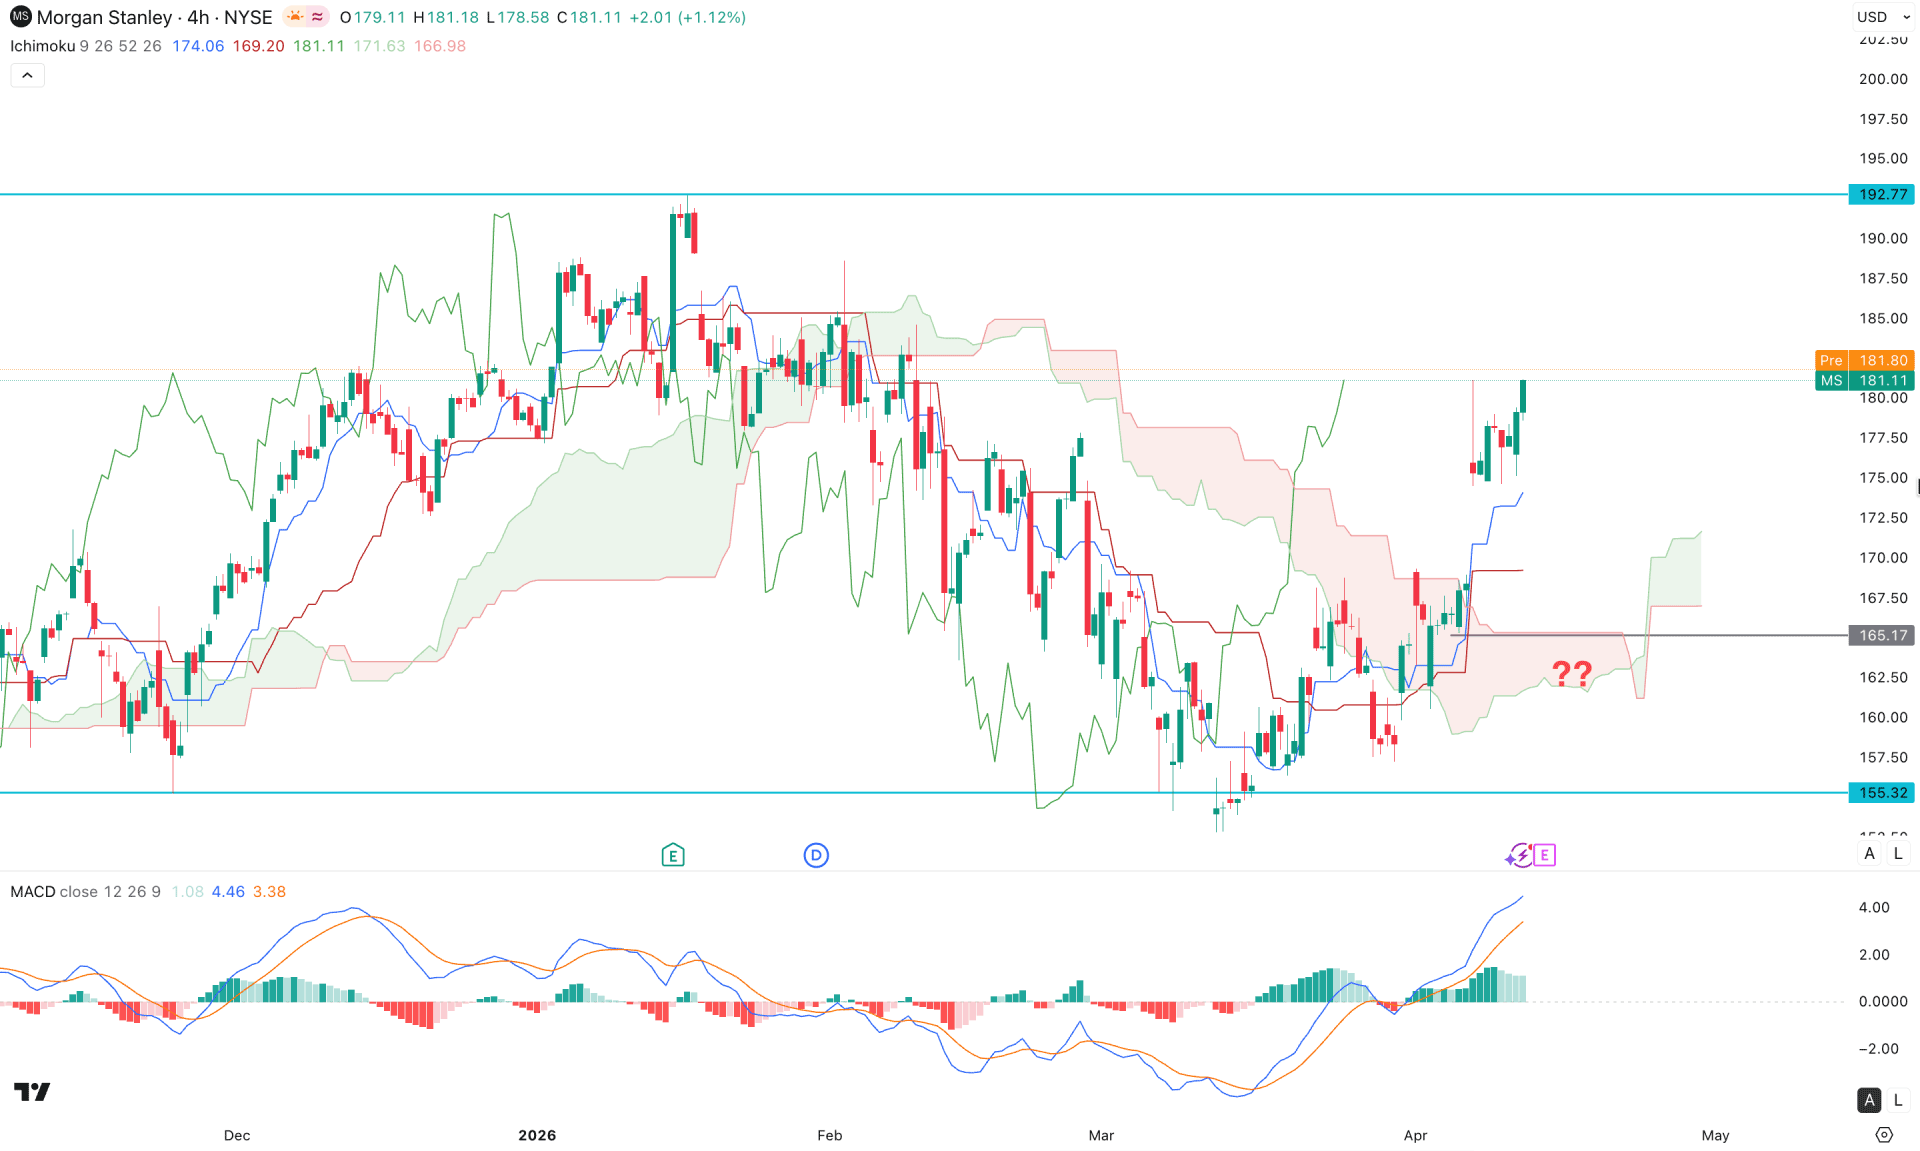
Over the H4 timeframe, the Morgan Stanley price is trading bullish after a breakout above the Ichimoku cloud. Moreover, the future cloud has flipped to a higher position. Both lines are heading upwards.
In the indicator window, the MACD histogram remains above the neutral line, signaling bullish continuation. However, the signal line has reached the upper peak area and has no room to move higher. It is a sign of a pending correction, followed by a failure to break a new bullish high in the histogram.
Based on this outlook, the price has overextended the dynamic line, with the MACD signal line overbought. Based on this, a considerable downside correction is pending, with immediate support at 169.27. The immediate resistance is at the 192.77 level, a crucial barrier to watch, as breaking above this line could open the door to the 200.00 level.
On the other hand, the major support is located at the 155.32 level, which could work as the ultimate tolerance level for buyers. A break below this line with bearish impulsive momentum could invalidate the bullish opportunity at any time.
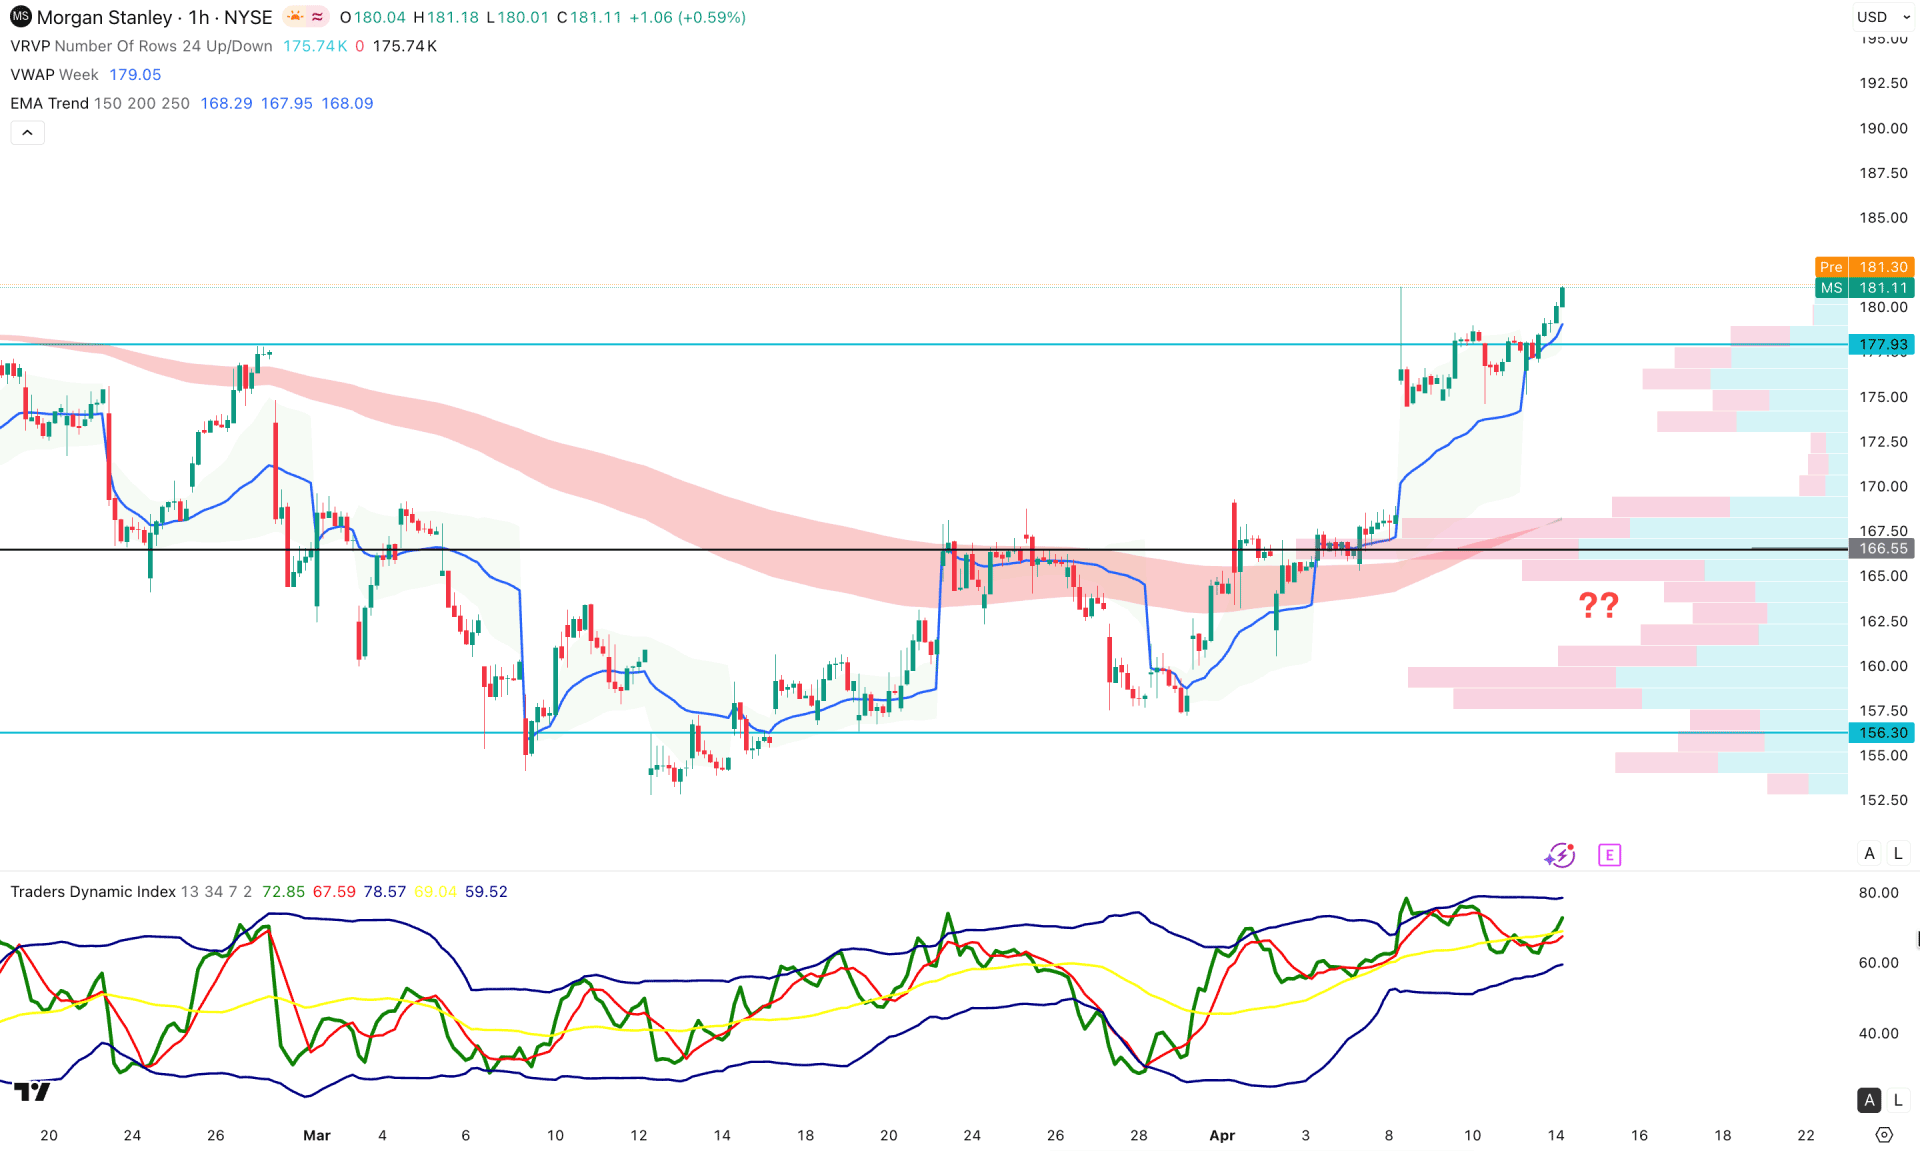
In the hourly timeframe, the MS price is trading within an extreme bullish condition, supported by a bullish U-shape recovery.
Moreover, rising weekly VWAP support is evident, acting as an immediate barrier for sellers. The indicator window shows the same story, where stable momentum is visible above the 50.00 line in the Traders Dynamic Index.
Based on this outlook, the current price is trading above the existing swing high of 177.93, and investors should closely monitor how the price reacts above this line. Primarily, it is an extreme bullish condition, with a downside correction pending. In that case, a bearish hourly candle below the 174.44 low could increase the possibility of testing the 160.00 level.
On the other hand, consolidation above the 168.00 breakout point, with a bullish reversal candlestick above the weekly VWAP level, could resume the existing trend and push it beyond the 192.00 level.
Based on the overall market structure, Morgan Stanley stock is trading with strong bullish momentum on the recent recovery, with a valid bottom formation increasing the possibility of a new swing high. Investors should closely monitor the intraday dips, as a downside correction with reliable price action from the near-term support area could offer an early long opportunity.


