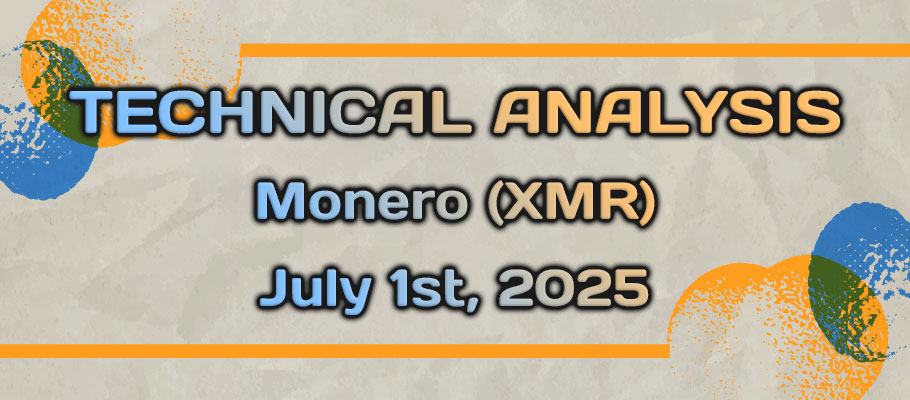
Published: July 1st, 2025
With privacy becoming a global concern, Monero is seeing a stealthy revival. The primary objective of anonymous transactions has increased as a result of current government monitoring crackdowns in several countries, notably Central Asia. The use of Monero's hidden identities and ring signature encryption has grown on darknet marketplaces and, more lately, among politically sensitive groups.
Monero is unwavering in its resolve to offer anonymous and decentralized transactions in spite of regulatory assaults on privacy coins. Because of its robust community and continuous growth, Monero has been able to endure criticism and hold its place as a top privacy coin. To maintain its competitiveness in a changing market, Monero has recently made changes to its system that boost both safety and capacity.
Although Monero's privacy qualities are a big marketing point, the cryptocurrency has drawbacks as well, especially as authorities and governments are still concentrating on the sense of anonymity that Monero offers. However, Monero's place in the overall system is likely to grow as online security becomes a more urgent concern in the years to come, keeping it relevant as a major player in the cryptocurrency market.
Let's see the further aspect of this crypto from the XMR/USDT technical analysis:
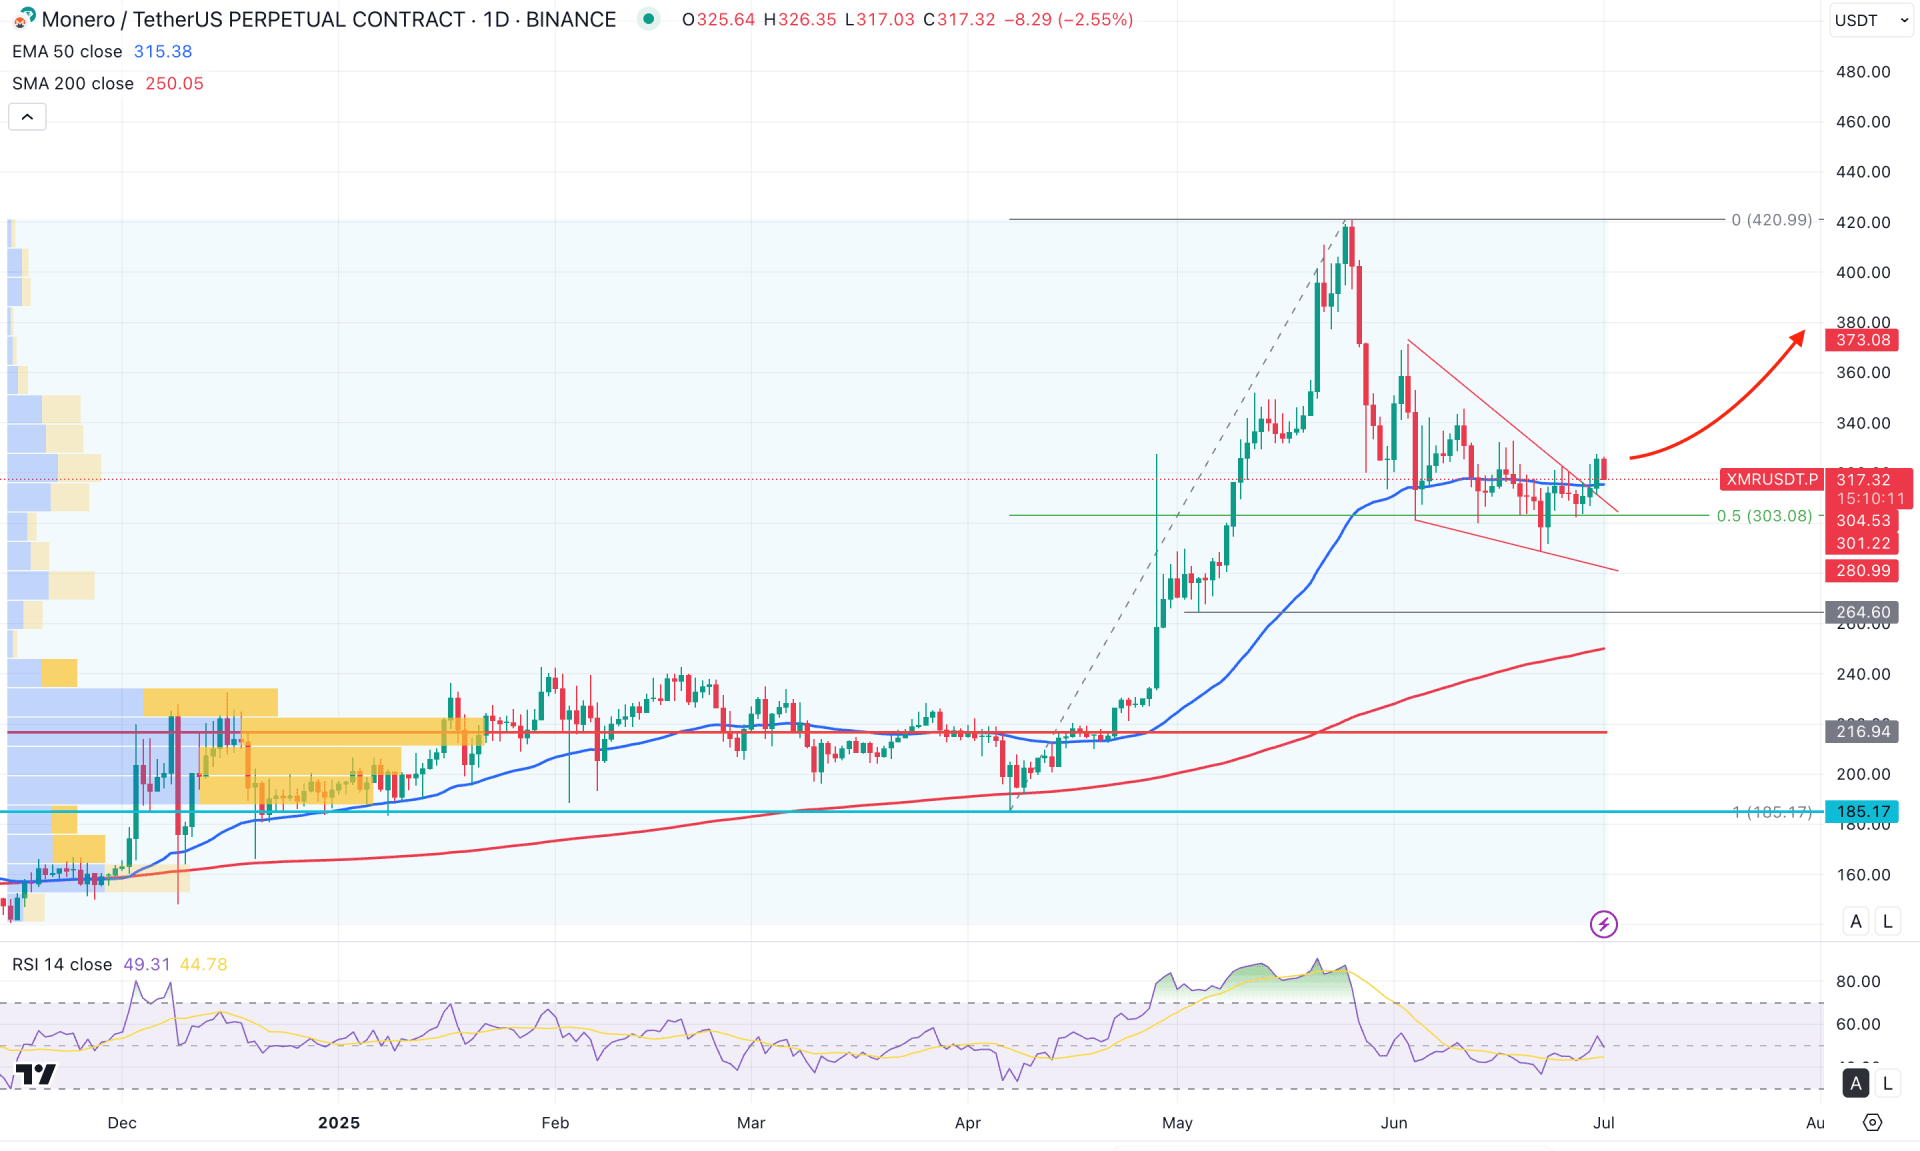
In the daily chart of XMR/USDT, a prolonged bullish wave is visible, where the current price is trading at the crucial 50% Fibonacci Retracement level. Primarily, investors might expect a bullish continuation opportunity as long as the long-term trend is active.
In the higher timeframe, the current price is trading within a bullish wave, where the most recent monthly candle was closed as a doji. As the current price is trading bearish from the monthly opening a bullish flip above the near-term weekly resistance of 345.87 level could be a potential continuation signal.
In terms of the trading volume, the bullish continuation is possible as no significant high volume level was formed at the May 2025 high. However, the price has already formed a bearish recovery from the top, which needs a proper price action to form before anticipating a bullish possibility.
In the main price chart, the downside recovery from the 420.99 high took the price towards the 50% Fibonacci Retracement level from the April-May 2025 swing. Primarily, the price has formed a bullish rebound from the crucial Fibonacci level, which could validate the long opportunity. Moreover, the ongoing buying pressure is visible above the falling Wedge pattern with a bullish daily close above the 50-day EMA.
On the other hand, the 200 day Simple Moving Average is below the 264.94 swing low with a bullish slope. It is a sign of a long-term bullish trend formation, which is a confluence buying pressure of the falling wedge breakout.
In the secondary indicator window, the Relative Strength Index (RSI) hovers at the 50.00 neutral area, which signals a sideways momentum. Moreover, the ADX is below the 20.00 satisfactory line, while the CCI is at the overbought zone.
Based on the daily market outlook of XMR/USDT, the ongoing buying pressure might extend after overcoming the 332.81 swing high. In that case, the price might extend and create a new resistance above the 373.08 high.
On the other hand, the immediate support is at the 303.08 level, which is the mid Bollinger Bands level. A downside pressure with a daily close below this line could be a minor downside opportunity, targeting the 264.60 level. However, an extended selling pressure below the 264.00 level might extend the loss and find a strong support from the 185.17 level.
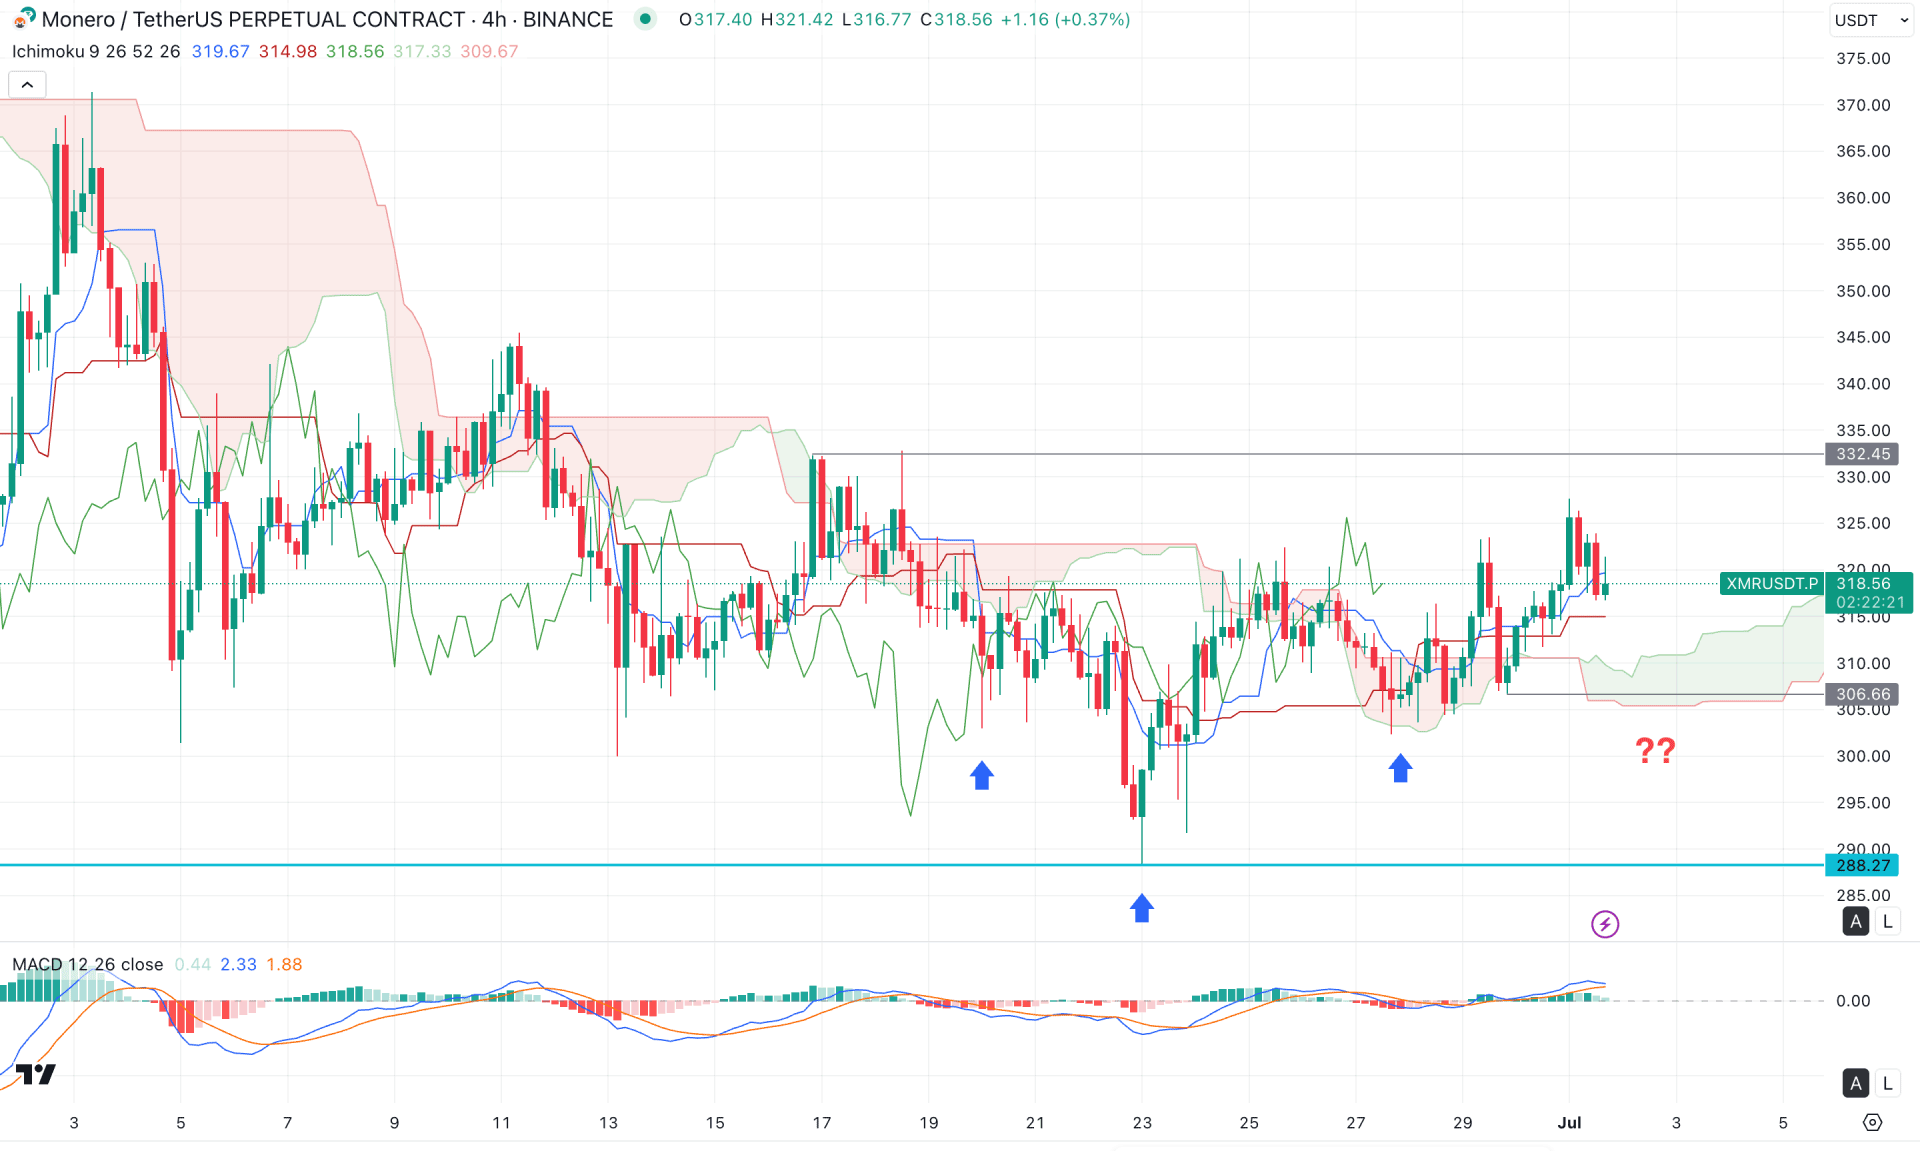
In the H4 timeframe, the recent price is trading bullish, where the near-term support is found from the Ichimoku Cloud zone. Moreover, the Senkou Span A and Senkou Span B aimed higher in the futures cloud, signalling an additional bullish sign.
In the secondary indicator window, the MACD Histogram is at the neutral point, signalling an indecision. Moreover, the Signal line reached the highest level in a month before forming a bearish crossover.
Based on the H4 outlook, the ongoing buying pressure needs more confirmation before forming a strong trading opportunity. Primarily, a bullish continuation with a stable price above the 332.45 level could validate the inverse Head and Shoulders pattern. In that case, the price might extend the upward pressure and move beyond the 370.00 psychological line.
On the other hand, the extended downside pressure with a bearish H4 candle below the 300.00 psychological level could open a bearish signal, targeting the 288.27 support level.
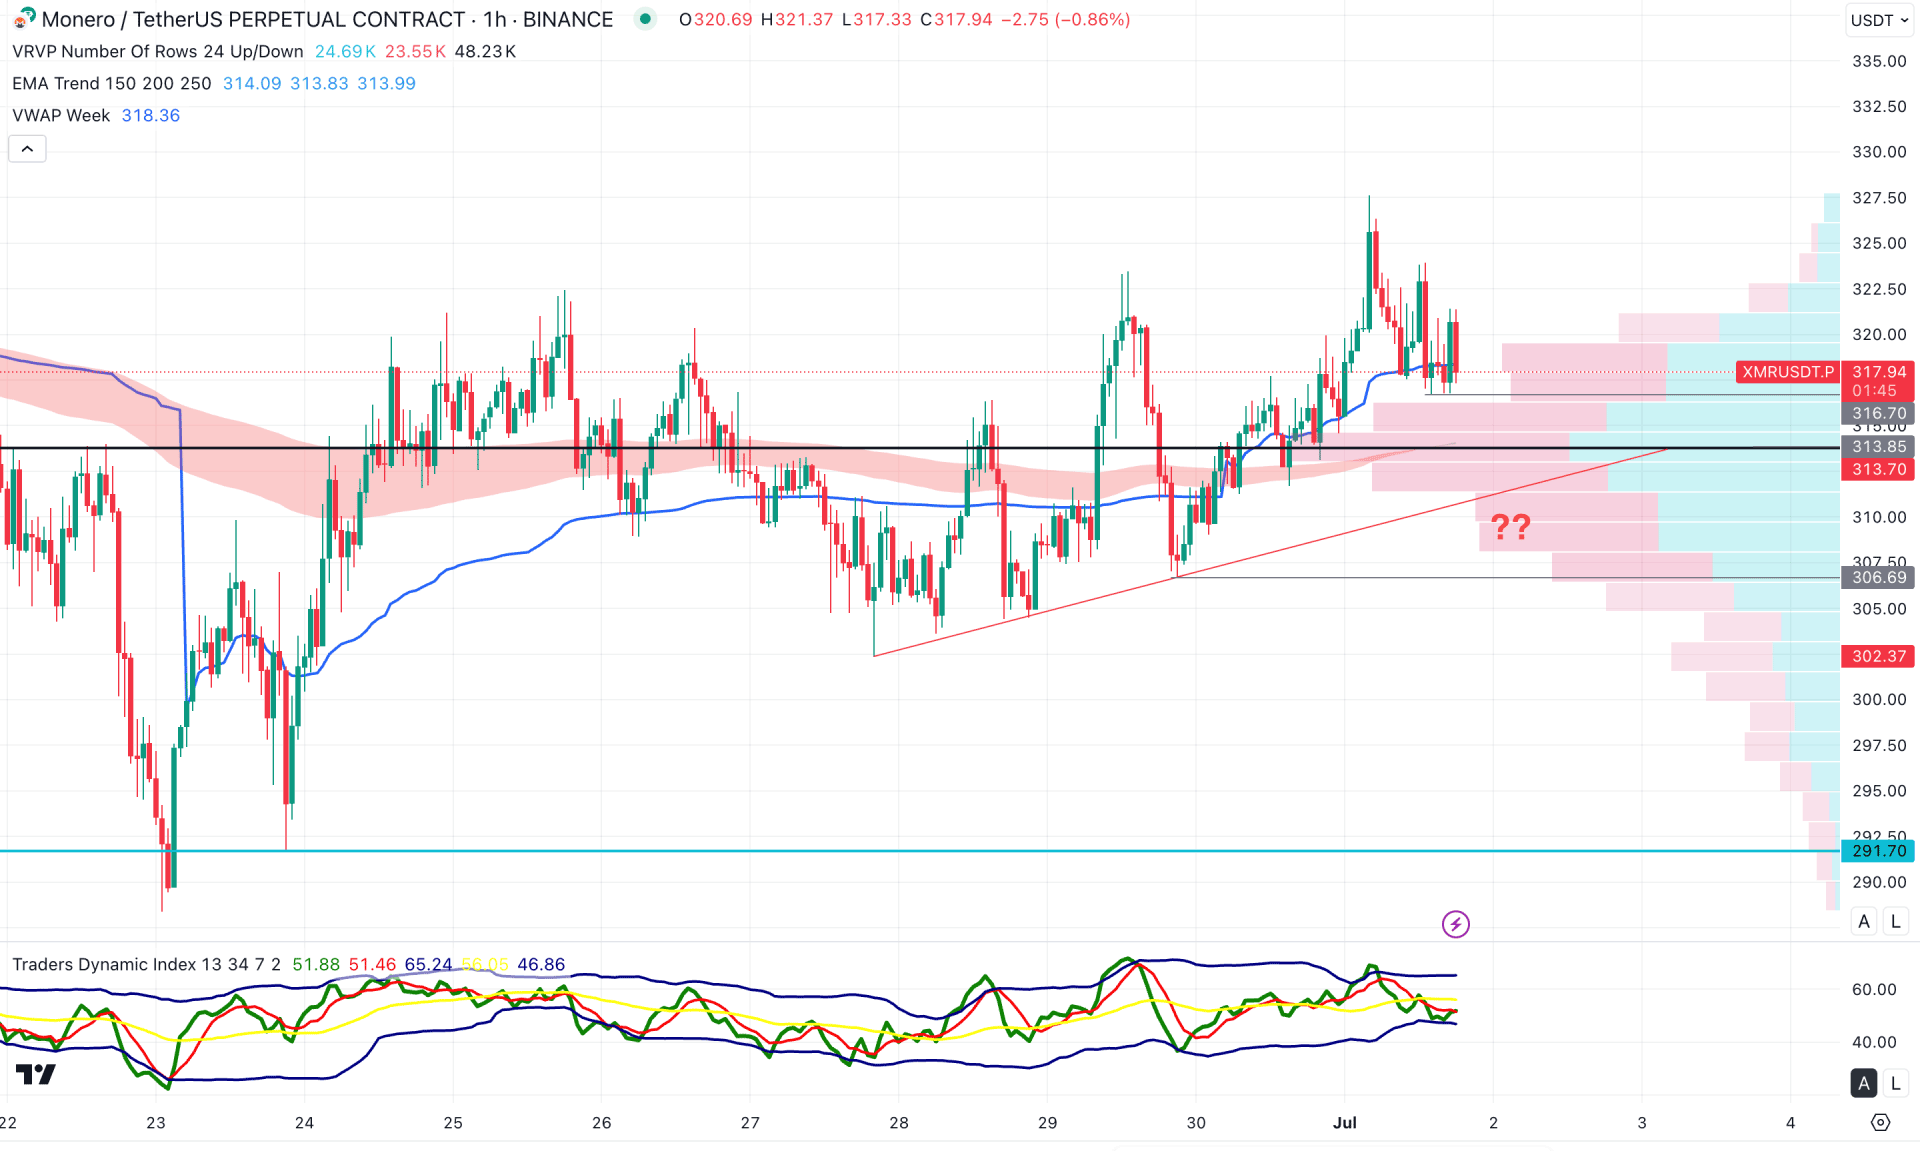
In the H1 timeframe, the XMR/USDT price is trading sideways above the Moving Average wave, signalling an ongoing buying pressure. Moreover, the weekly VWAP is working as an immediate support, supporting the bullish possibility.
In the indicator window, the Traders Dynamic Index (TDI) reached the lower bands level, signalling a possible bottom formation.
Based on the current H1 outlook, the price might extend the downside correction and find support from the 313.85 high volume support. However, the major structure is bullish from where any upward pressure in the intraday chart could be an early long opportunity.
Based on the current market structure, XMR has a higher possibility of a bullish trend continuation from the falling wedge breakout. Investors should keep a close eye on the intraday chart, as any valid bullish rebound from the intraday price could be an aggressive long opportunity.


