Published: September 5th, 2024
Monero (XMR) seems to be focusing on its internal circle and has stayed out of the conventional cryptocurrency conversation in recent months. With some lingering activity on Kraken, XMR primarily trades on Gate.io following its removal from Binance.
Perhaps due to the latest upgrade that made tracking confidential transactions even more challenging, Monero has seen an immediate spike in interest. Recently, Monero's resistance to statistical evaluation was strengthened. All XMR used to be private and only available to a select 16 senders. The most recent update provides evidence that any one of roughly 100,000 wallets might be the sender.
The Monero neighborhood has pointed out that the recent increase in hunts results from unintentional word-of-mouth. The queries might be connected to a Monero online quiz question. Conversely, August saw an even greater spike in searches for "XMR," indicating interest in the cryptocurrency itself. Current trading activity has also shown an increase in this trend.
Monero still uses hard forks to update its protocol, requiring each node to run an updated version. With 4,600 nodes in use globally, the Monero network can reach 13,000 nodes via the Internet on busy days.
Users of Monero have voiced complaints that adopting the coin is more difficult than with other contemporary tokens. Monero wallets need to synchronize to show balances, which can take several hours at a time. Furthermore, purchasing XMR is not simple for inexperienced users.
Let's see the further aspect of this crypto from the XMR/USDT technical analysis:

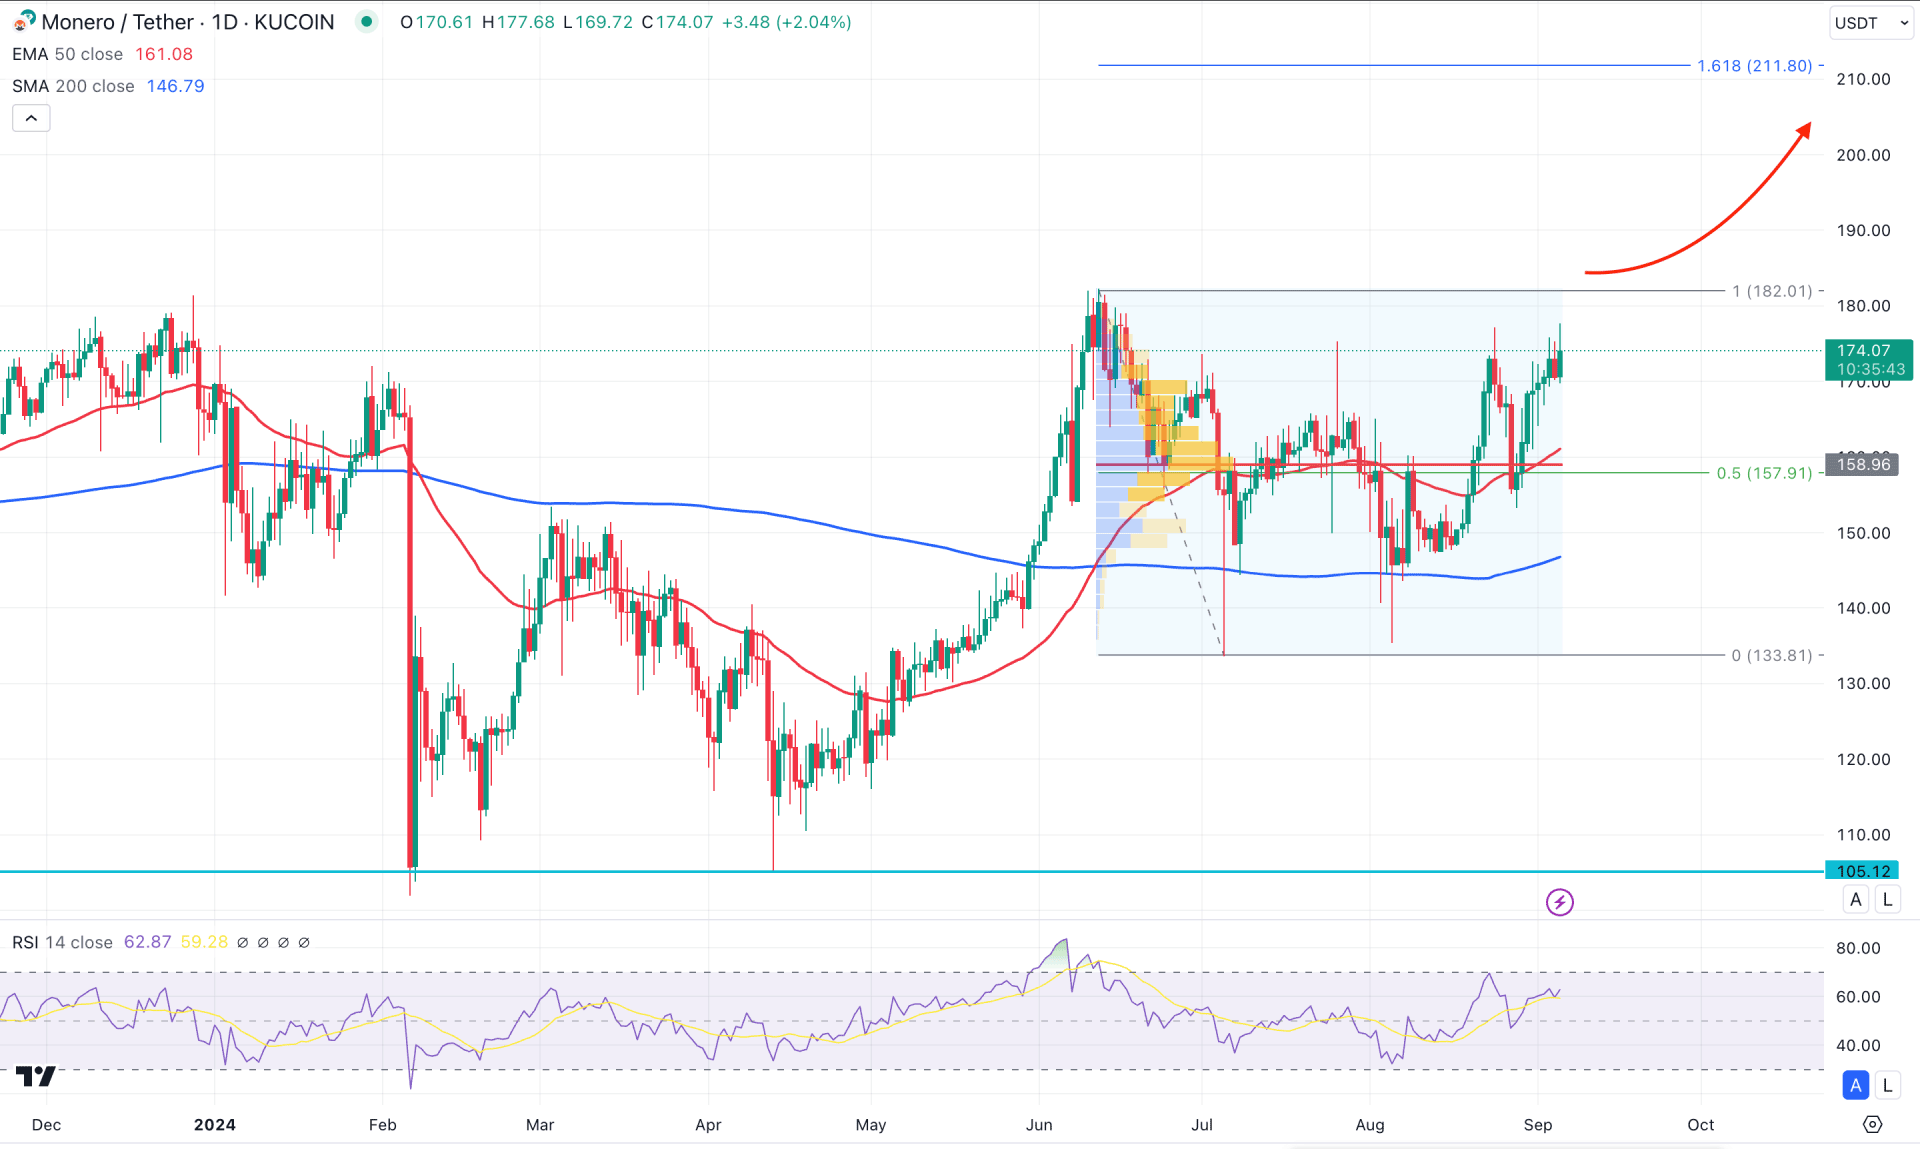
In the daily chart of XMR/USDT, the recent price shows a bullish recovery after finding a bottom at the 106.12 level. As long as the long-term bullish trend is active, the primary aim for this pair is to look for long trades.
In the higher timeframe, a strong bullish V-shape recovery is visible in the monthly chart, where the current price hovers below the crucial monthly resistance. Moreover, the weekly price shows an active buying pressure at the resistance area with no sign of a bearish recovery.
In the volume structure, the similar outlook is visible, where the current high volume line is at the 158.96 level. In that case, we may expect the buying pressure to extend as long as the high volume level works as a support.
In the main price chart, the 200-day Simple Moving Average and 50-day Exponential Moving Average are below the current price. This is a sign that the long-term and medium-term traders are still on the buying side, which may extend the trend in the coming days.
The current level of the Relative Strength Index (RSI) is below the 70.00 line, and it has failed to break below the 50.00 neutral point.
Based on the daily market outlook, the upside pressure might extend in the coming days as long as the 200-day SMA works as support. Considering the ongoing trend continuation momentum the price is likely to move higher and find a resistance at the 200.00 psychological line. Moreover, a stable market above the 182.01 high could extend the buying pressure above the 211.80 level, which is a crucial Fibonacci Extension line.
The alternative approach is to find a failure to break above the 182.00 level, where a valid bearish reversal from this zone could extend the range by testing the 133.81 level.

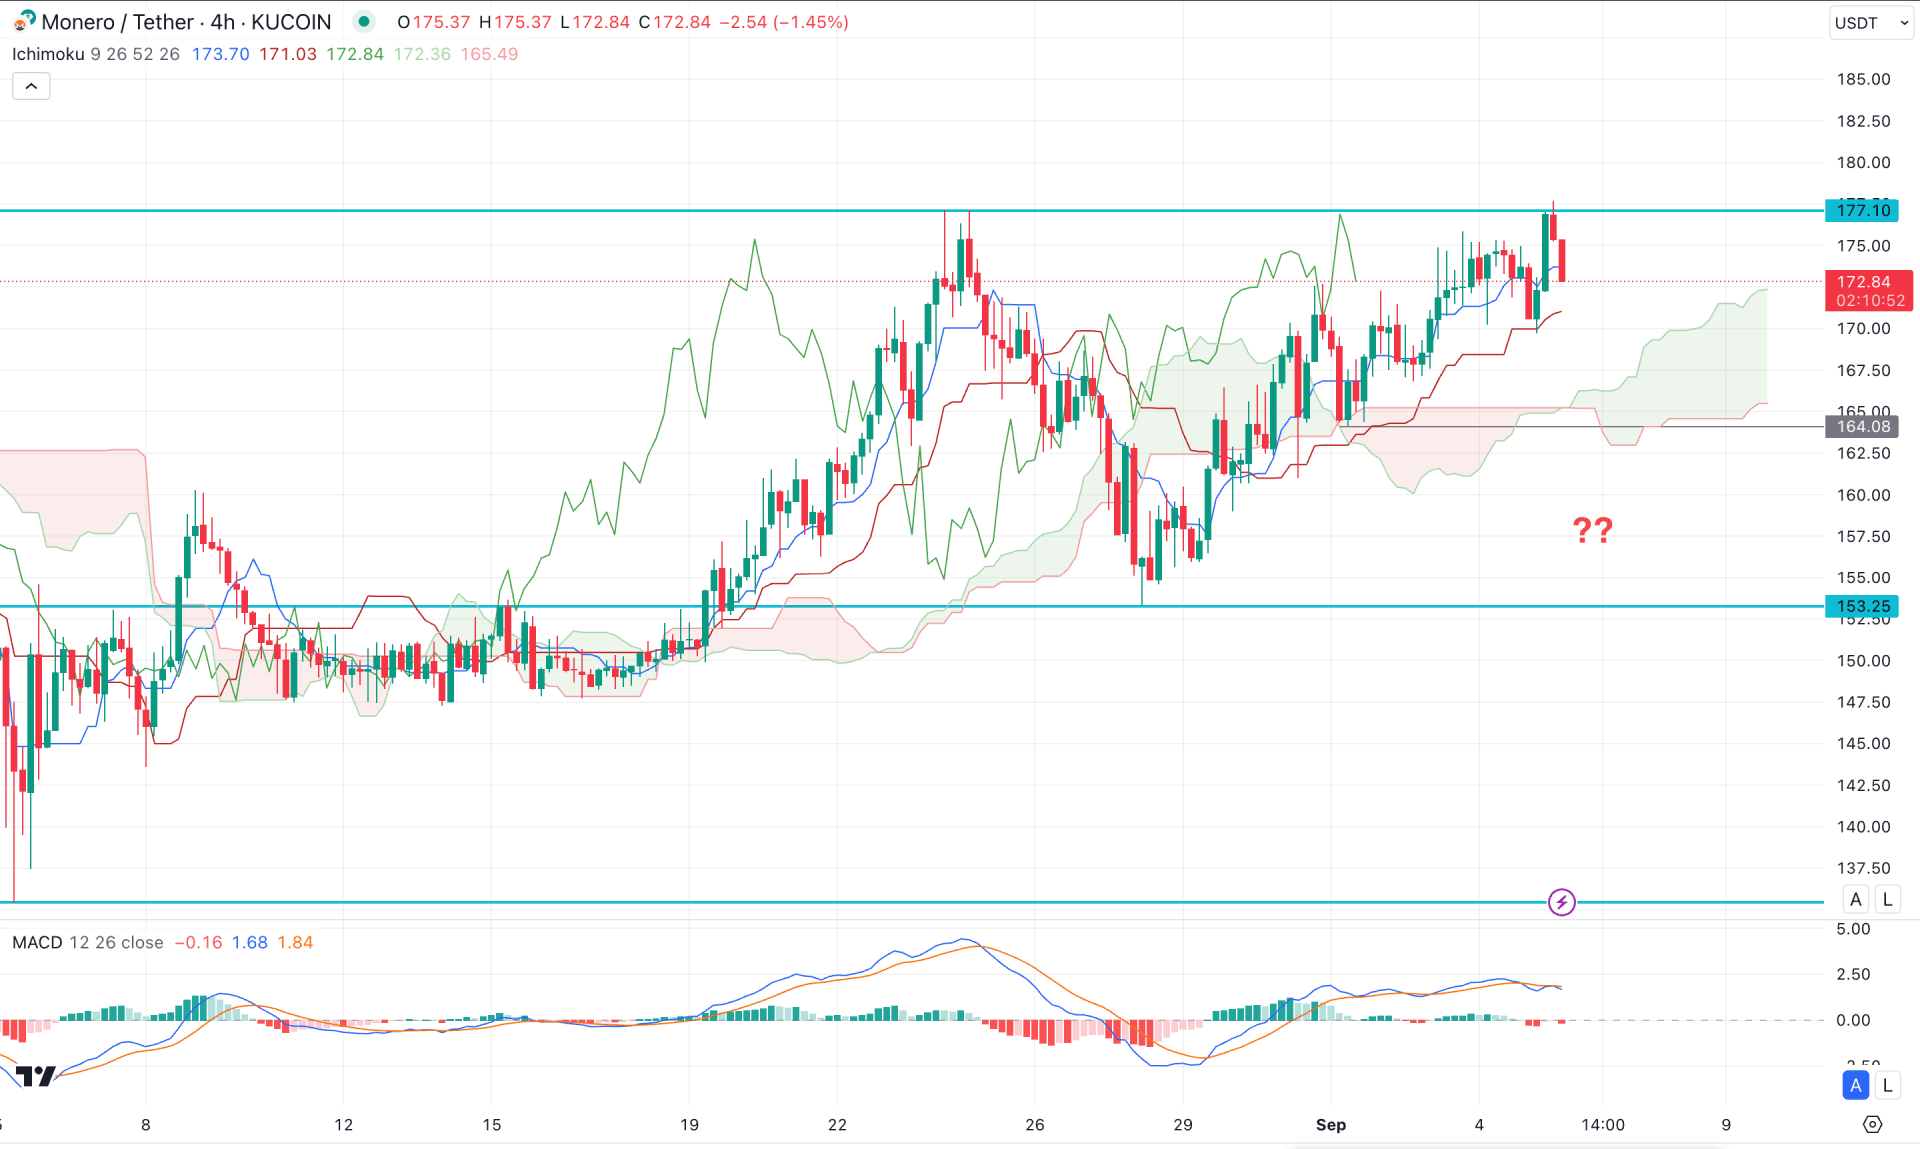
In the H4 timeframe, the ongoing market momentum is bullish, supported by the bullish V-shape recovery. Moreover, the Future Cloud suggests strong buying pressure as the Senkou Span A aimed higher, above the Senkou Span B.
In the secondary window, the MACD Histogram remains sideways, where the current Signal line is above the neutral point.
In this context, the price is likely to aim down and find support from the dynamic Kijun Sen level. However, depending on the price action, a bullish reversal from the 167.00 to 162.00 zone could be a potential buying opportunity.
On the other hand, a valid bearish reversal with stable price action below the dynamic Cloud zone could be a short opportunity, aiming for the 165.00 area.

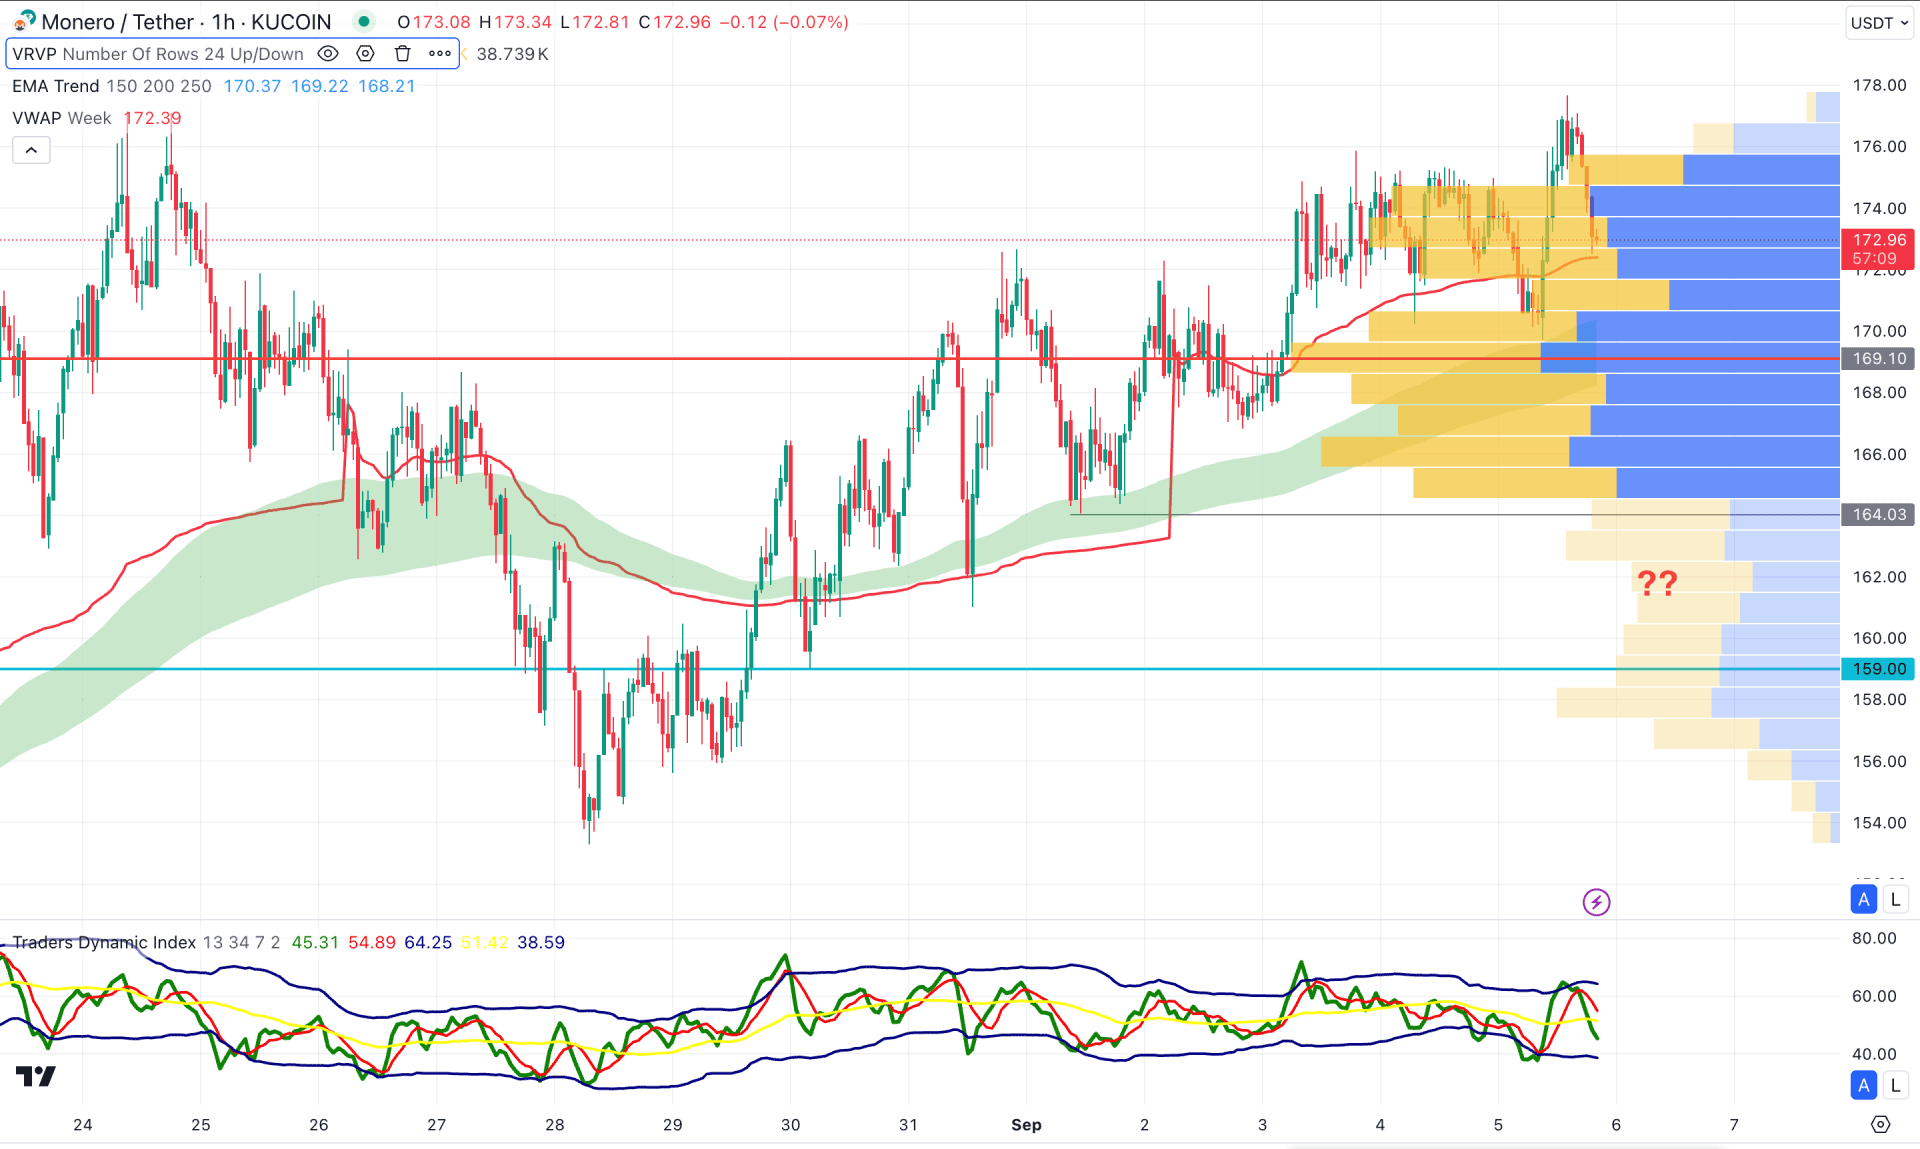
In the H1 timeframe, the current price trades at the premium zone, where the visible range high volume level is below the current price. Moreover, the moving average wave is also below the current price and is working as a crucial support. In this context, investors might do a downside correction from the premium zone from where a bullish reversal can resume the existing trend.
In the secondary window, the Traders Dynamic Index rebounded below the 50.00 line, suggesting a short-term sellers' presence in the market.
Based on the hourly chart, the current downside pressure might extend towards the 166.00 zone, but a valid buying pressure from the 164.00 to 160.00 area would be the buying point.
Based on the current market structure, XMR has a higher possibility of a bullish trend continuation from the current base. A valid rebound in the intraday chart could signal an early buying opportunity, following the major trend in the daily chart.