

Published: September 24th, 2026
It is now harder to find Monero (XMR) on major trading platforms. Several major exchanges have eliminated it since early 2024, some for all customers and some for a portion of their customer base.
Now, many holders face a practical dilemma: how to obtain Monero without an exchange account, and what they need. The removals were made gradually. One major exchange delisted XMR in January 2024, saying the coin no longer met its listing requirements. After deciding which assets to retain, a second major platform shut down XMR trading the next month. A third stopped XMR deposits and trading for some clients in late October 2024.
Meanwhile, traders looked to Monero (XMR), which remained unchanged after ZEC surpassed $1,000 in August
Regardless, the daily move matters far less to German holders than the regulatory clock running in the background. It establishes the channels through which XMR may continue to be exchanged within the EU.
Let's look at the outlook from the XMR/USDT technical analysis:
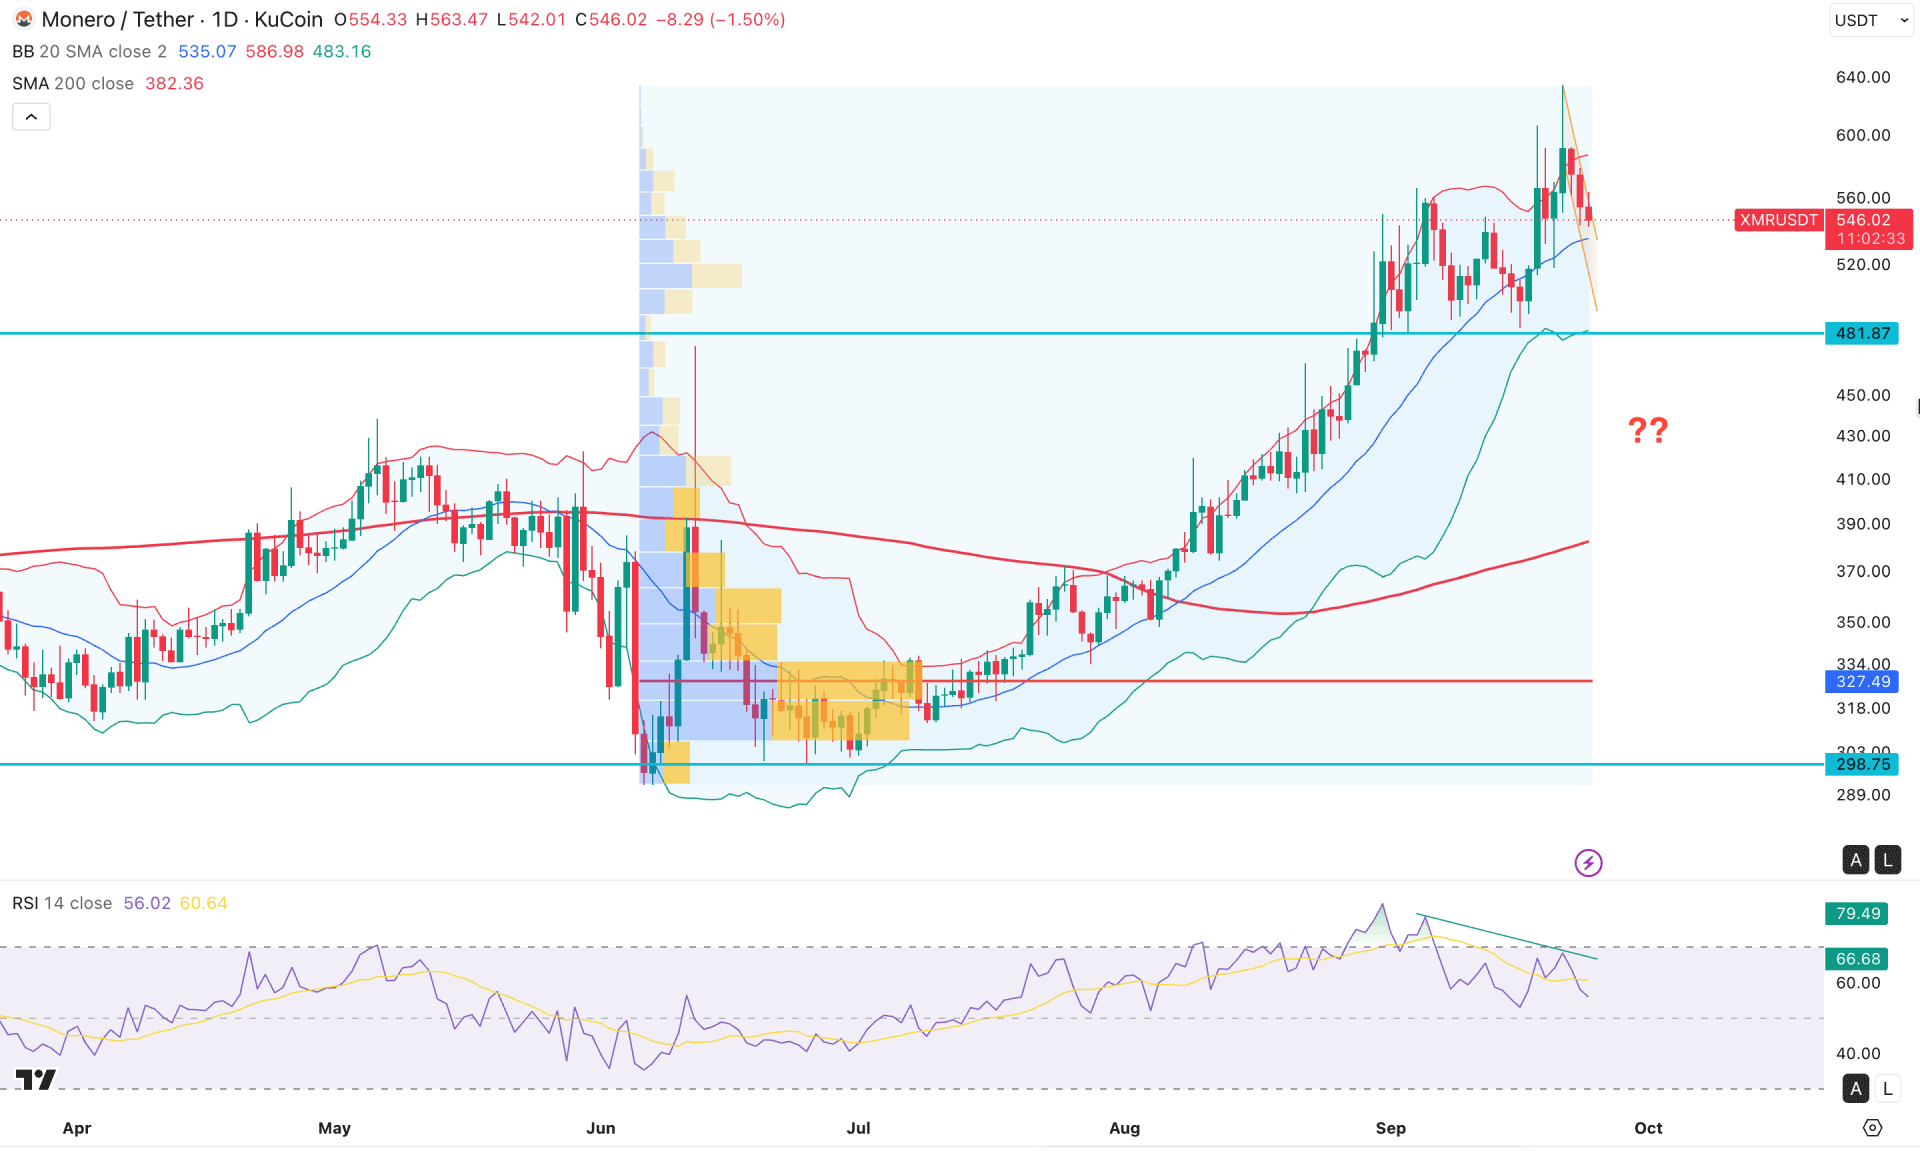
On the XMR/USDT daily chart, an extended, volatile market structure is visible, with price trading at a six-month high on a strong bull trend. As price struggles to sustain buying pressure amid multiple bearish rejections at the top, a significant downside correction may appear before the current trend resumes.
On the higher timeframe, bullish momentum is solid, as the monthly candle suggests a strong bullish close followed by an inside bar breakout. However, price has approached the premium zone, so we need stronger bullish indications before anticipating further gains. The weekly timeframe shows a corrective, volatile structure, with multiple inside-bar characteristics within a bullish trend.
On volume, price is trading in the premium zone, as the gap between the high-volume line and the current price has widened significantly. Even though price is trading above the high-volume line, the gap suggests a moderate correction is pending as mean reversion.
Looking at the current price structure, multiple bearish rejections are visible at the upper Bollinger Band resistance, which is signalling pressure on buyers. Moreover, volatility is supported by a clear divergence on the Relative Strength Index, where the RSI failed to sustain gains above the 70.00 overbought area.
Based on the overall market structure, the immediate support level to watch is 481.87, which could be tested after the reversal candlestick at the upper Bollinger resistance. Moreover, a failure to hold 481.87 could trigger a deeper correction, with the possibility of testing the 200-day Simple Moving Average.
An alternative approach is to watch price action below the mid Bollinger line, which could be a discounted zone in the current structure. In that case, a rebound from 510.00 to 470.00, with a recovery above the mid Bollinger line, could offer an immediate long opportunity targeting the 750.00 psychological resistance level.
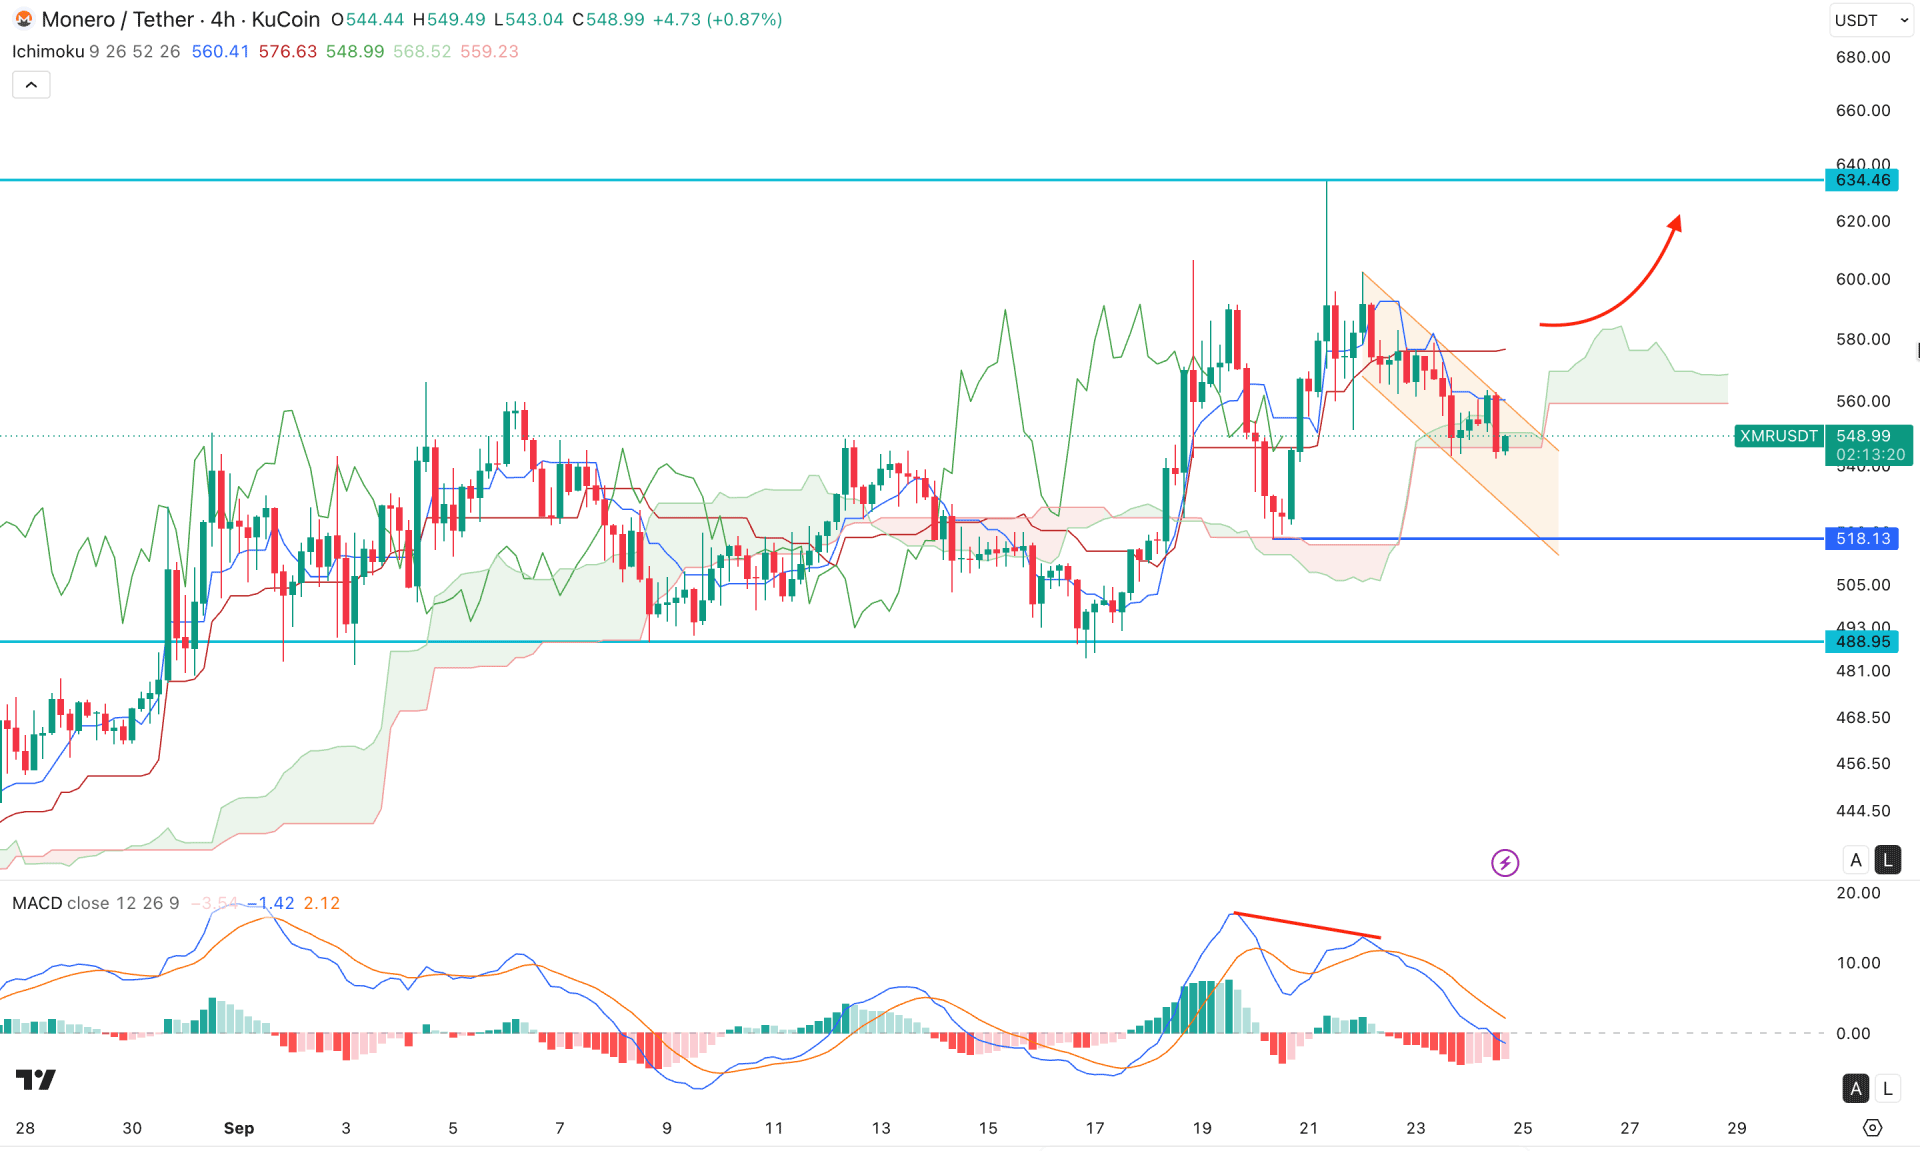
On the four-hour timeframe, XMR/USDT is trading within a bullish structure, as the current price tests the crucial cloud support. As price trades within a descending channel, with the structure below the dynamic resistance area, a valid bullish breakout is needed before buying pressure can extend.
In the indicator window, the MACD signal line formed a divergence by failing to create a new swing high in the positive area. This signals a possible top formation, after which bearish pressure is likely.
Based on market structure, a valid bullish breakout above the 580.00 area could increase the chance of a new swing high above the 634.46 level.
An alternative approach is to look for a range extension opportunity, which could be tested at 518.13. A bullish turn from the 518.13 area to the 488.97 area could offer another long opportunity targeting the 600.00 psychological line.
As ongoing market pressure remains bearish within a descending channel, a channel extension is highly possible, and immediate selling pressure below the 518.13 level could extend losses at any time.
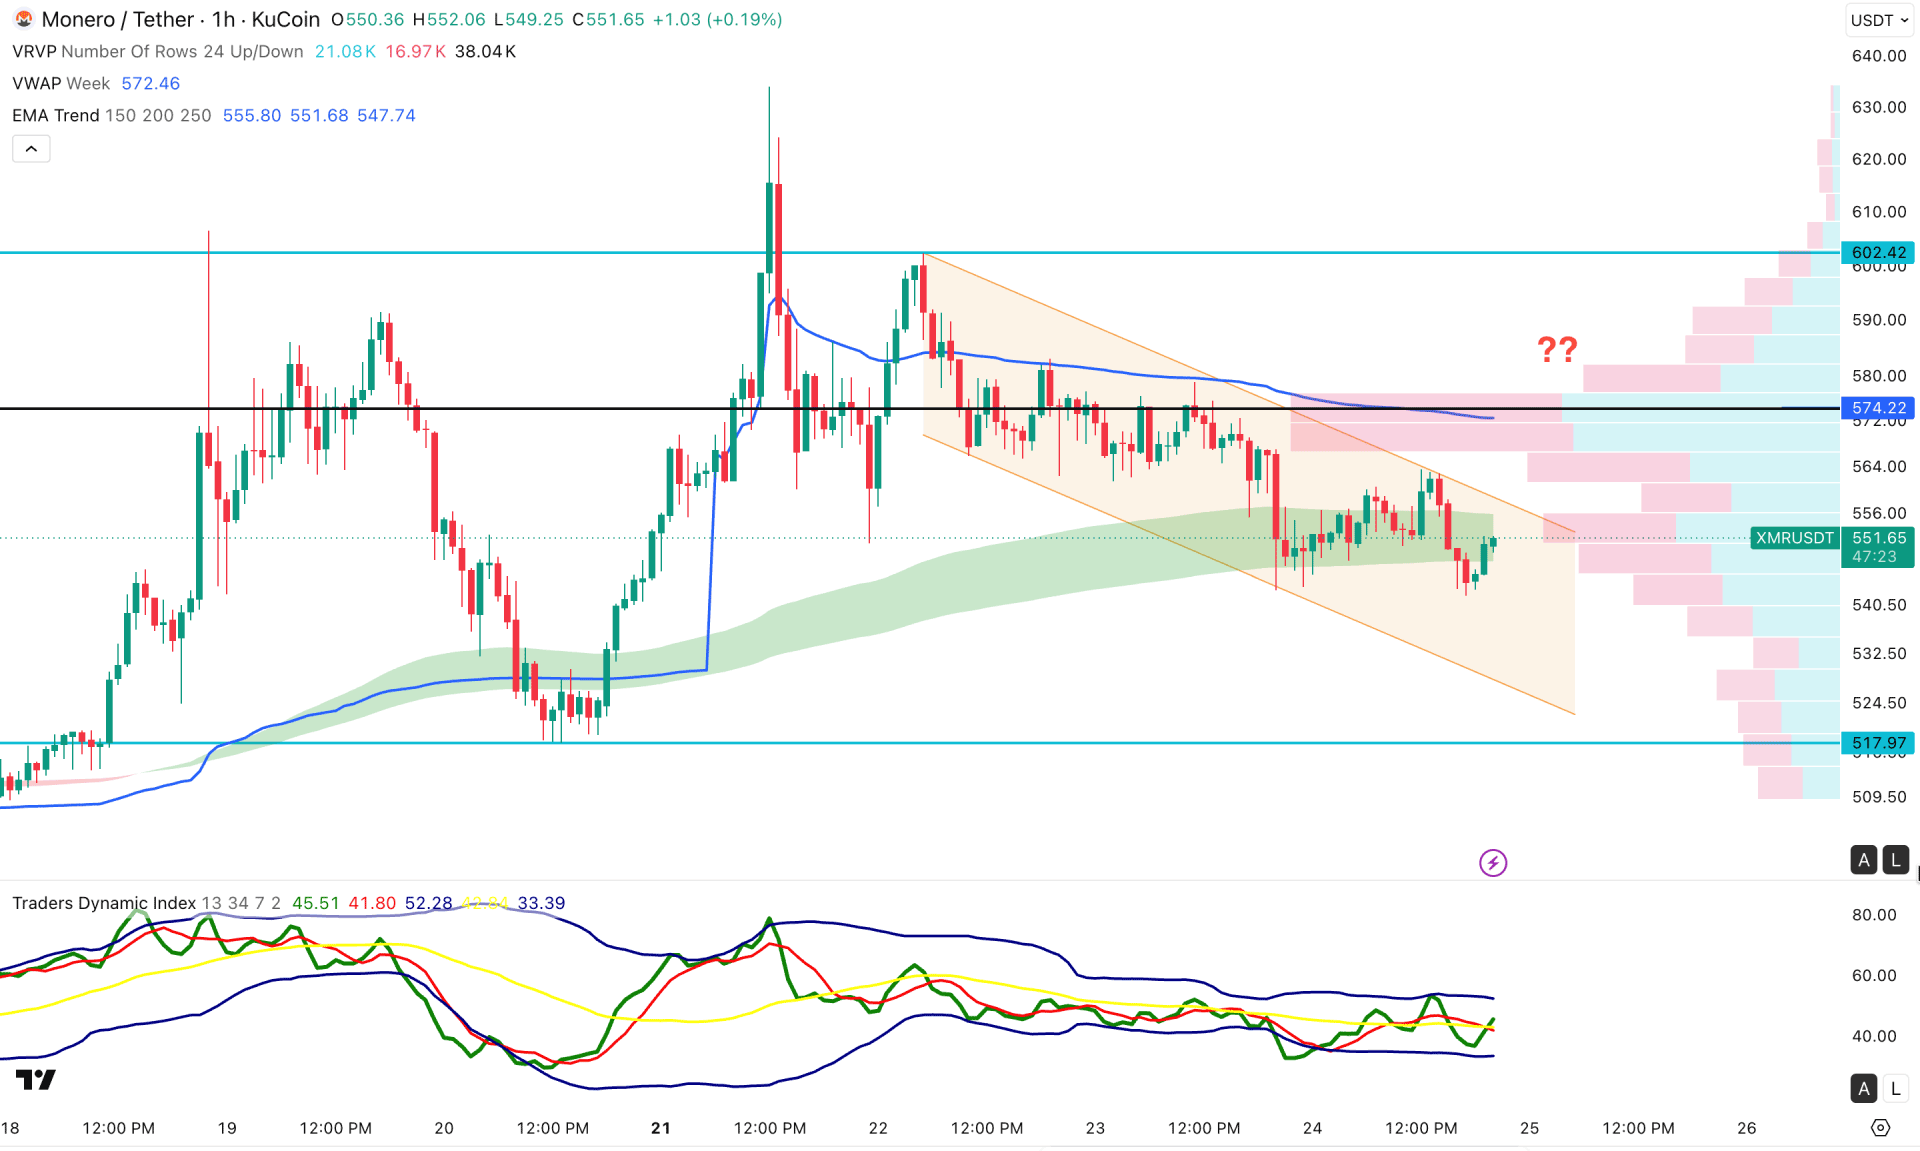
On the hourly timeframe, XMR/USDT is trading with corrective bearish momentum after creating a new swing high at 633.62. This signals active bullish continuation momentum, making a bullish impulse highly possible.
In the main price structure, sideways momentum is visible within the EMA wave, as the weekly VWAP level is above the current price. The Traders Dynamic Index tells a different story: the current line is above the 50.00 level, with more room to extend higher in positive territory.
Based on market structure, XMR/USDT is trading in a bearish trend, where a bullish break and recovery above 574.22 could open a long opportunity targeting 650.00.
The alternative trading approach is to anticipate a bearish continuation as long as the price remains below the 574.22 level. In that case, the immediate support level to watch is 507.97, which could be tested in a bearish continuation.
Based on market structure, XMR/USDT is trading in a bullish trend, and recent volatility at the bullish peak area is signalling a decent downside correction possibility. Investors should monitor near-term price action, as the daily swing low could be tested, creating a sell-side liquidity-grab opportunity.


