Published: January 18th, 2021
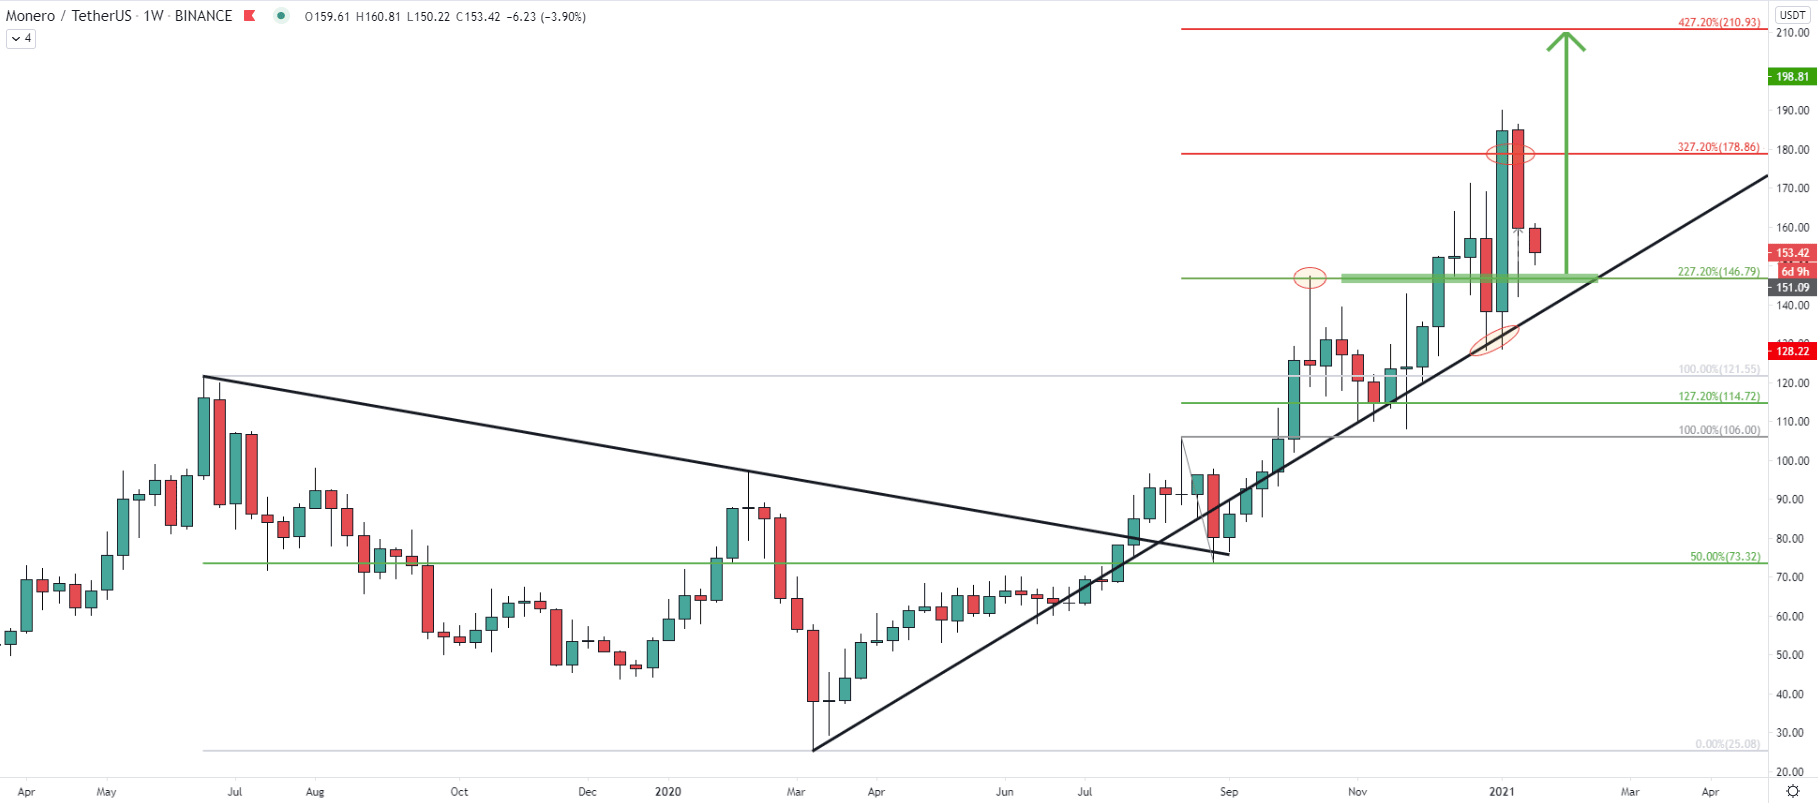
Monero has established a clear uptrend since March 2020. At that time price has tested the bottom at $25.00, which was psychological support. Since then the price has grown by 522% and currently, XRM/USDT is trading near $150 mark. Back in August, XMR/USDT broke above the downtrend trendline and on the correction down cleanly rejected the 50% Fibonacci retracement level at $73.32 level. After this bounce, XMR has been steadily outperforming the USDT and up until now reman above the uptrend trendline. Moreover, just a few weeks ago price rejected the trendline once again, and produced a new higher high, validating the uptrend.
Fibonacci was applied to the pullback, which occurred after XMR broke above the downtrend trendline. It is clearly visible that 227.2% Fibs at $146.79 was acting as the support and that 327.2% Fib resistance at $178.86 was broken. Such price action might imply the continuation of an uptrend, towards the 427.2% Fbis at the $210 resistance area.
As Monero is climbing up, it can be seen that resistance levels are becoming the support. First, it was a $106 level, but the most recent support, which previously was the resistance is obviously $146.79. This level corresponds to 227.2% Fibs and yesterday’s price cleanly rejected this price, which could have been the starting point of yet another upside move.
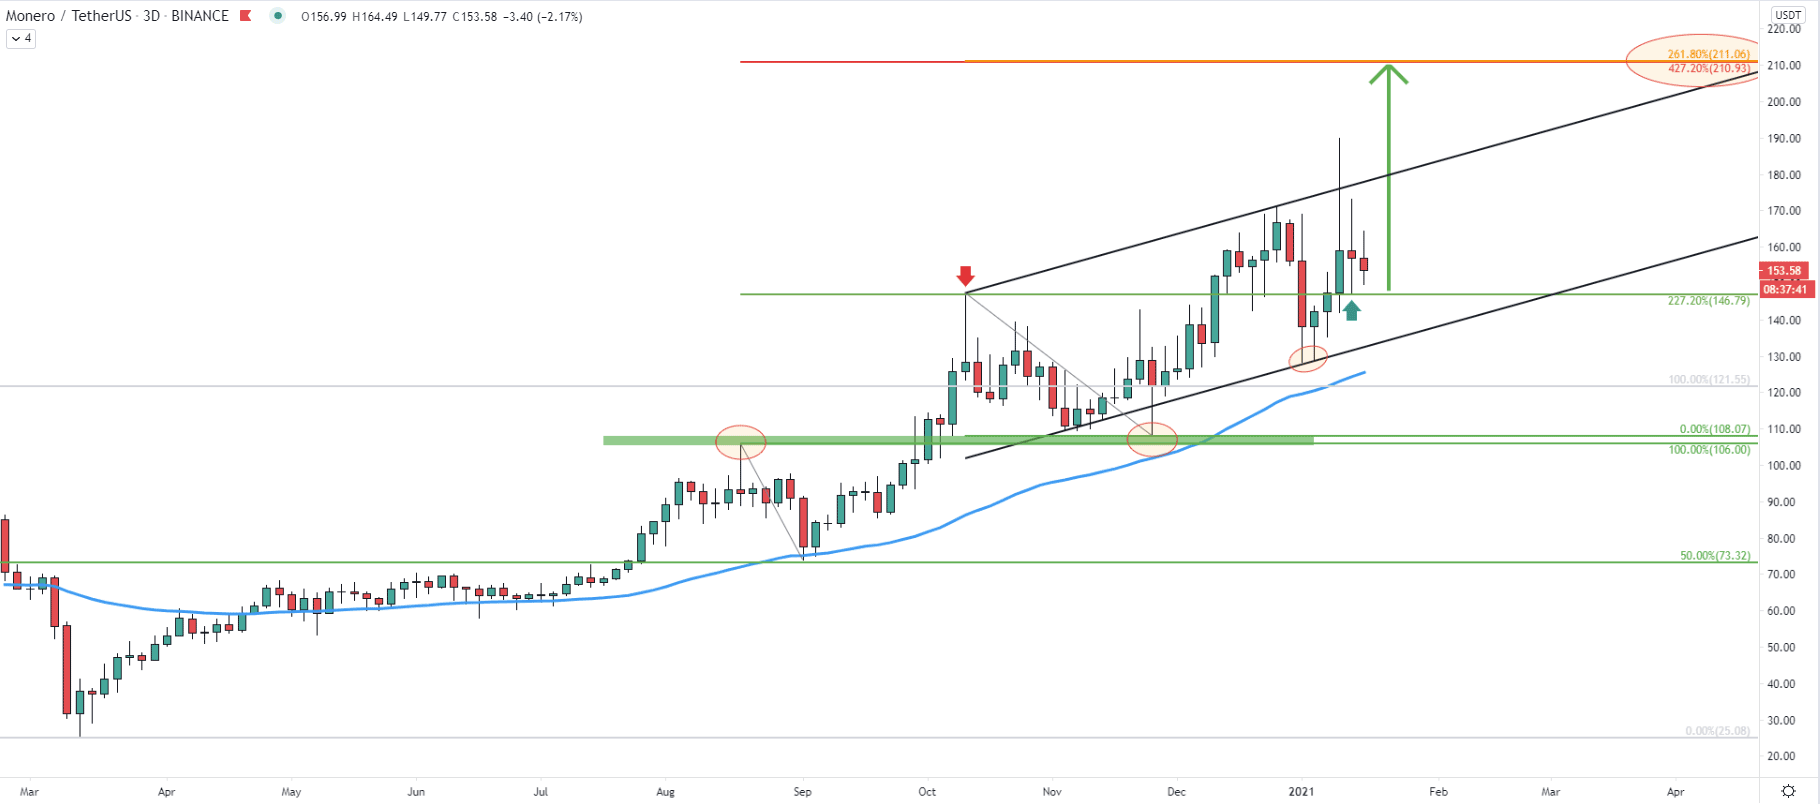
Currently, XMR/USDT is trading within the ascending channel and above the 50 Exponential Moving Average. While there are absolutely no signs or strong indications that the price is about to reverse, the probability remains highly in favor of the uptrend continuation. On this chart, two Fibonacci retracement indicators were applied to the last few downside corrections. Previously mentioned key resistance at $210 now corresponds to 427.2% as well as 261.8% Fibs, making it a very strong supply area.
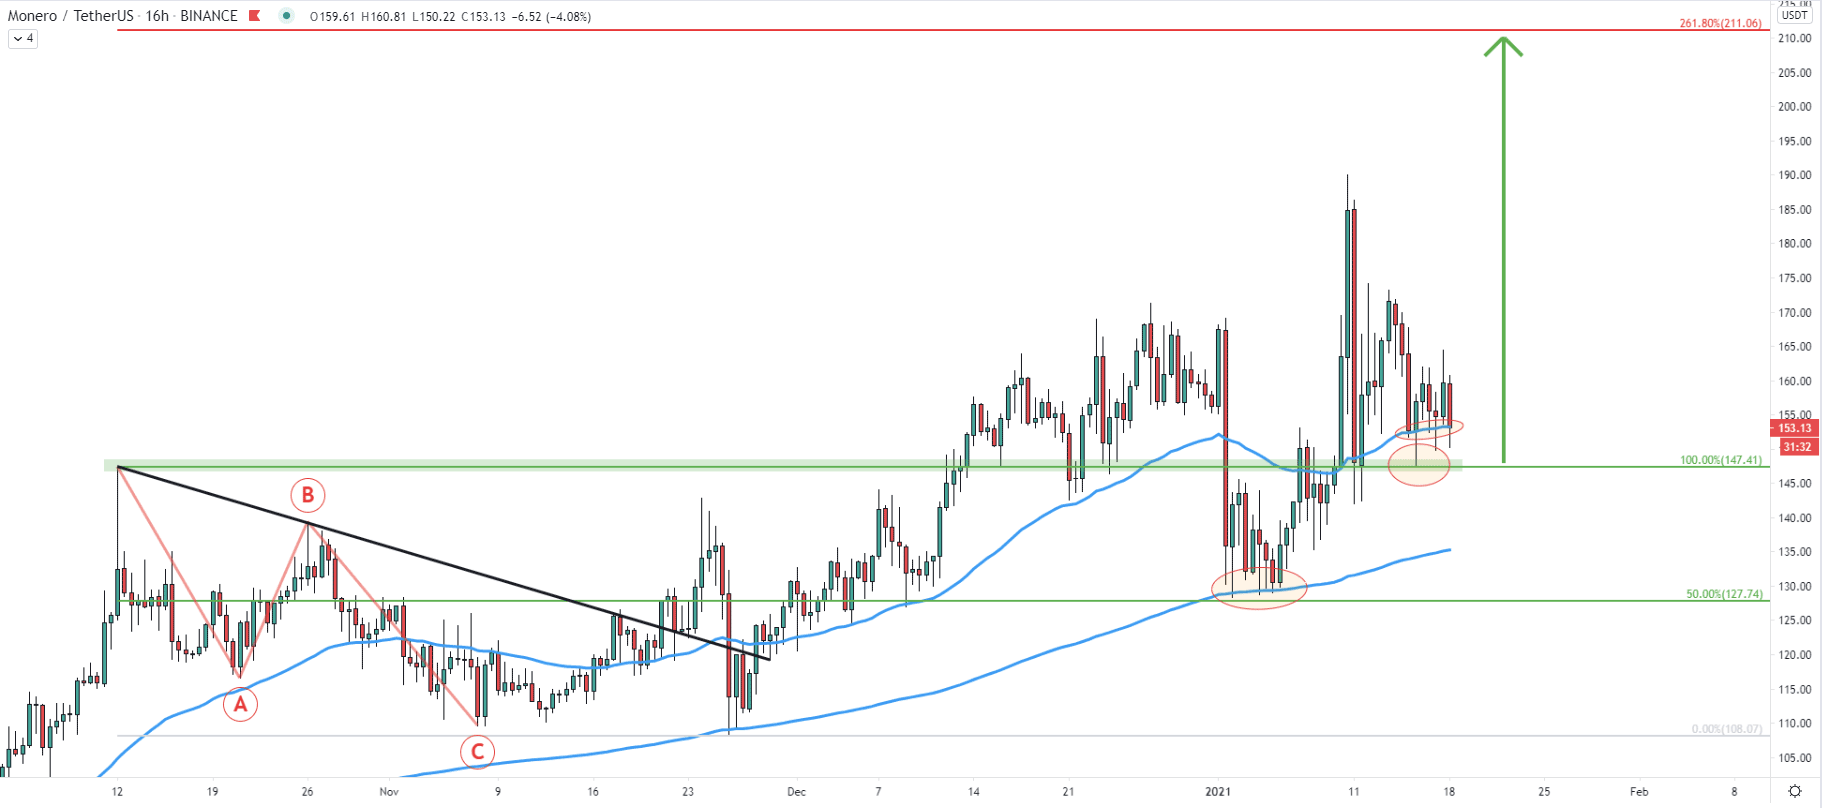
On the 16-hour chart, XMR/USDT completely and ABC correction pattern at the beginning of December 2020. Then price broke above the downtrend trendline, after which corrected down and rejected the 200 EMA. It certainly seems like a continuation pattern of the major uptrend. Also, at the beginning of January, there was yet another resection of the 200 EMA and right now, the price is bouncing off the 50 EMA as well as the previous area of resistance at $147.41. Of course, there is a possibility that $147.47 will get broken, in which case the price can decline back to $127.74 support. But as long as current support holds, the trend will remain heavily bullish.
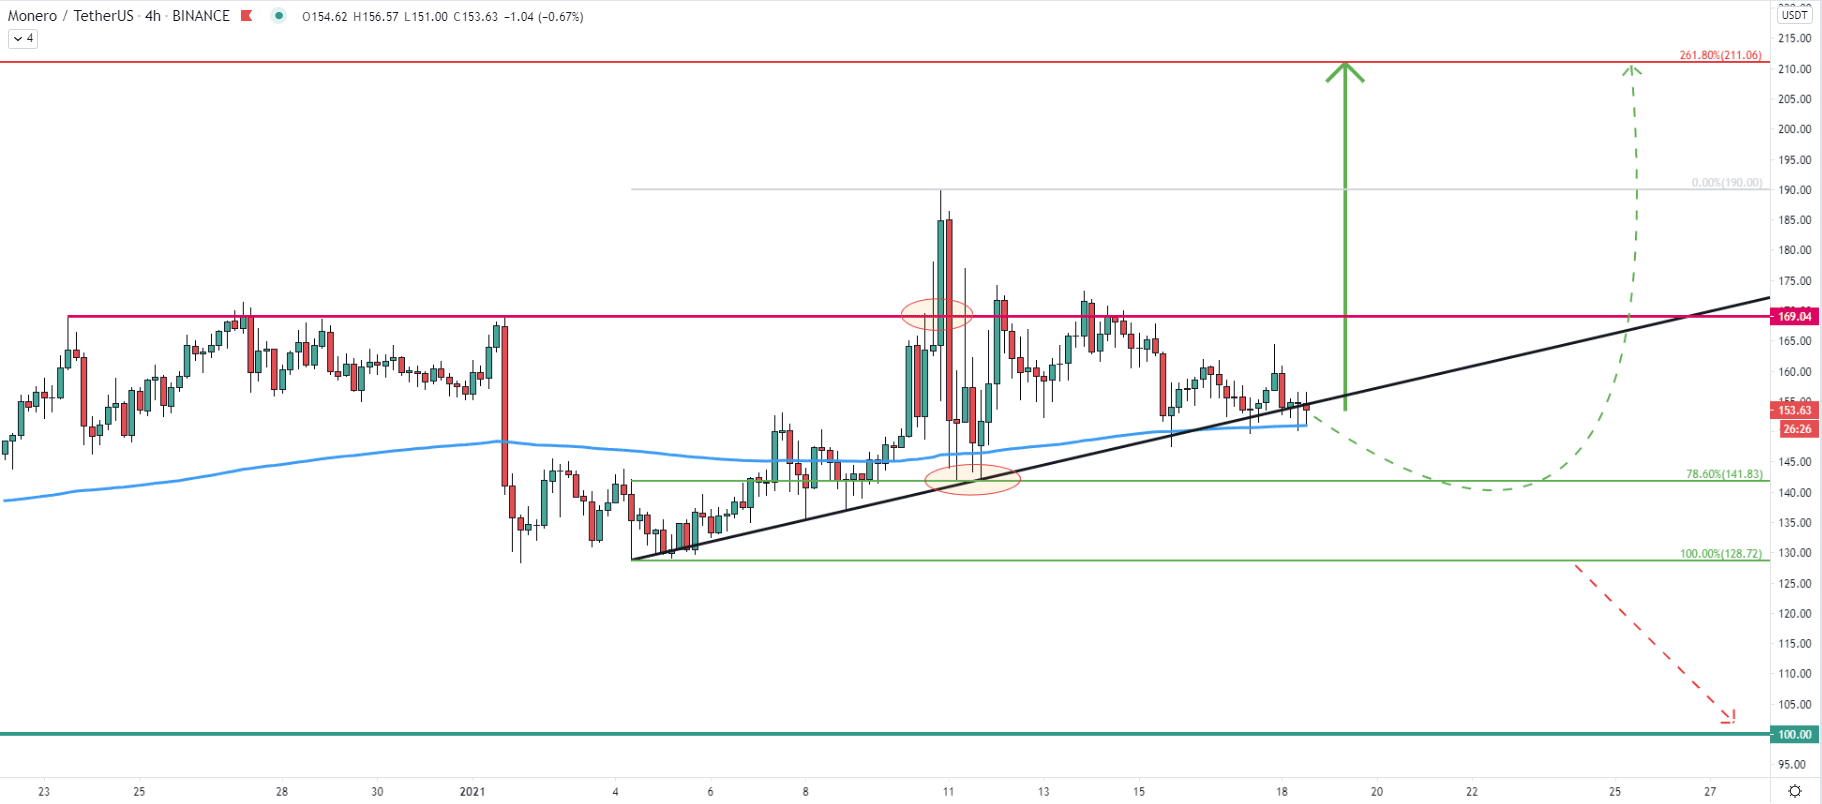
Even on the 4-our chart, the 200 EMA is being rejected along with the simple uptrend trenldine. As has been mentioned previously, there is a possibility that the price will move lower in an attempt to produce the spike below the $141 support area. In the worst-case scenario of an uptrend, XRM/USDT can even re-test the 128.72 support. But until this support is broken, buyers will remain in complete control.
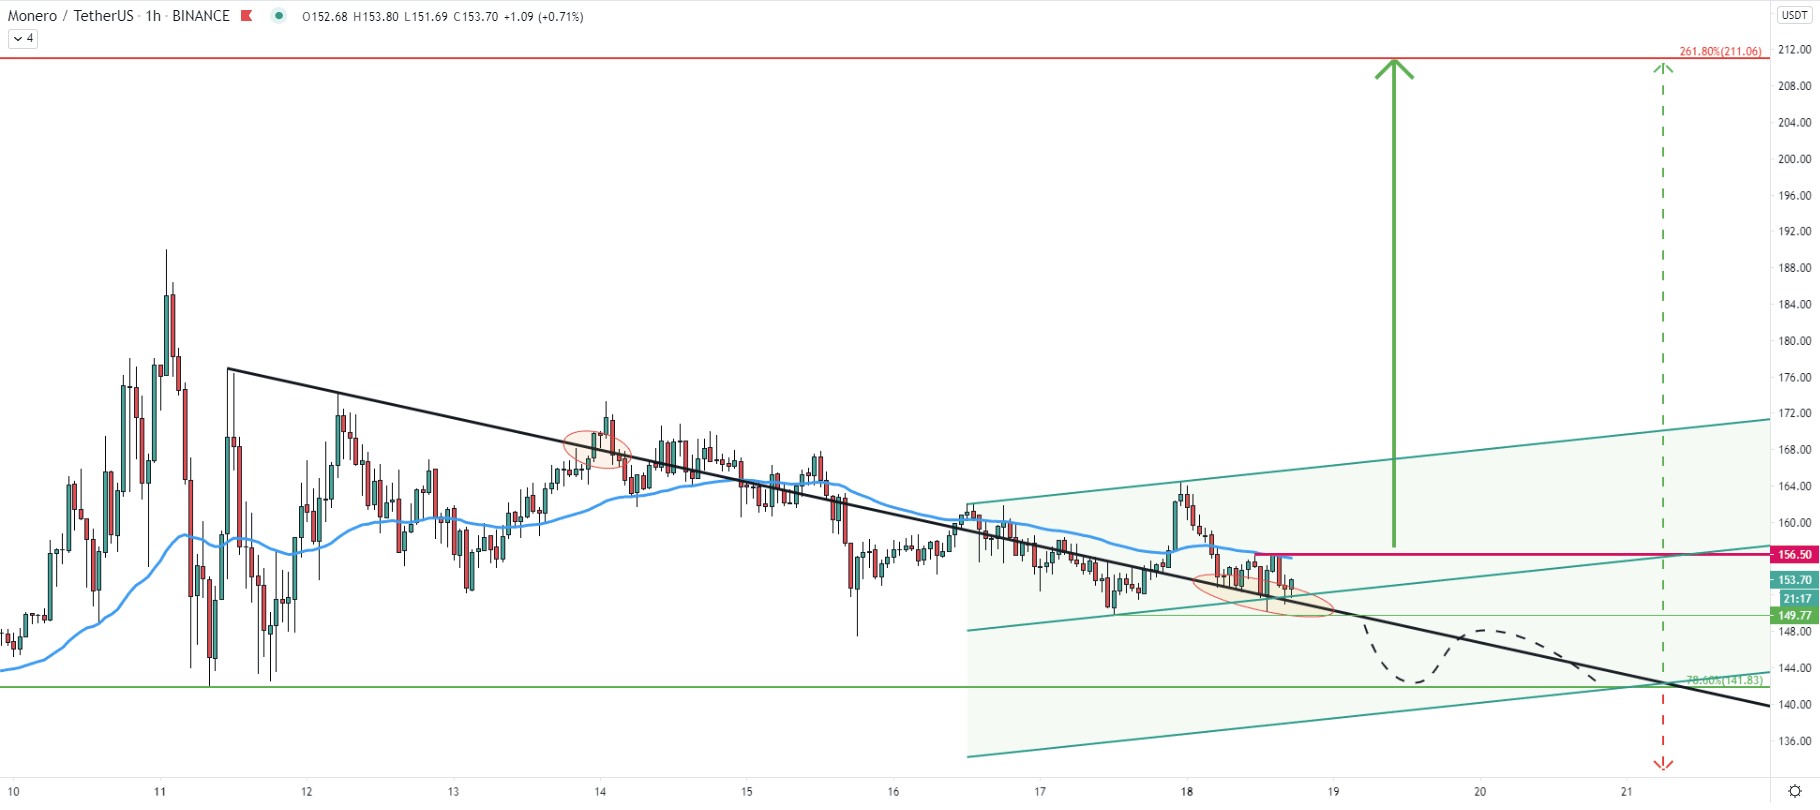
The downtrend trenldine got penetrated and today it is acting as the support, which is being rejected along with the bottom of the ascending channel. However, there is a minor resistance located at $156.5, where 50 EMA got rejected today. Perhaps buyers will be waiting for a confirmed break and close above this resistance, before taking any action. Therefore, the risk of further consolidation and/or yet another wave down on the lower timeframe, can not be ignored.
When/if a 1-hour candle will close above $156.50, buying volume is likely to increase substantially, or at the very least the volatility should become much higher. But this could be the final indication that the uptrend is about to continue.
On multiple timeframes, it can be seen that higher highs and higher lows are being produced. Resistances are getting broken after which they are becoming the support. The trend remains very bullish and considering that right now yet another support along with Moving Averages is being respected, the probability is highly in favor of an uptrend continuation in the short to medium term.
As per the 3-day chart, the key resistance could be located at the $210 area, which is confirmed by two different Fibonacci retracement levels. When/if this area will be reached, XMR/USDT will increase by 35%. Keep in mind, that this is only the nearest resistance, which can get broken and price increase might be much greater.
As per the 4-hour chart, the critical support level is at $128.72. If Monero’s price will move below this mark, the bullish forecast will get invalidated, in which case a consolidation phase is likely to start.
Support: 141.80, 128.72
Resistance: 156.50, 210.00