
Published: December 16th, 2021
Microsoft stock showed a 3.3% loss on Tuesday after the US PPI release that came at a historic high in November, 9.6% higher from the previous year. Moreover, the PPI came after the 6.8% jump in the Consumer Price index, showing the fastest growth in the last 40 years.
According to some analysts, the recent decline in Microsoft stock directly relates to the bad inflation report. Therefore, the current forecast for MSFT is that the company might grow its earnings by 15% over the next five years. However, considering the 10% inflation, the actual growth of the earnings report would be 5%.
In the last FOMC meeting, the Fed decided to double the asset purchase program by $30 billion a month. Currently, policymakers expect three rate hikes in 2022 that pushed the greenback to lose its momentum from the primary wave. Moreover, Powell noted that the rate hike would be an appropriate decision before the taper is completed.
Microsoft stock recovered from Tuesday’s loss and closed the day at 334.65. Considering the recent decisions from the Fed and earnings projection, Microsoft stock may grow higher in the coming days.
Let’s see the upcoming price direction from the Microsoft Stock (MSFT) technical analysis:
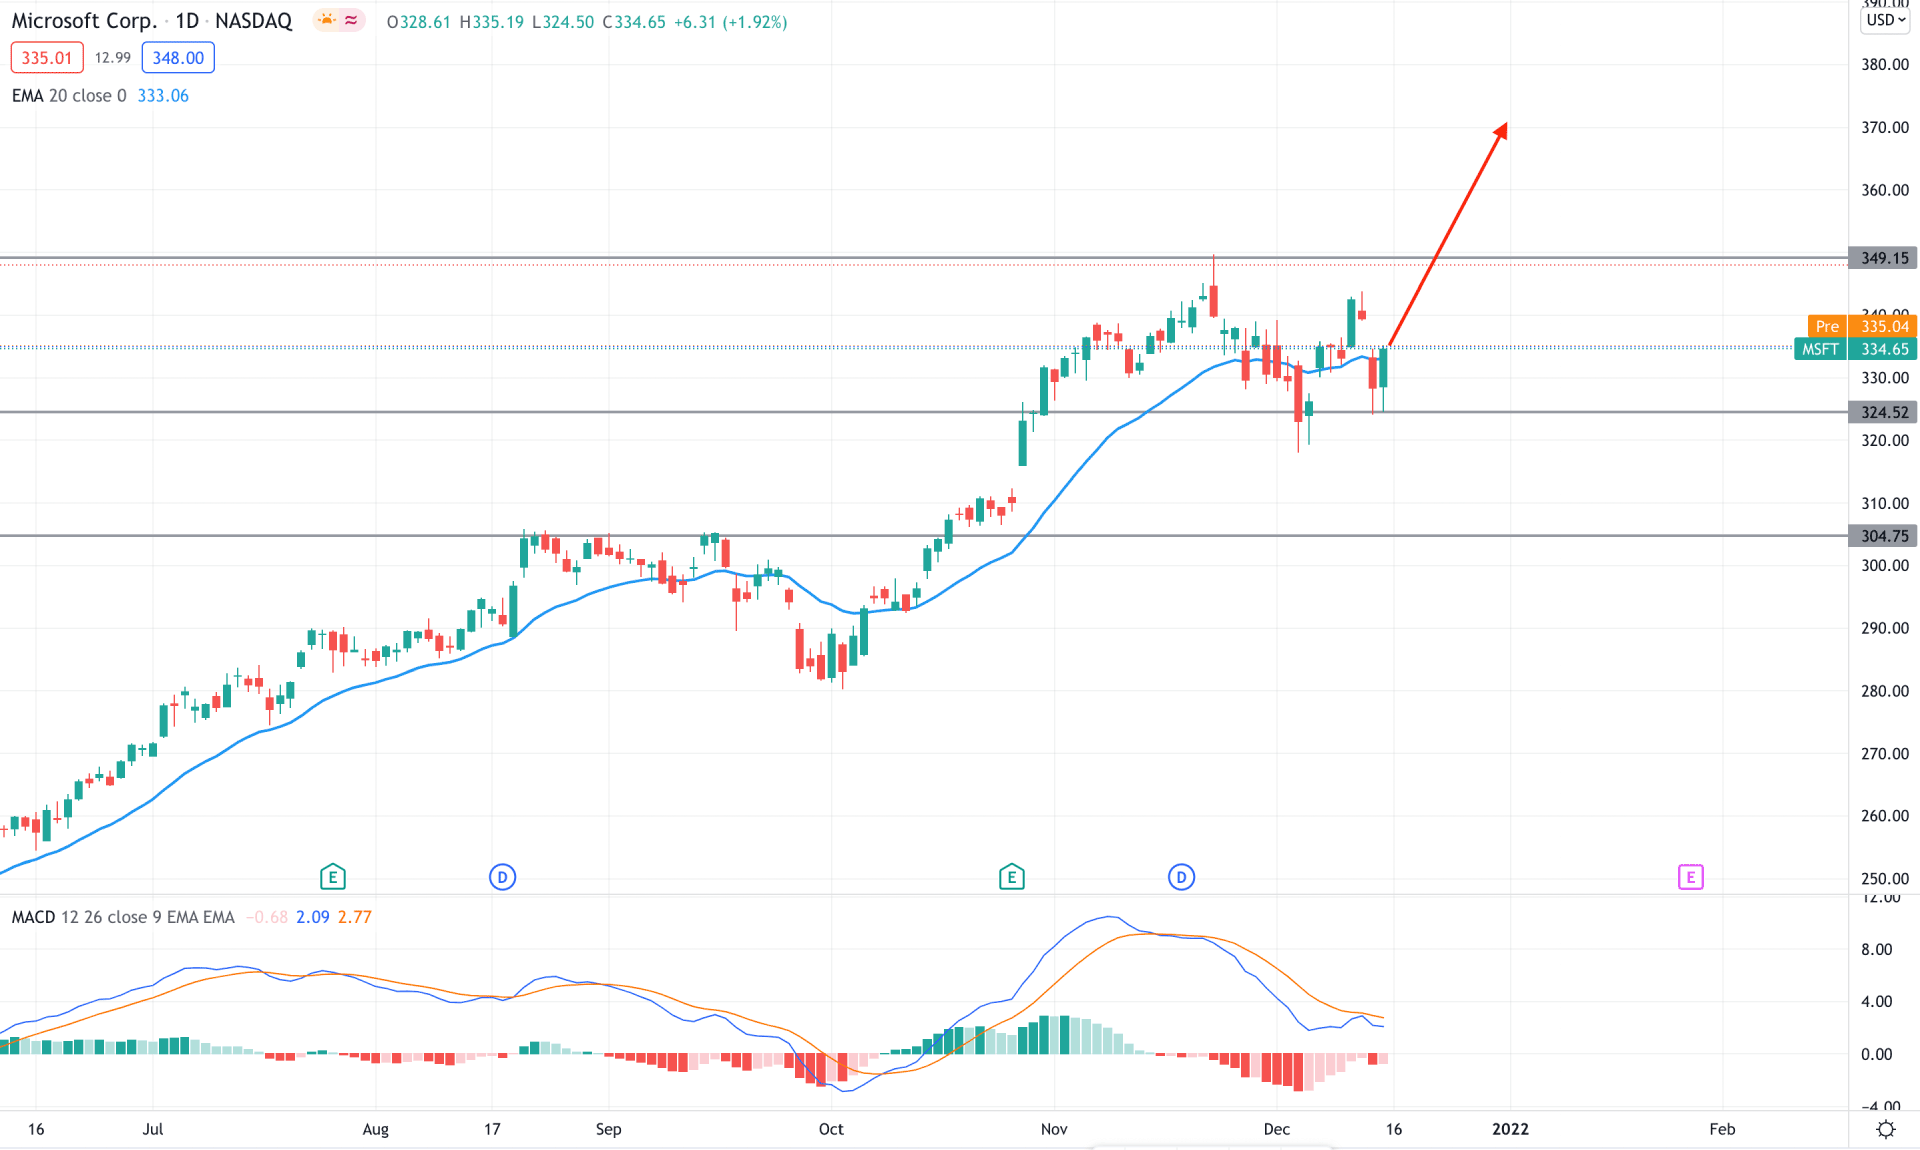
The broader market trend in MSFT is bullish, which was initiated from the COVID-19 market crash. Like other tech stocks, Microsoft moved lower but recovered immediately with a new all-time high in November 2021. As the broader market trend is bullish, any downside pressure would be a buying opportunity in this instrument from a discounted price.
The above image shows that the price moved above the dynamic 20 EMA and breached the 304.75 resistance level in mid-October. However, the price moved below the dynamic level in the most recent chart but failed to hold the momentum below the 324.52 static support level. Therefore, as long as bulls hold the price above the 324.52 support level, it is more likely to extend the bullish pressure in the coming days.
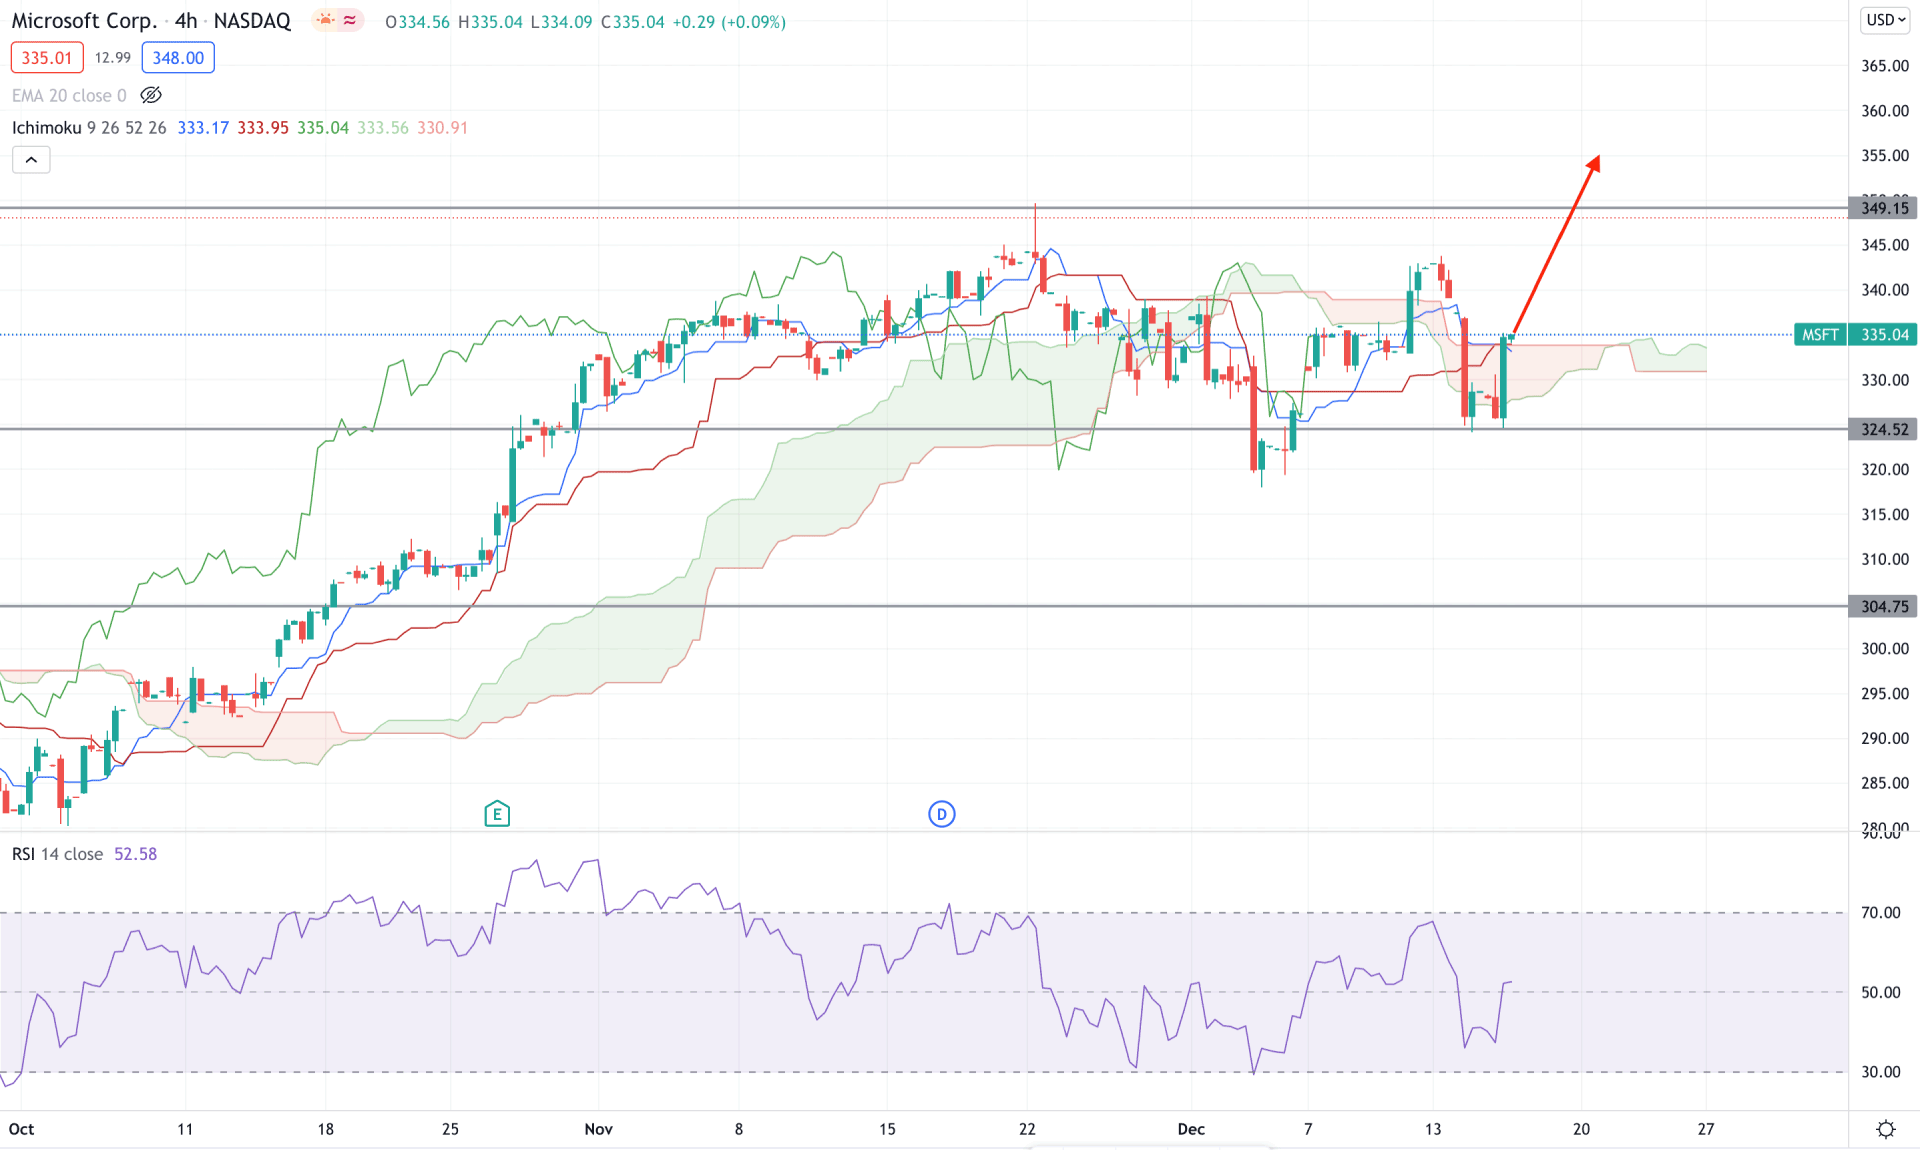
According to the Ichimoku Cloud analysis, Microsoft Stock (MSFT) is trading within a strong bullish trend where the price moved above the Kumo Cloud and traded for a considerable time. In the most recent chart, bears attempted to lower the price but failed to hold the momentum below the Kumo Cloud. In the future cloud, Senkou Span A is currently above Senkou Span B and aiming higher, which is a sign of a possible bullish pressure in the price.
The RSI failed to reach the oversold 30 level and rebounded above the 50 area in the above image. Therefore, the RSI may reach the 70 level in the coming hours by increasing the bullish momentum in the price.
Based on the H4 context, the bullish possibility is valid as long as the price trades above the 324.52 support level with a bullish H4 candle. In that case, the primary target would be 349.15 area. On the other hand, a break below the 324.52 level with a bearish H4 close would alter the current market structure.
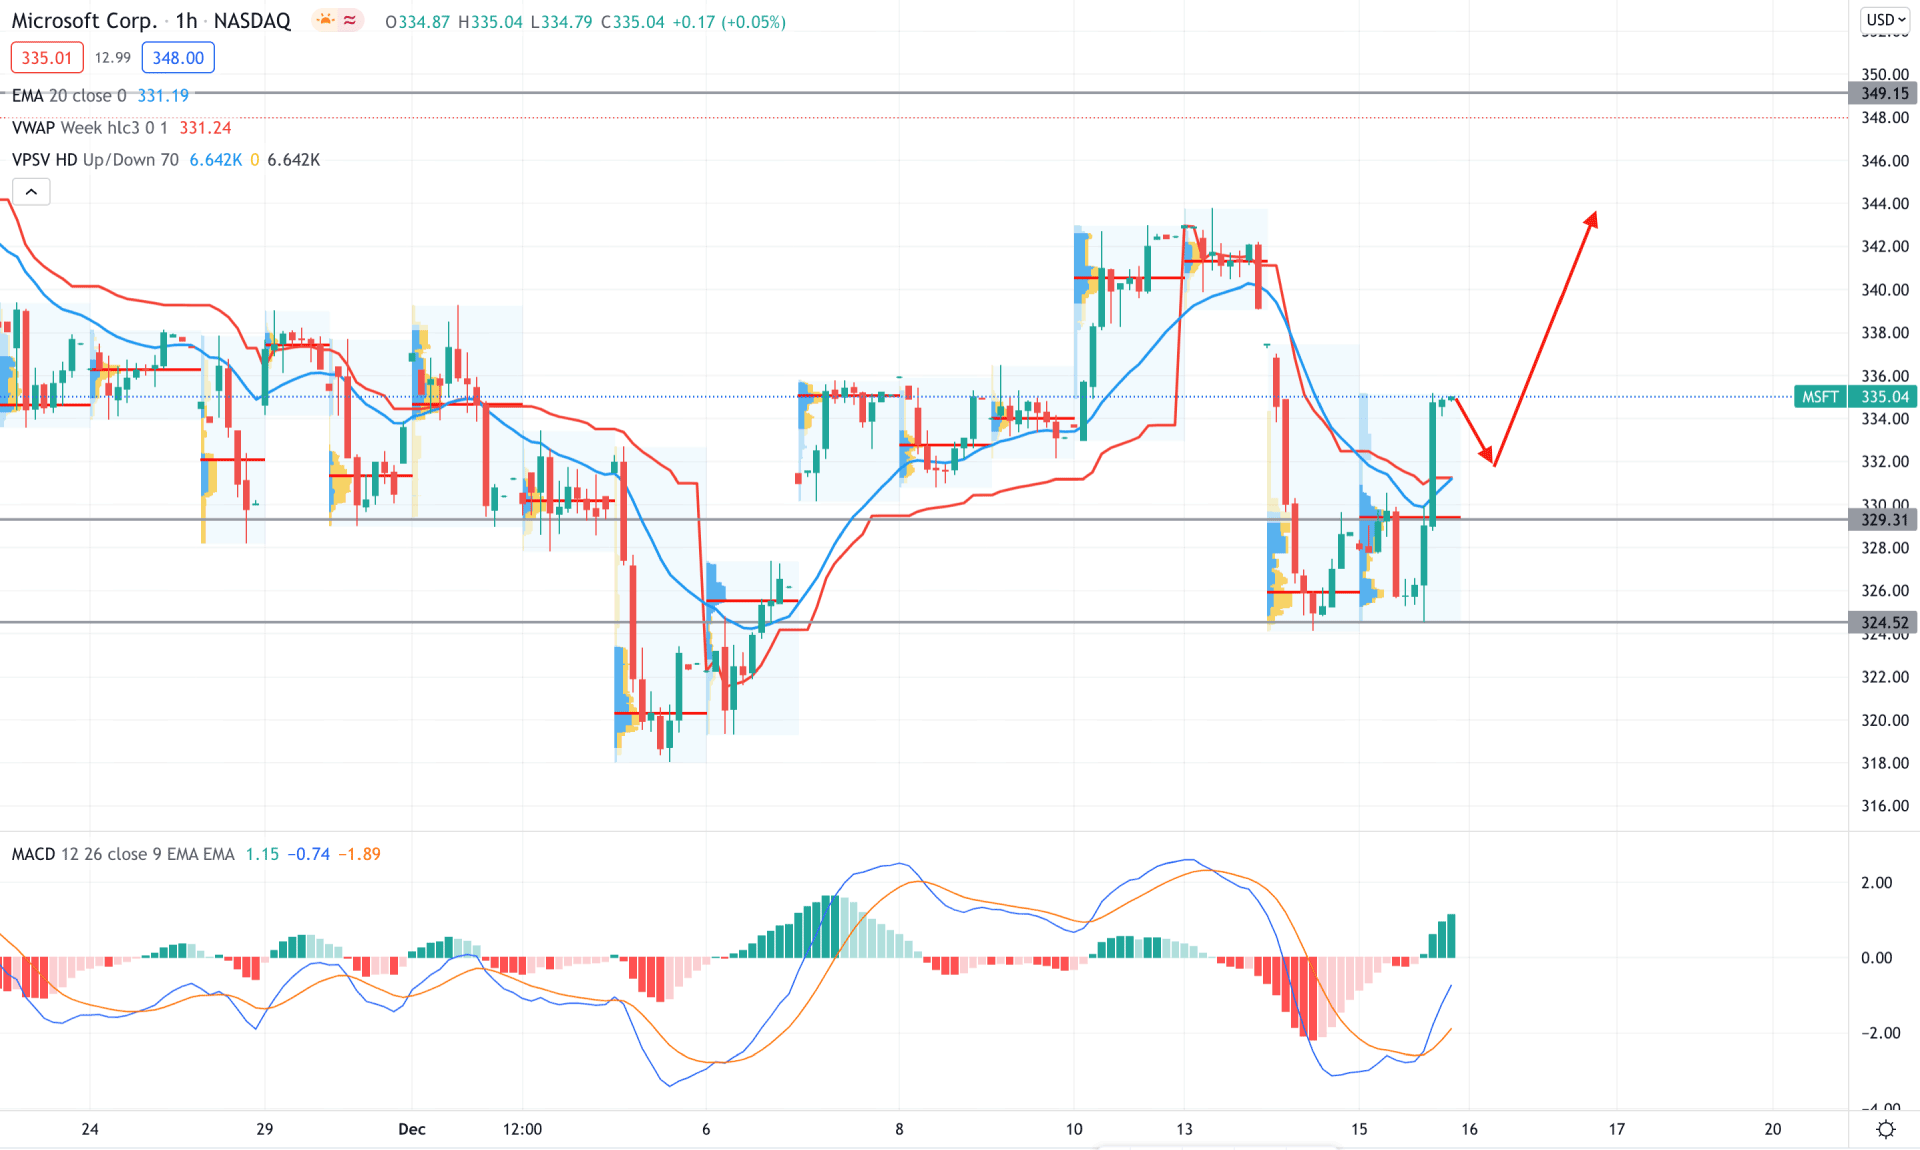
Is more likely to continueicrosoft Stock’s sentiment changed from bearish to bullish in the intraday chart as an H1 candle appears above the dynamic 20 EMA. Moreover, the bullish pressure came from a rejection from the 324.52 key support level.
The above image shows how the price trades above the dynamic 20 EMA and weekly VWAP. Moreover, the most recent high volume level is below the price, while the MACD Histogram is bullish. Therefore, based on the intraday price behavior, MSFT is more likely to move up in the coming hours. A strong bullish rejection from the key support with an H1 close above dynamic levels are signs of a possible buying pressure in the price. On the other hand, a break below 324.52 may alter the current market structure and initiate a bearish trend.
As of the current observation, MSFT has a higher possibility of continuing the current bullish trend. In that case, any bullish rejection from 350.00 to 325.00 would be a possible buying point. However, a break below the 320.00 level would alter the current market structure and begin a bearish trend.


