Published: July 20th, 2022
Microsoft and major tech companies are not expected to be hurt by the economic downturn. According to an analyst from Citi, the bullish possibility in the Microsoft Stock is still solid, although the target is roughly down by 9% to $330. The buying opportunity in this stock comes from the lucrative combination of compelling relative valuation, stable business model, and amazing revenue growth than other S&P 500 companies.
Recently, Microsoft updated the guidance for the June quarter, saying that the market pressure is coming from foreign exchange rates that might reduce the revenue by $460 million and EPS by $0.03.
Now that the July earnings report is approaching, investors are keen to see how results would come to tamper with their expectations for results. As of now, the growth in the cloud business and substantial revenue could help the stock price to move, but a clearer view might come from the official earnings release.
Can Microsoft stock breach the $300 barrier? Let’s see the future price direction of the Microsoft stock from the MSFT technical analysis.

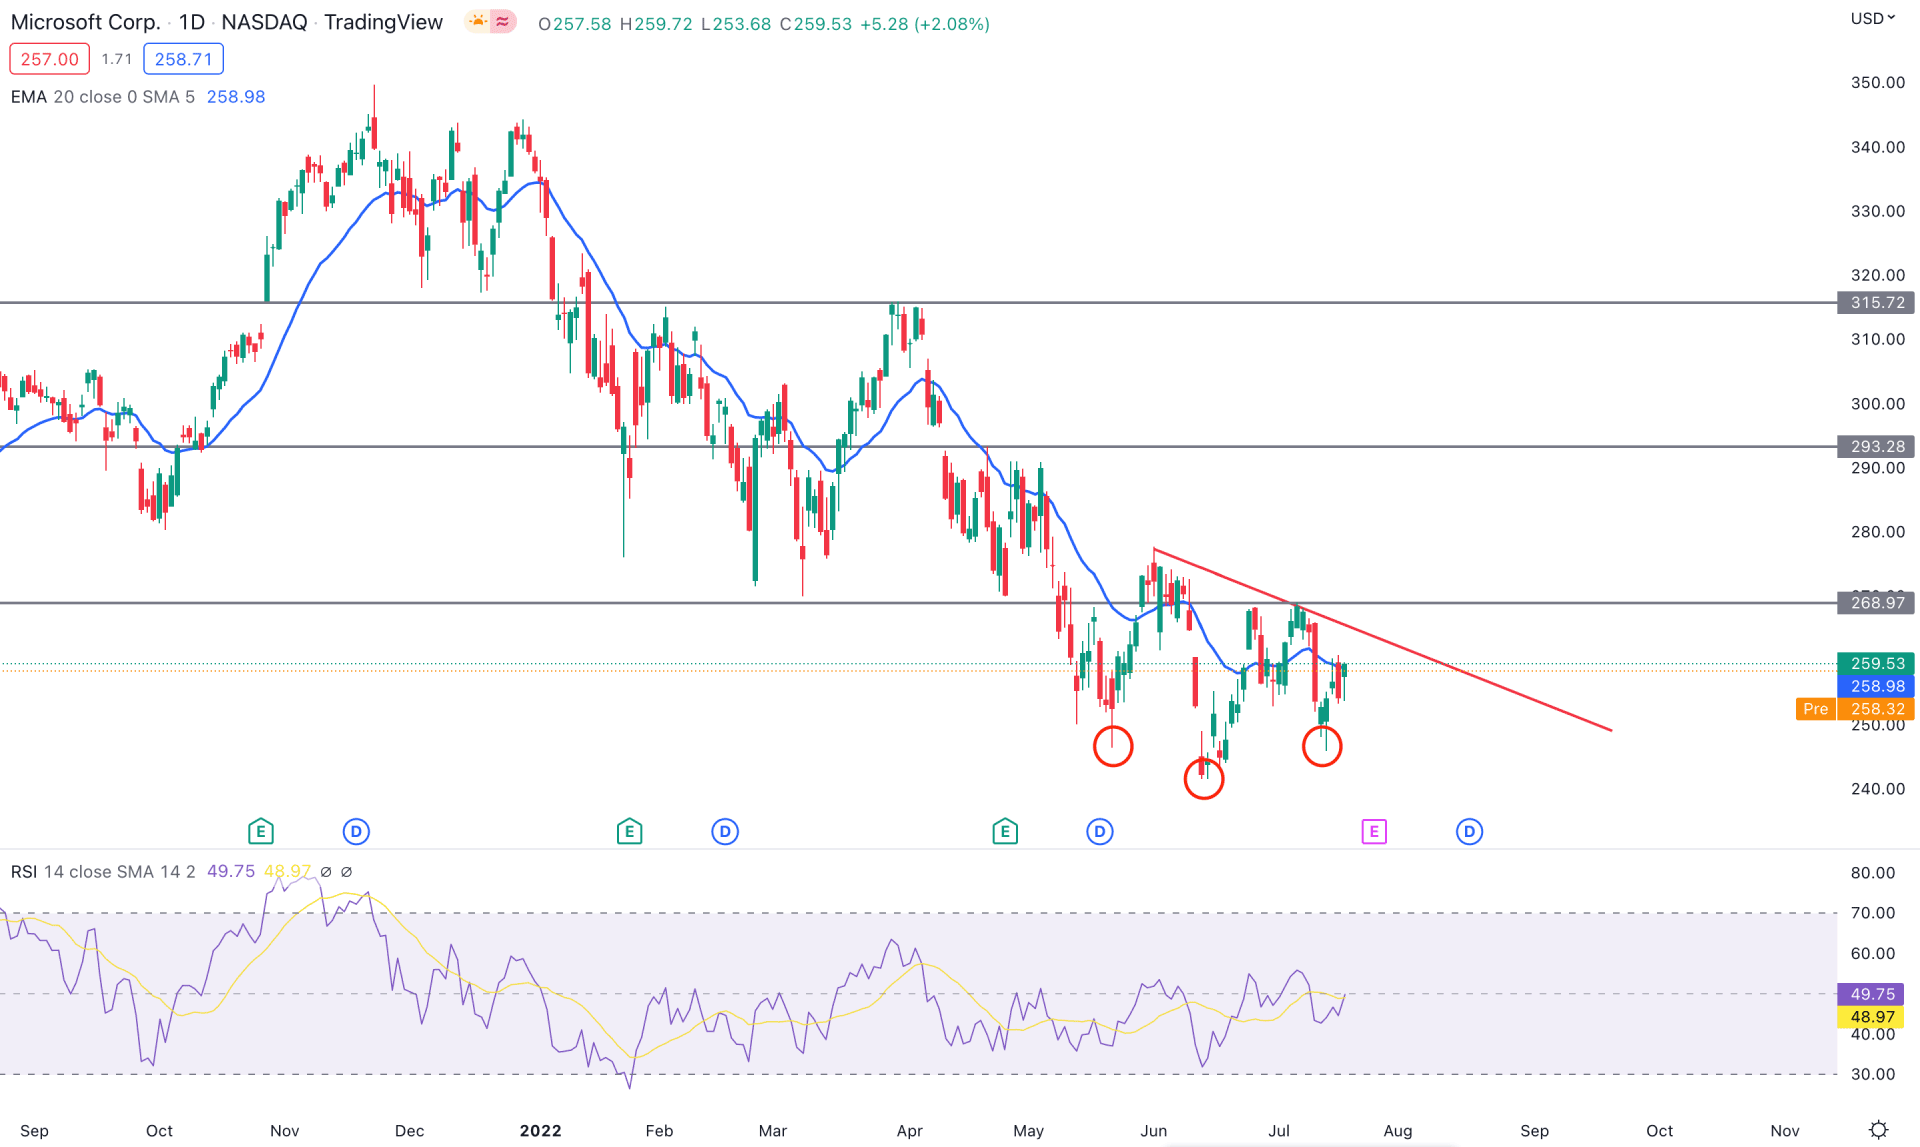
In the price chart, MSFT moved above the 20-day moving average, while the current price is below the 52-week range. On the other hand, the selling pressure from April 2022 high became weaker after making the June low, which is a sign of fewer bears’ presence in the price.
The correction of bearish price action in the last three months with an inverse head and shoulder formation is the primary sign of a trend reversal in the Microsoft Stock (MSFT). However, the price is still below the trendline resistance, where a bullish breakout is needed to consider the head and shoulder formation valid.
The indicator window shows the Relative Strength Index (RSI), where the current level hovers at the neutral 50.00 level. In the earlier price action, the RSI level rebounded from the oversold 30 level, where the current projection is to test the 70 level after recovering above the 50.00 area.
Based on the daily price action, investors should wait for the price to move above the 268.97 static resistance level to go long towards the 300.00 psychological level. On the other hand, if bulls fail to overcome the 268.97 barriers and form a strong bearish daily candle below the dynamic 20 EMA, the price may visit the 240.00 level in the coming days.

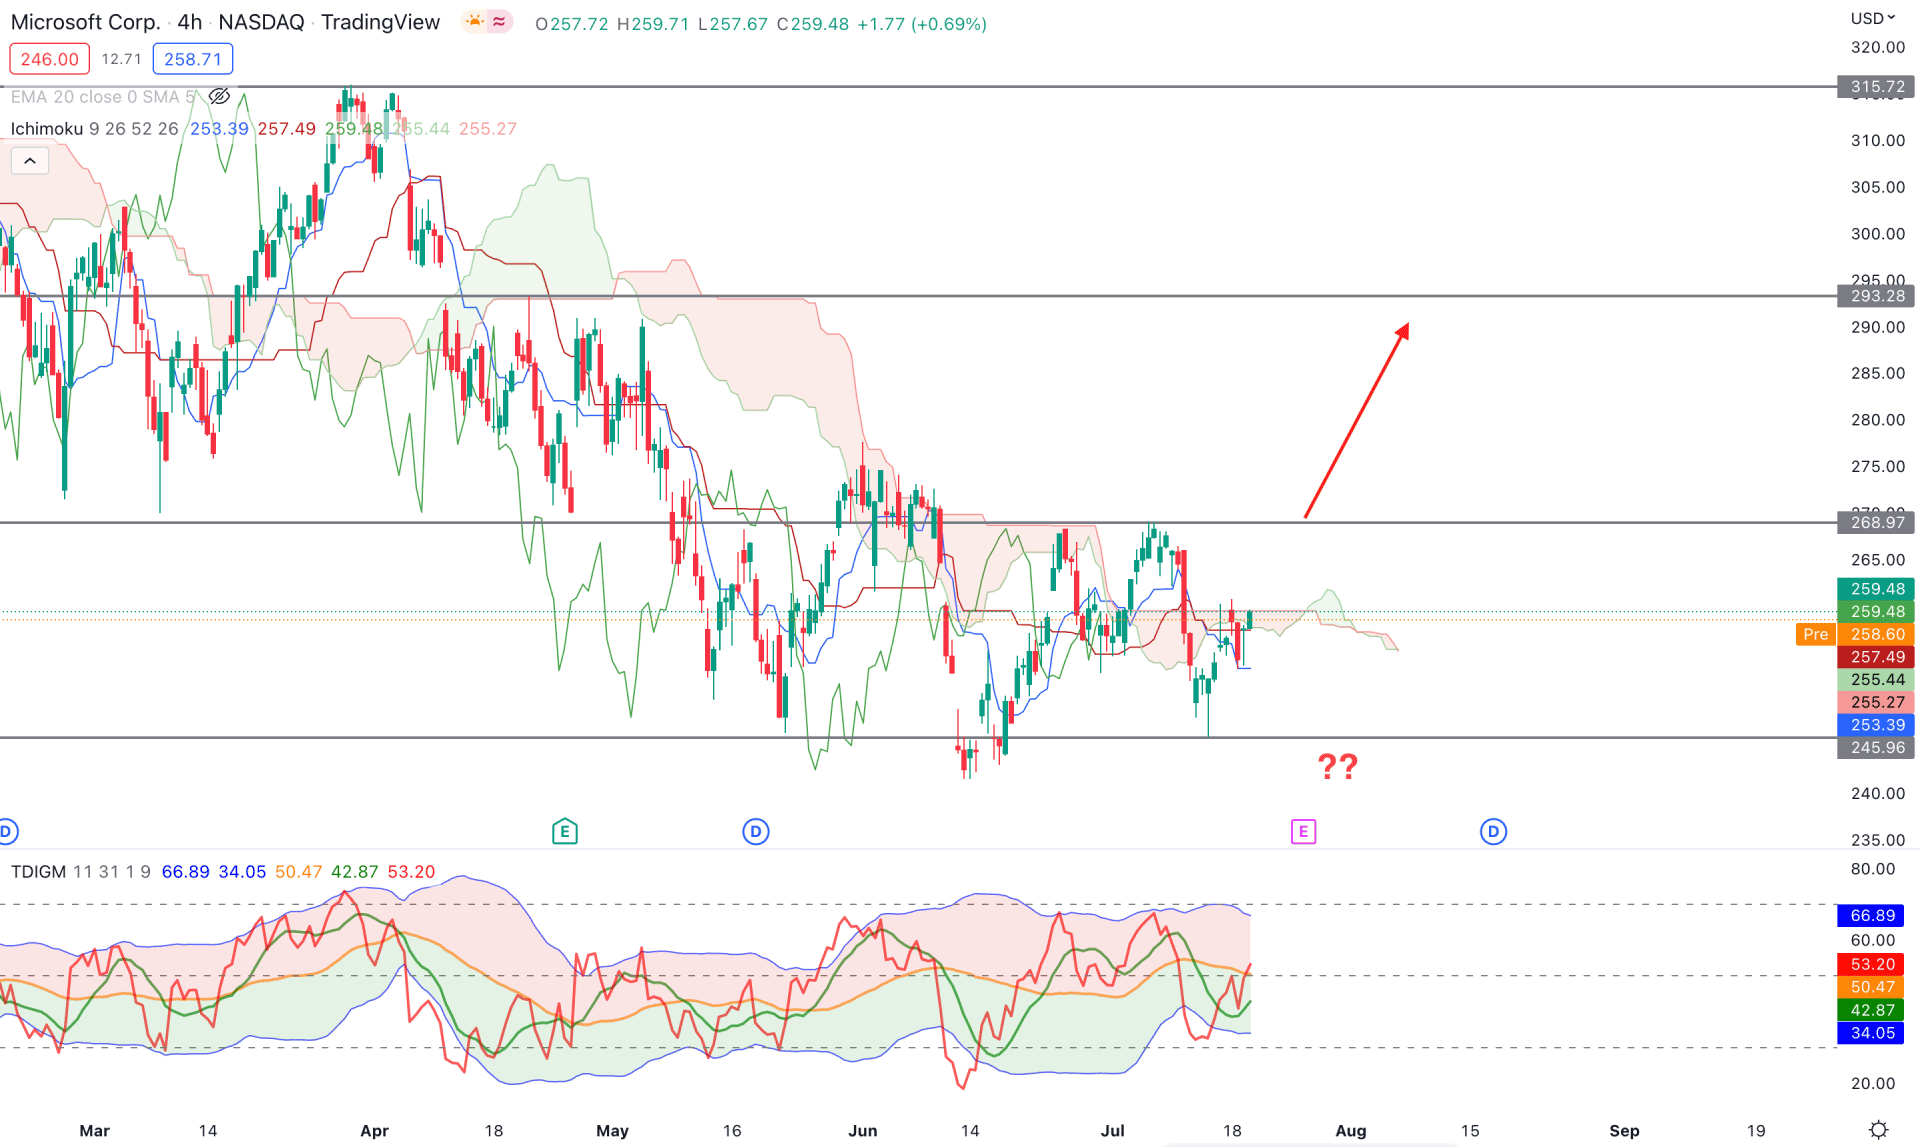
The H4 price action of Microsoft Stock (MSFT) supports the daily chart as the current price hovers at the Ichimoku Cloud zone. In that case, further bullish pressure with an H4 candle above the Cloud resistance would work as confluence support to bulls on the daily chart.
As shown by the Future cloud, the selling pressure from April 2022 has become weaker. The gap between Senkou Span A and B became weaker, indicating a trend change. Moreover, the Lagging Span is within the price where a bullish breakout would take it above the cloud resistance.
The above image shows the trader's dynamic index, a unique tool to measure bulls/bears' strength in the market. As per the current reading, the TDI line is at the 50% mid-level, which came from visiting the lower band. It is a sign that buyers' orders are in action, which may extend until the TDI level reaches 70%.
Based on the H4 chart, the upcoming price direction for MSFT would be bullish if the price moves above the Cloud resistance with a bullish H4 close. In that case, the main aim is to test the 300.00 psychological level. On the other hand, the dynamic Kijun Sen would be a substantial barrier for bulls where a break below the Kijun Sen level with a bearish H4 candle could alter the current market structure.

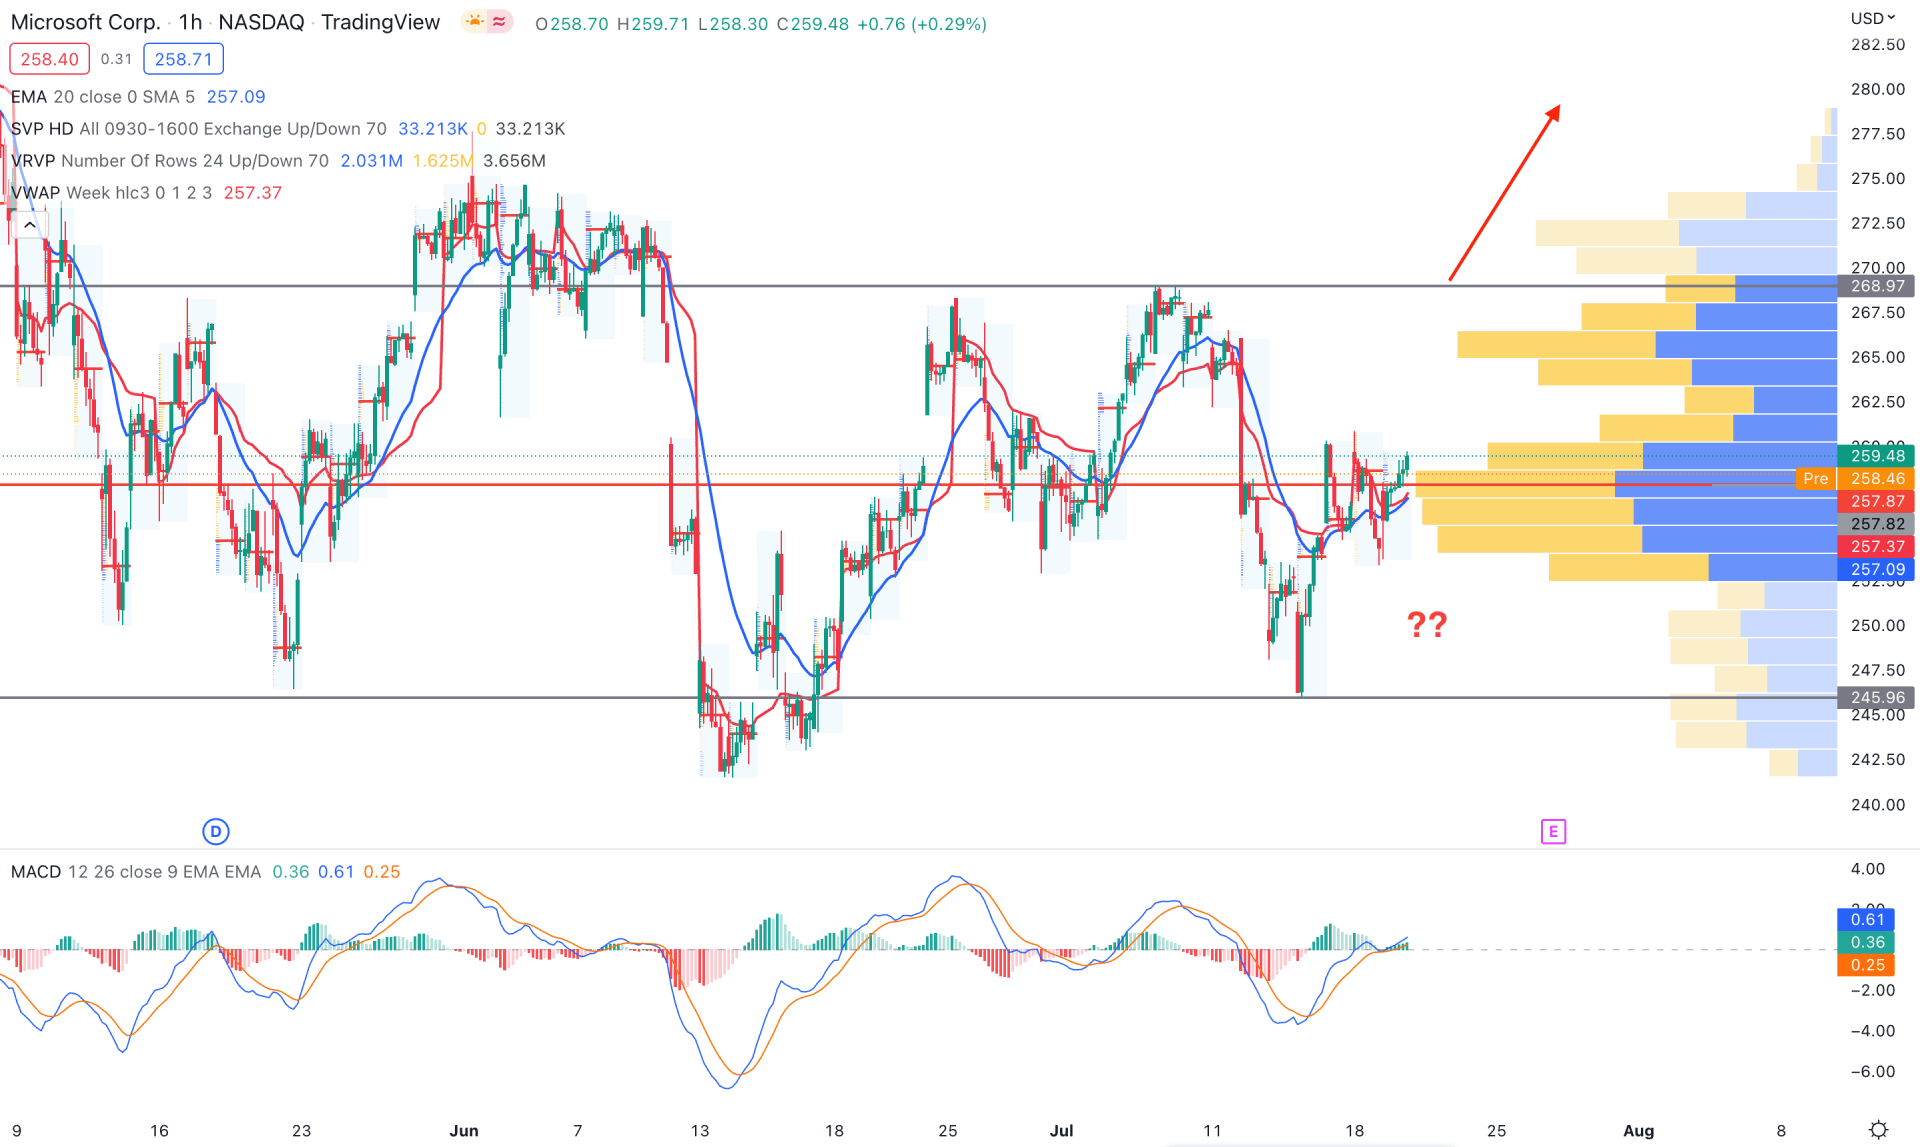
In the H1 timeframe, MSFT is trading at the 50% level of the zone, starting from 268.97 high to 245.96 low. Moreover, the strongest trading volume from the visible range is 257.82, which is just below the current price. Therefore, a clear price direction may come after the range breakout, where bulls are more likely to win.
The indicator window shows how the lower MA level in MACD is moving up from the higher MA level, indicating a bullish trend continuation. Moreover, the dynamic 20 EMA and weekly VWAP are below the price and working as minor supports.
Based on the H1 MSFT technical analysis, the buying pressure towards the zone high of 268.97 level is valid as long as it trades above the weekly VWAP. Moreover, the breakout above the 269.00 level could extend the buying pressure towards the 300.00 zone. Conversely, the bearish pressure below the high volume level of 257.82 with an H1 close below 245.96 level could eliminate the bullish possibility and lower the price towards the 220.00 level.
Based on the current multi-timeframe analysis, the MSFT bullish opportunity awaits how the price overcomes the inverse head and shoulder neckline breakout. A strong bullish daily candle above the 268.97 level could provide a conservative bullish opportunity toward the target of the $300.00 level.