![Microsoft Stock [MFST] – Can Bulls See a New All-Time High?](https://d3kvcd8uuqwmxt.cloudfront.net/filecache/articles_img/tech-analysis-main-page.jpg_803_6166d70f3901b9.26021501.jpeg)
Published: October 13th, 2021
Microsoft is going through a lot of development that might positively affect the stock price. The first price increase for Microsoft 365 and office 365 is the primary indicator for MFST bull. Besides, Microsoft revealed Windows 365 that runs through the cloud. So it would create a hybrid personal computer in the cloud PC.
On June 24, Microsoft brought Windows 11 into their personal computing system with a new user interface and Start Menu. Moreover, Microsoft improved the new videoconferencing app that is more efficient than before. The official Windows 11 is available now for users, and its effect is already shown in the stock price.
Based on the most recent news, Microsoft decided to buy Nuance Communication for $19.2 billion this year as a part of their business expansion in the health care sector. In addition, the 120,000 Microsoft HoloLens order from the US army is another indicator that may push the Microsoft stock [MFST] up. The deal is expected to be worth up to $21.88 billion, and MFST climbed 1.7% during the news release. Overall, the mass development in business may attract investors to consider the Microsoft Stock [MFST] the best investment opportunity.
Let’s see the upcoming price direction from the Microsoft Stock [MFST] technical analysis:
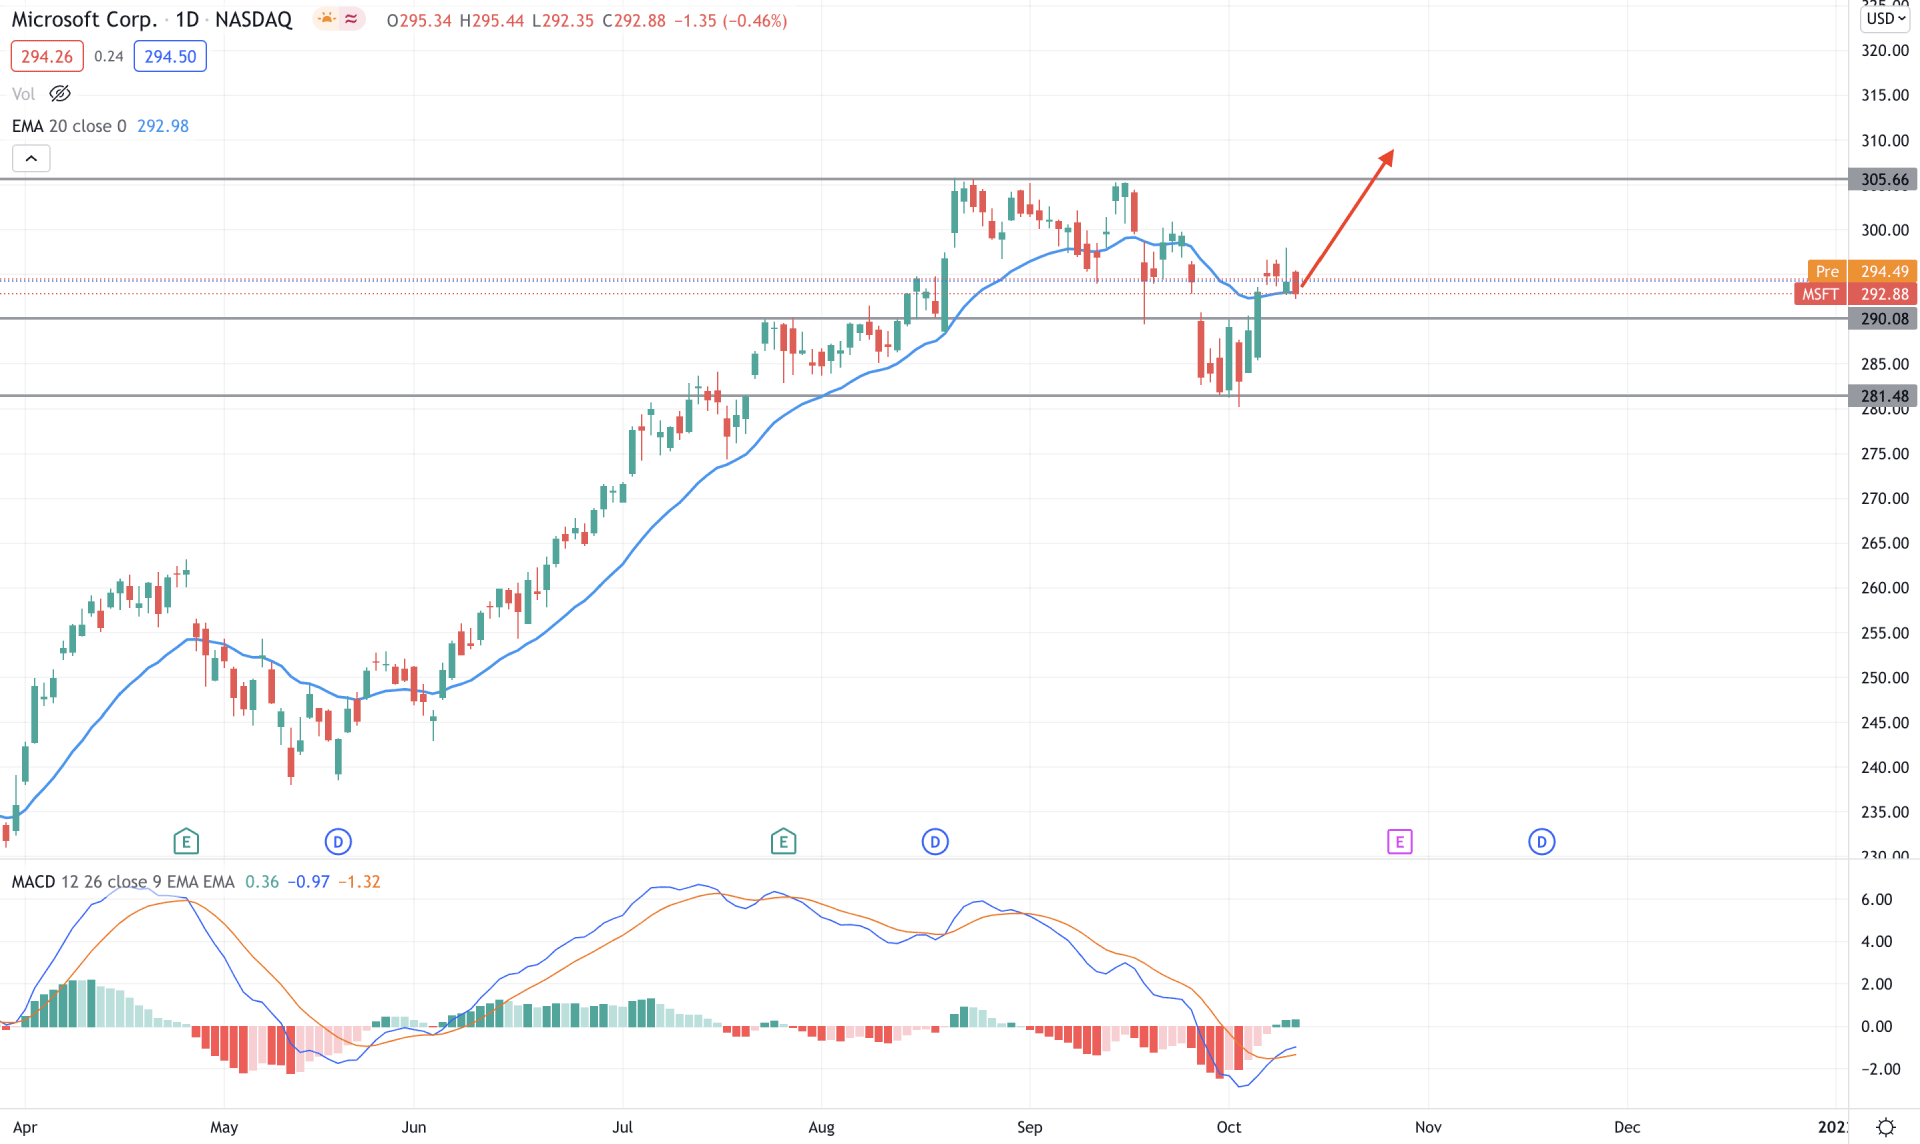
Microsoft Stock [MFST] showed an impressive bullish pressure during the pandemic that came from the massive adoption of Microsoft products due to lockdown. Even after the pandemic, the awareness among the people regarding technology kept Microsoft stock stable, influencing the price to test the all-time high level. However, the price faced some bearish correction in mid of 2021 but resumed the bullish momentum towards the new all-time high at 305.40 level.
The above image shows how the price moved below the dynamic 20 EMA and found a bottom at the 281.41 level. Meanwhile, the MACD Histogram turned bullish with a new high. In that case, as long as the price is trading above the 281.41 level with a daily close, we may expect the price to show a bullish pressure above the 305.40 level. On the other hand, any daily close below the 281.41 level may alter the current momentum and lower the price towards the 260.00 level.
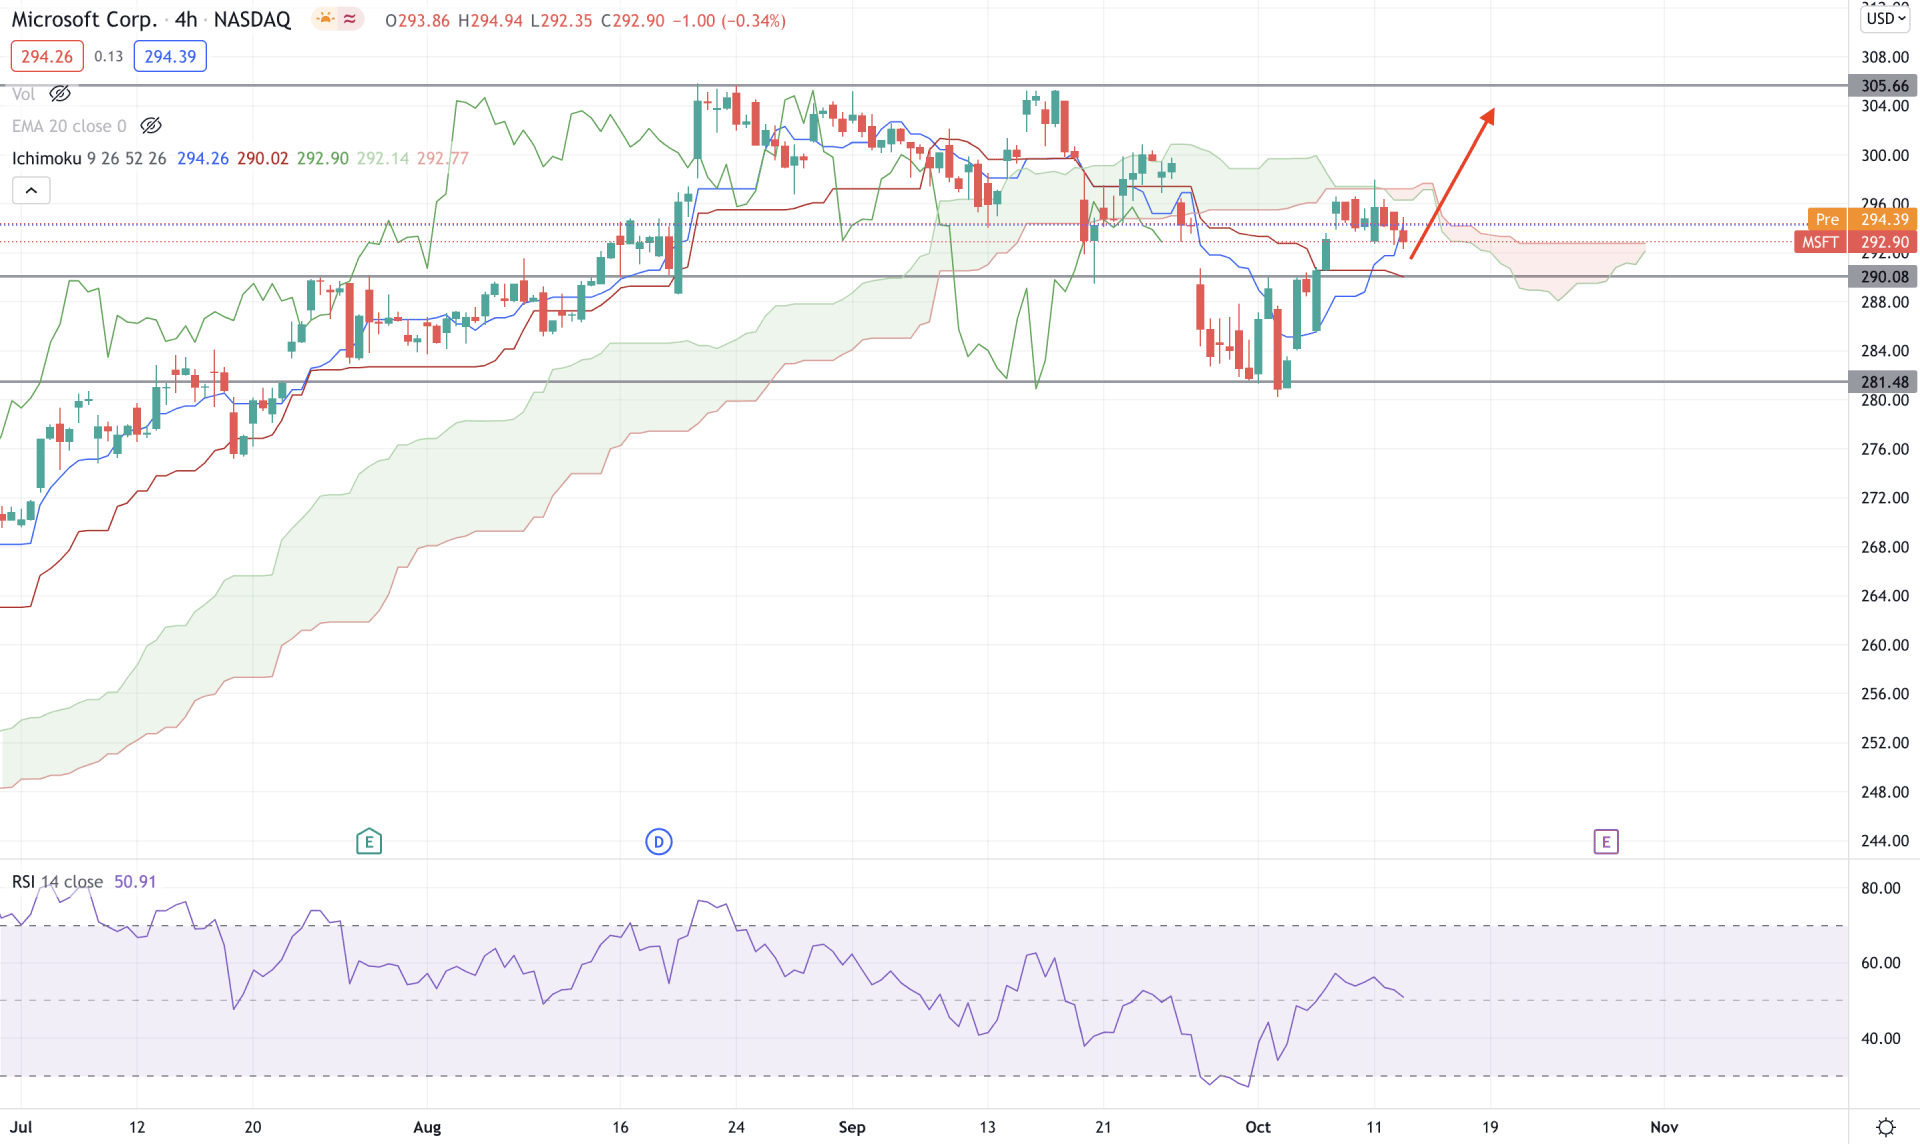
According to the Ichimoku Kinko Hyo, the H4 context is bearish as the price is still below the Kumo Cloud. Likewise, the bearish pressure is getting weakened as the Senkou Span B is moving higher in the Future cloud with a bullish crossover in the TenaknSen and Kijun Sen.
The above image shows how the RSI is rejected from the oversold 30 levels and moved above the 50 areas. Therefore, based on the H4 context, the bearish pressure has less possibility to work as the price moves above the 290.00 static level. On the other hand, a sharp bearish H4 candle below the 281.41 level may alter the current market structure and take the price lower towards the 260.00 area.
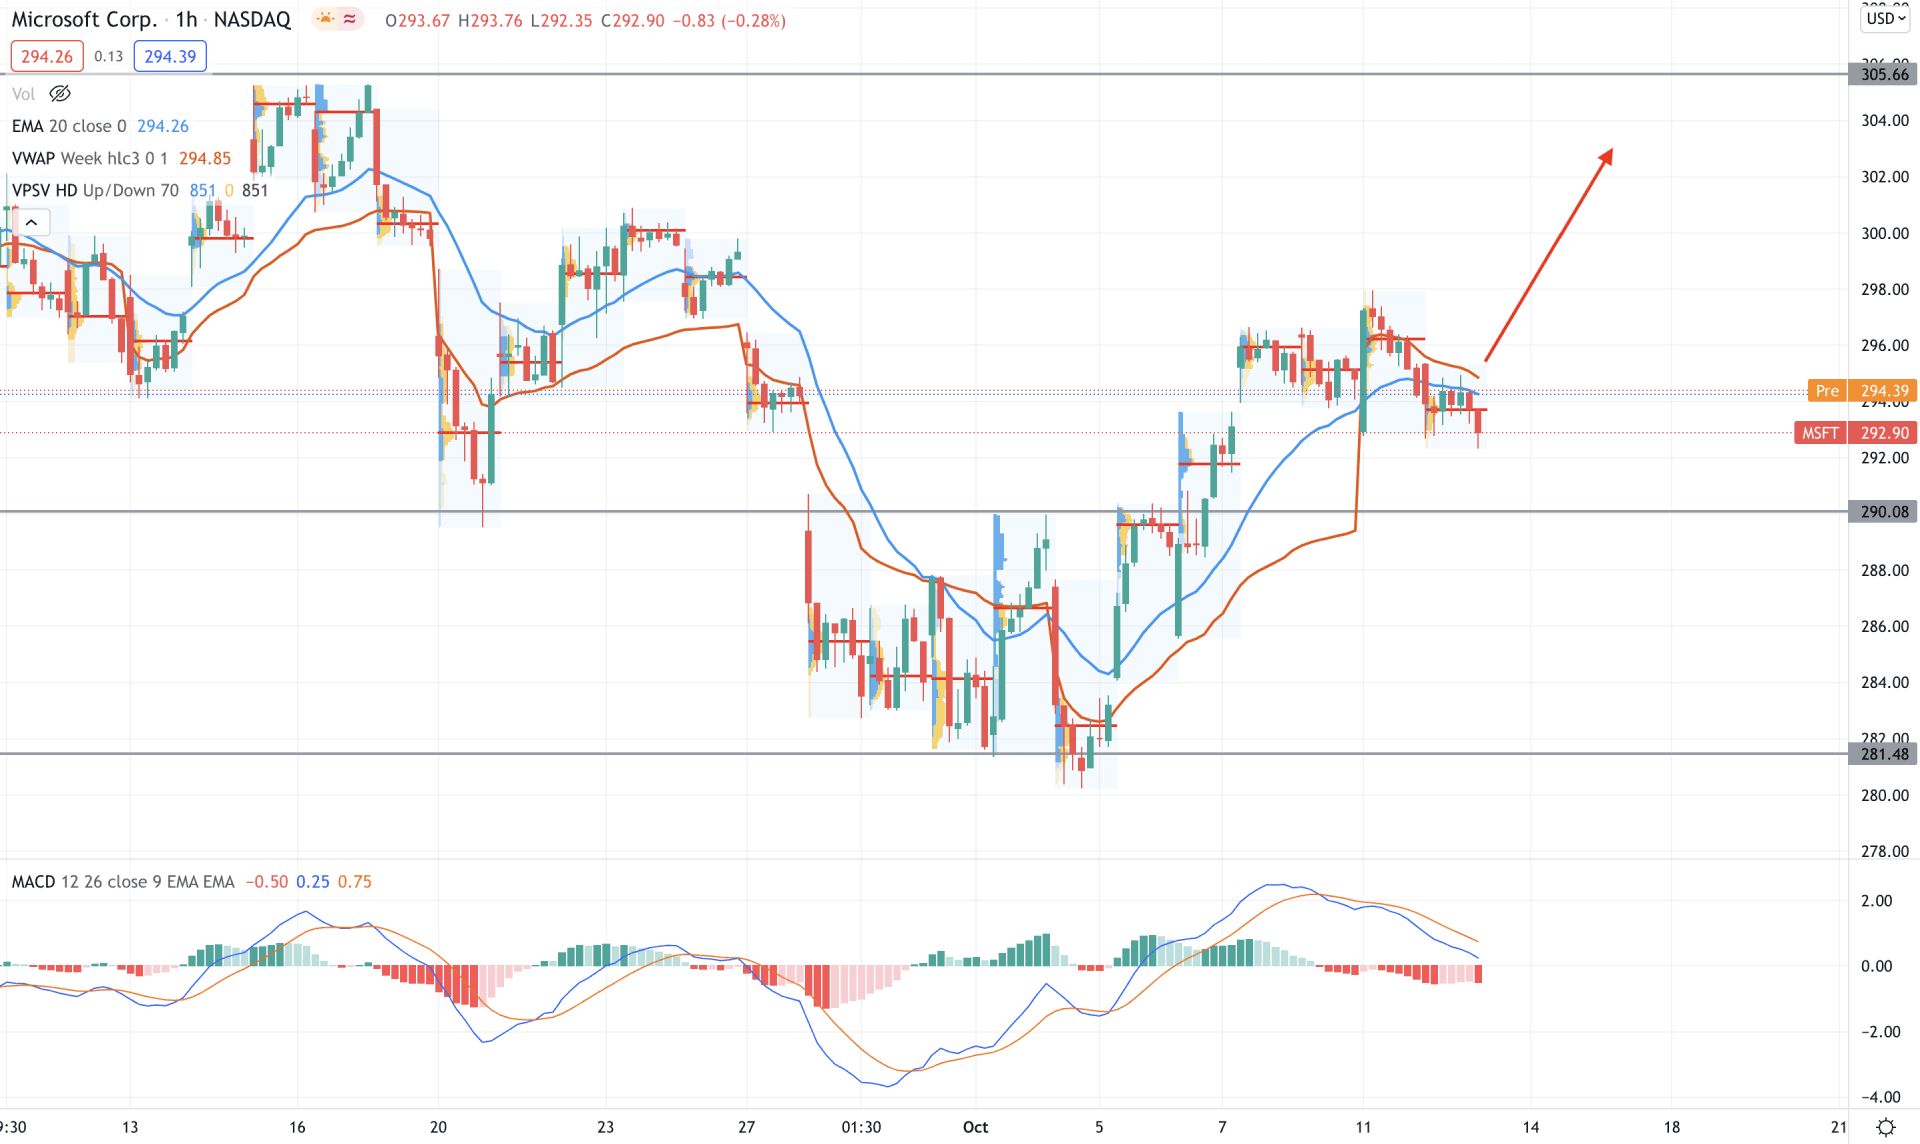
In the intraday chart, Microsoft Stock [MFST] shifted its direction to bears territory as the price moved below the dynamic vwap and intraday high volume level of 293.00. Therefore, any bullish H1 close above the dynamic 20 EMA may take the price up in the coming hours.
The above image shows how the price closed above the 290.00 level with a bullish H1 candle. Moreover, the daily close was supportive to bulls as the price remained above the most recent high volume level 290.00. Moreover, in the indicator window, the MACD histogram is bearish, which is an indication of the correction.
Therefore, based on the H1 context, the price is more likely to move up above the 300 level if an H1 candle appears above the dynamic 20 EMA. However, the price may show a small corrective momentum towards the 290.00 level before showing the upside pressure. A break below the 281.41 level would invalidate the current sentiment and initiate a bearish trend.
As of the above discussion, we can say that the Microsoft stock is more likely to show bullish pressure. The massive development and business expansion may influence investors to see a new all-time high above the 305.00 level in the coming days. However, a bearish H4 close below the 281.41 level may alter the current market structure and initiate a broader correction to the trend.


