
Published: March 17th, 2026
Prior to its earnings, Micron Technology, a crucial artificial intelligence stock that investors are keeping an eye on, as consumer interest in memory chips has risen dramatically in recent days. According to some retail traders, a large portion of the potential upside might already be priced in.
Following Wednesday's market closure, the company is scheduled to release its quarterly results. According to Wall Street analysts, adjusted earnings are expected to increase 455% to $8.66 per share, and sales to increase 138% to $19.18 billion.
In the meantime, the business announced on Monday that it started shipping its HBM4 36GB 12H storage in bulk in the initial quarter of 2026. This memory is intended for Nvidia's next Vera Rubin CPUs.
After falling the week before due to a widespread market selloff brought on by U.S. strikes on Iran, which have now escalated into rising geopolitical tensions, memory chip stocks recovered.
The need for enormous quantities of DRAM and high-bandwidth storage is being driven by a massive growth of data centers and artificial intelligence servers, which is tightening supply and driving up memory costs following a protracted downturn.
Let's see the further aspect of this stock from the MU price analysis:
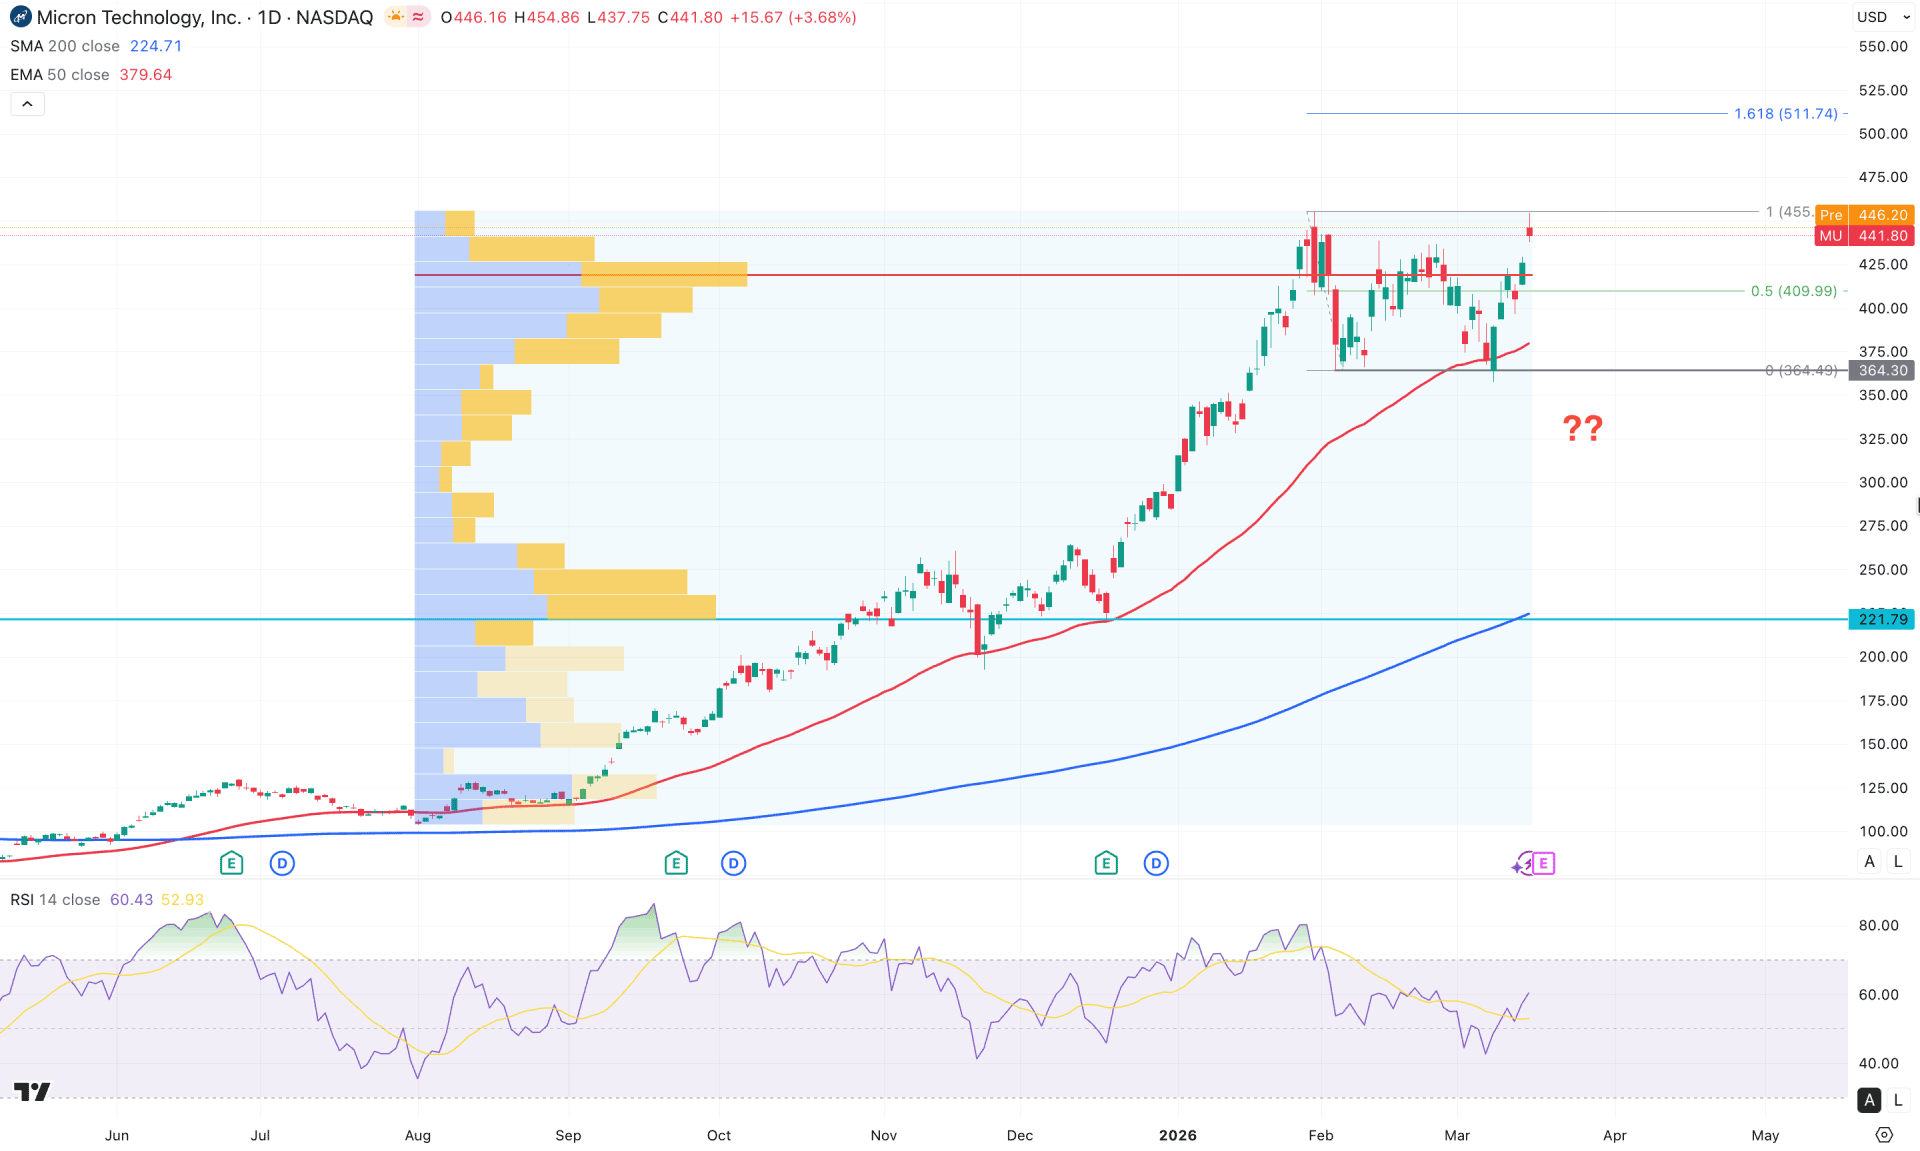
In the daily chart of MU, the current market momentum is bullish, as the price is trading at a record high level with no signs of selling pressure. The price is currently consolidating within a rectangular pattern, from which a breakout could initiate a continuation of the trend.
On the higher timeframe, the monthly candle suggests a strong bullish trend, as the latest candle is forming an inside bar breakout. With sufficient liquidity swept from the February 2026 low, we may consider buying pressure to expand further. The weekly timeframe shows a similar outlook, as the most recent weekly candle closed as a bullish engulfing pattern after capturing sufficient sell-side liquidity.
In terms of volume, the largest activity level since August 2025 is positioned below the current price and within the rectangular pattern. This indicates a bullish re-accumulation phase, from which the price may resume its upward movement following a valid range breakout.
On the main price chart, the 200-day SMA is positioned below the current price and is acting as a major support level. Additionally, a bullish recovery structure is evident, with the 50-day EMA acting as immediate support.
From an indicator perspective, the Relative Strength Index (RSI) has sufficient momentum to move higher, as the current reading is hovering around the 60.00 level. Furthermore, the Average Directional Index (ADX) has started to rise from the 20.00 threshold after a two-month bearish phase, indicating strengthening trend momentum.
Based on the daily market outlook of MU, the current momentum remains bullish, and investors should closely monitor how the price reacts at the 455.50 resistance level. A potential bullish breakout above this level could confirm the rectangle pattern breakout and may extend the existing trend toward the 602.75 Fibonacci Extension level.
On the other hand, the price is already trading near a crucial resistance zone, where a rejection could occur. A failure to hold above the near-term resistance level, followed by a bearish daily close, could create a short-term selling opportunity. However, a confirmed break below the 364.30 key support level, accompanied by consolidation, could open further downside potential, targeting the 221.79 support level.
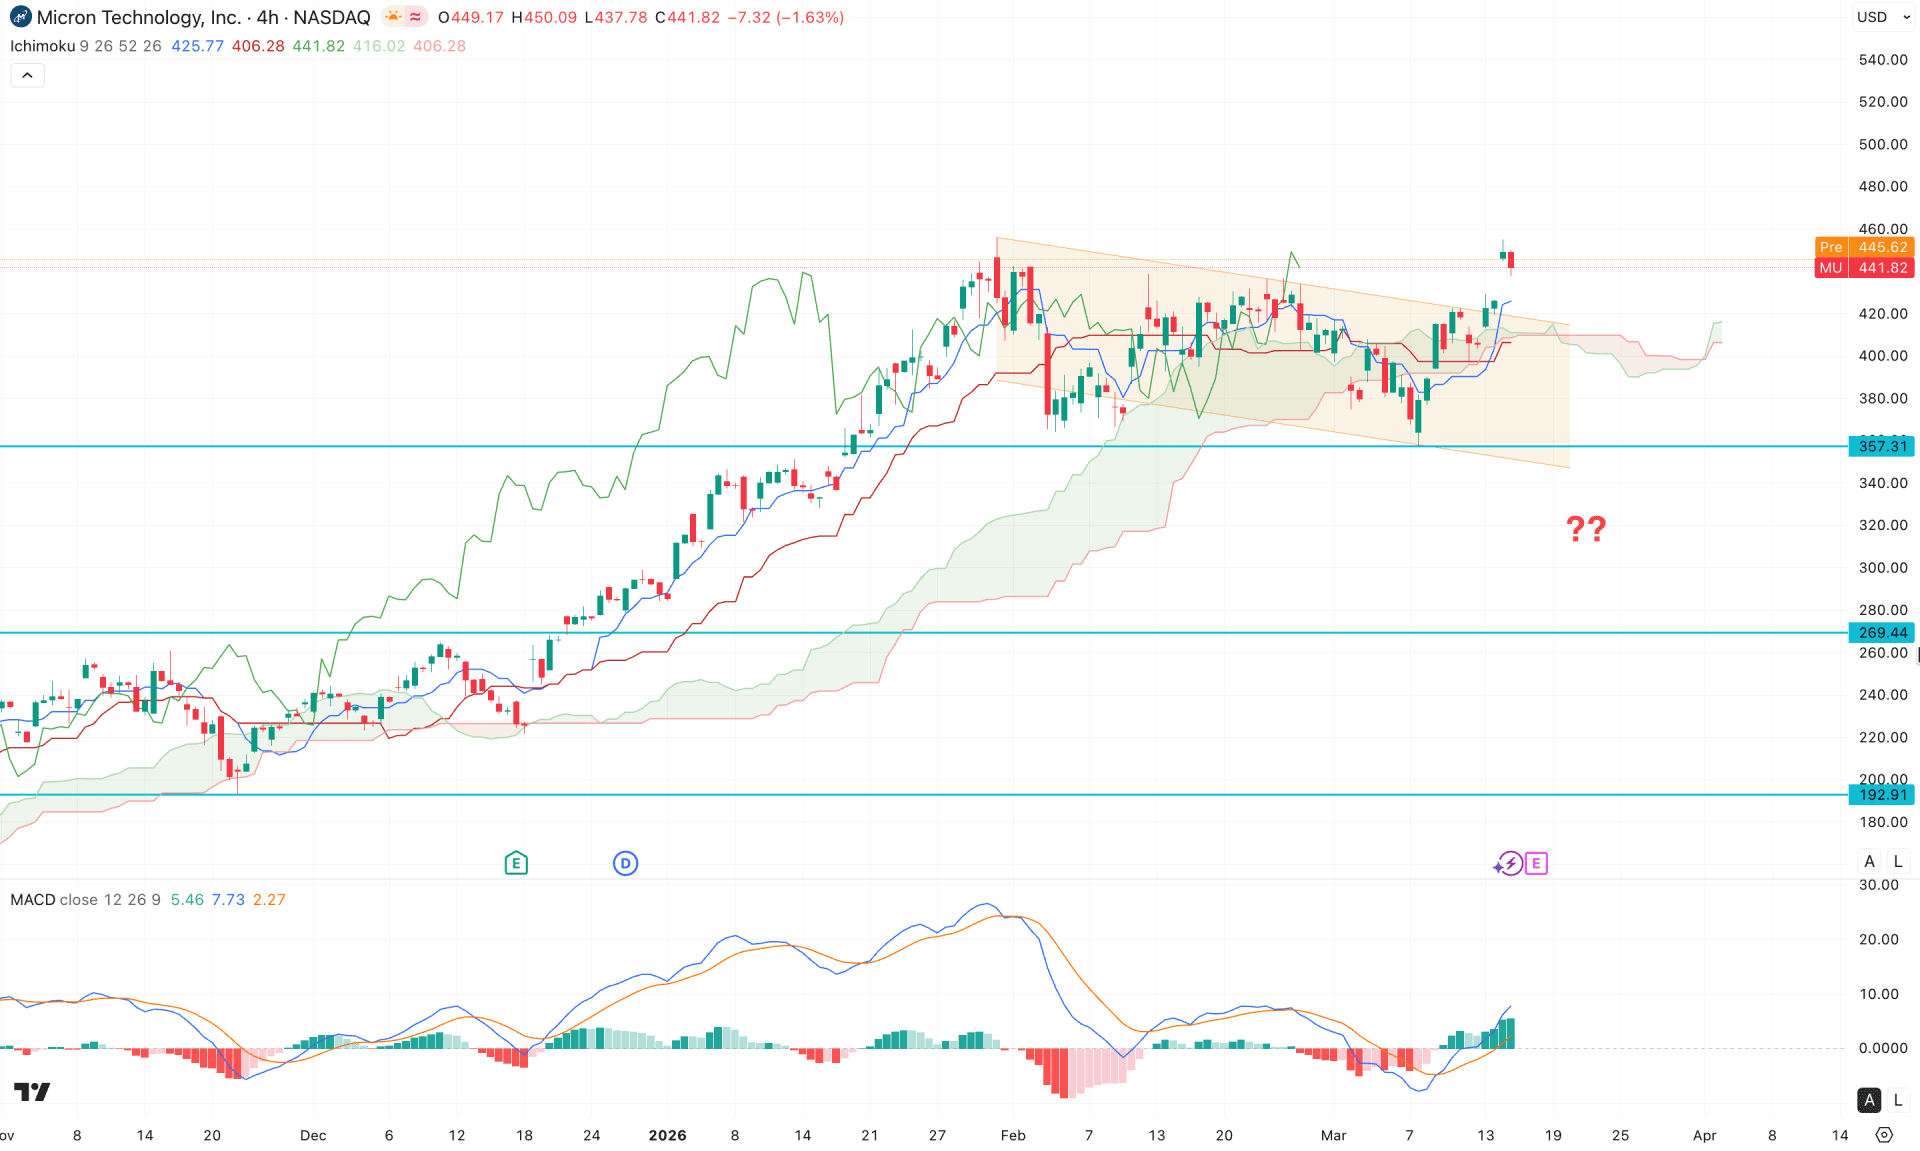
In the four-hour timeframe, the price is currently trading sideways above the Ichimoku Cloud, signaling a potential bullish continuation opportunity. The future cloud has flipped bullish, indicating medium-term buyer participation in the market, which could further strengthen buying pressure.
Multiple four-hour candles are holding above the dynamic Kijun-sen level, signaling confluence buying support.
The indicator window reflects a similar outlook, with a bullish rebound from the signal line and multiple positive histogram bars.
Based on this market outlook, a minor downside correction is possible; however, bullish opportunities remain valid as long as the price holds above the 357.31 support level. On the bullish side, the immediate resistance is at 500.00, which must be breached before targeting 540.07.
On the other hand, an extended corrective move could push the price toward the 269.44 support level. In that case, a confirmed break with multiple H4 candle closures below the key Kijun-sen level would be required to validate further downside continuation.
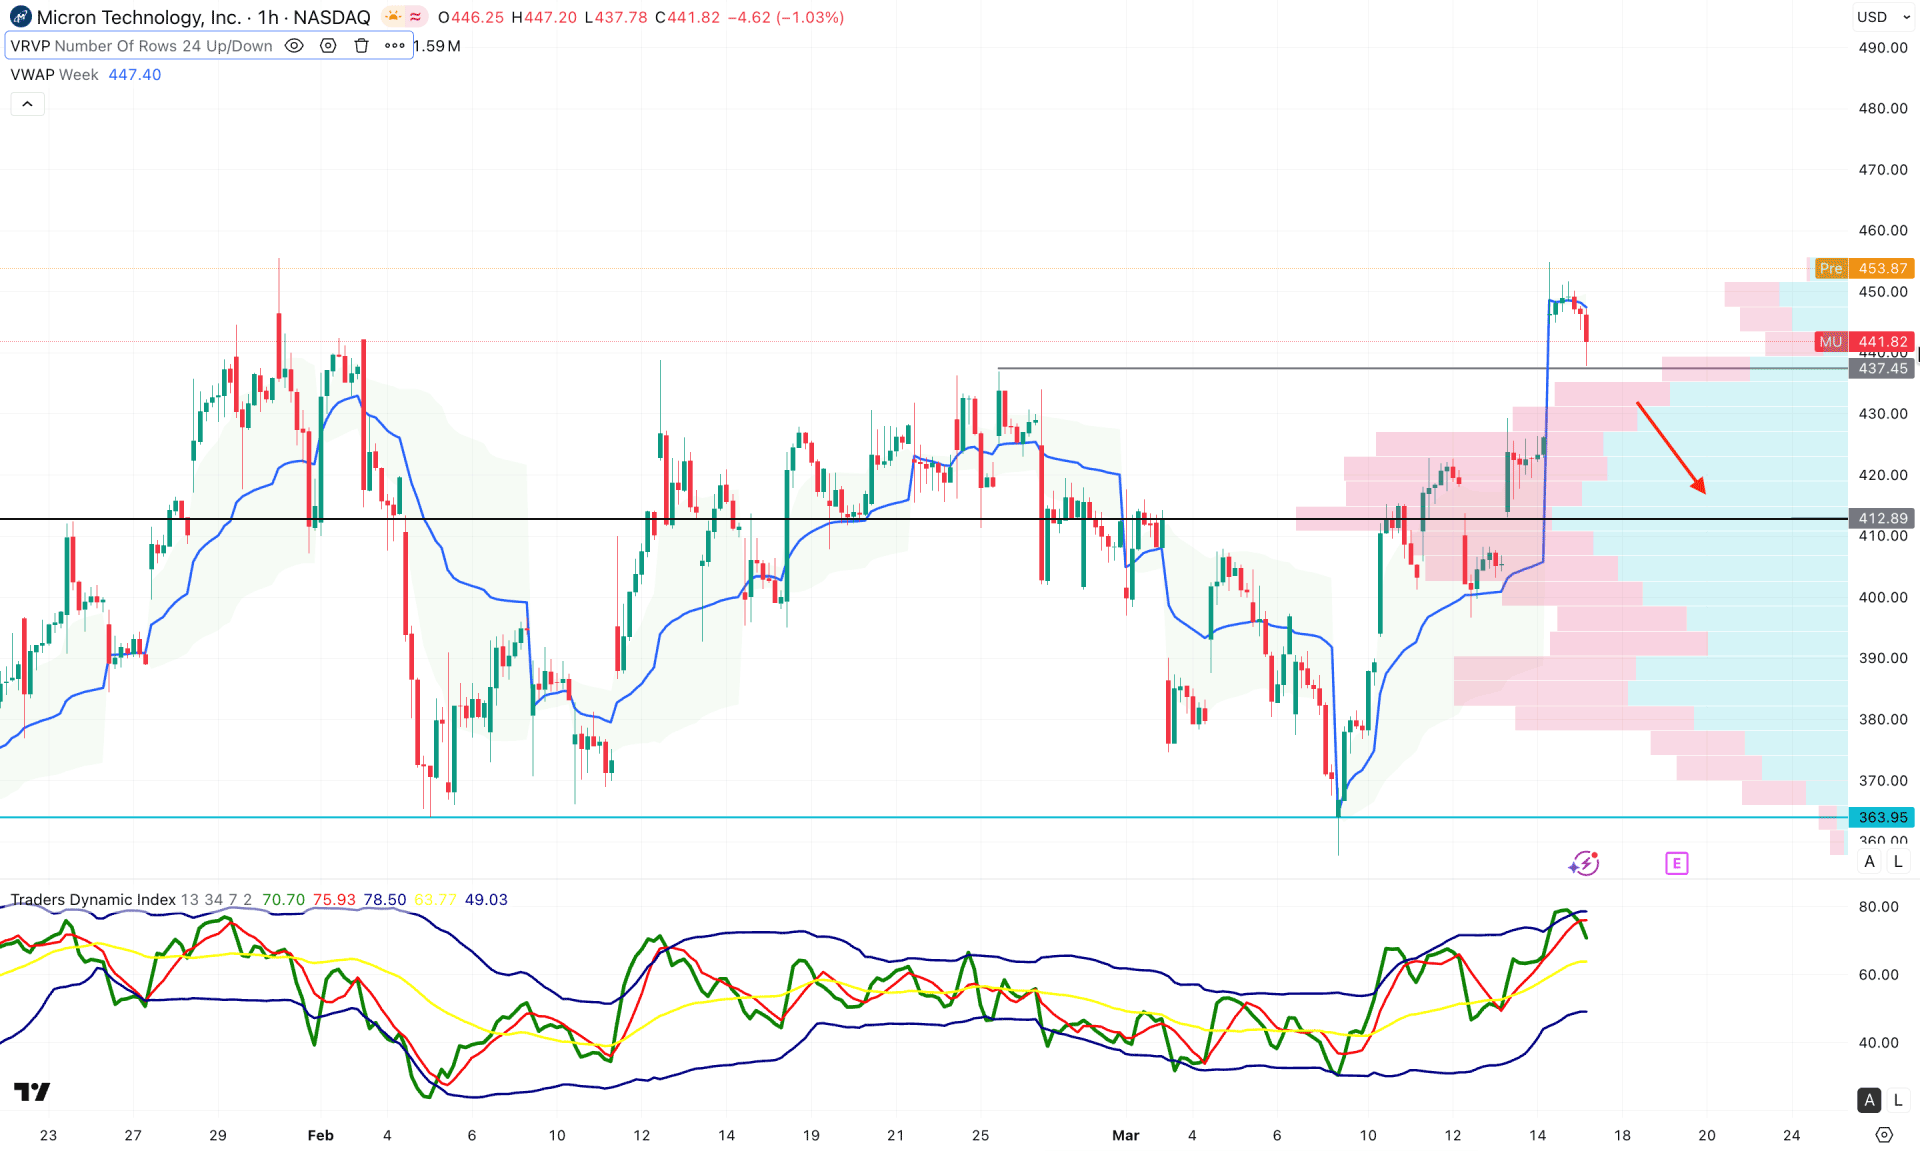
In the hourly timeframe, the price is trading in the premium area with a bullish impulsive pressure. However, the entire structure is sideways, which is not ideal before opening a position.
On the other hand, the weekly VWAP is sideways at the current price area, while the gap between the current price and the intraday high volume line has expanded.
In the indicator window, the current indicator line is in an overbought area, from where a bearish slope signals a potential bearish correction.
Based on the hourly structure, the MU is trading within a sideways momentum where the immediate support is at the 412.89 level. A break below this line with a bearish H1 close could find the support at the 363.95 level.
Based on the overall market outlook, MU's long-term market trend is bullish, where the recent consolidation at the record high price could offer a decent trend continuation opportunity from a range breakout. However, a failure to hold the price above the rectangle resistance could be the first sign of a selling pressure.


