
Published: April 29th, 2026
Meta Platforms' earnings reports are among the most straightforward in the Big Tech industry. In this week's earnings report, the focus will once again be on ad sales, which account for nearly all of its revenue.
However, the corporation is under increasing pressure to perform exceptionally well, with expected capital spending of approximately $135 billion in 2026. The stock plummeted as investors processed the excessive capex guidance following the original announcement of fourth-quarter earnings.
However, when investors looked at the remainder of the report, they saw both a very successful quarter and an equally promising forecast for the initial quarter. The following day, the stock increased by 10%.
On Wednesday, Meta will need to do it again. Wall Street analysts predict that the company's first-quarter sales will reach $55.6 billion, a 31% increase. However, rising depreciation and R&D expenses are thought to have an effect on earnings per share.
Meta's AI efforts may already be effective in improving engagement and ad targeting. Despite significantly slower user growth at 7%, the number of advertisements for social media users increased by 18% in the final quarter compared to the previous year. Meta managed to maintain average ad pricing and even increase it by 6% compared to 2024, despite the dramatic rise in ad volume.
Let's see the further aspect of this stock from the META technical analysis:
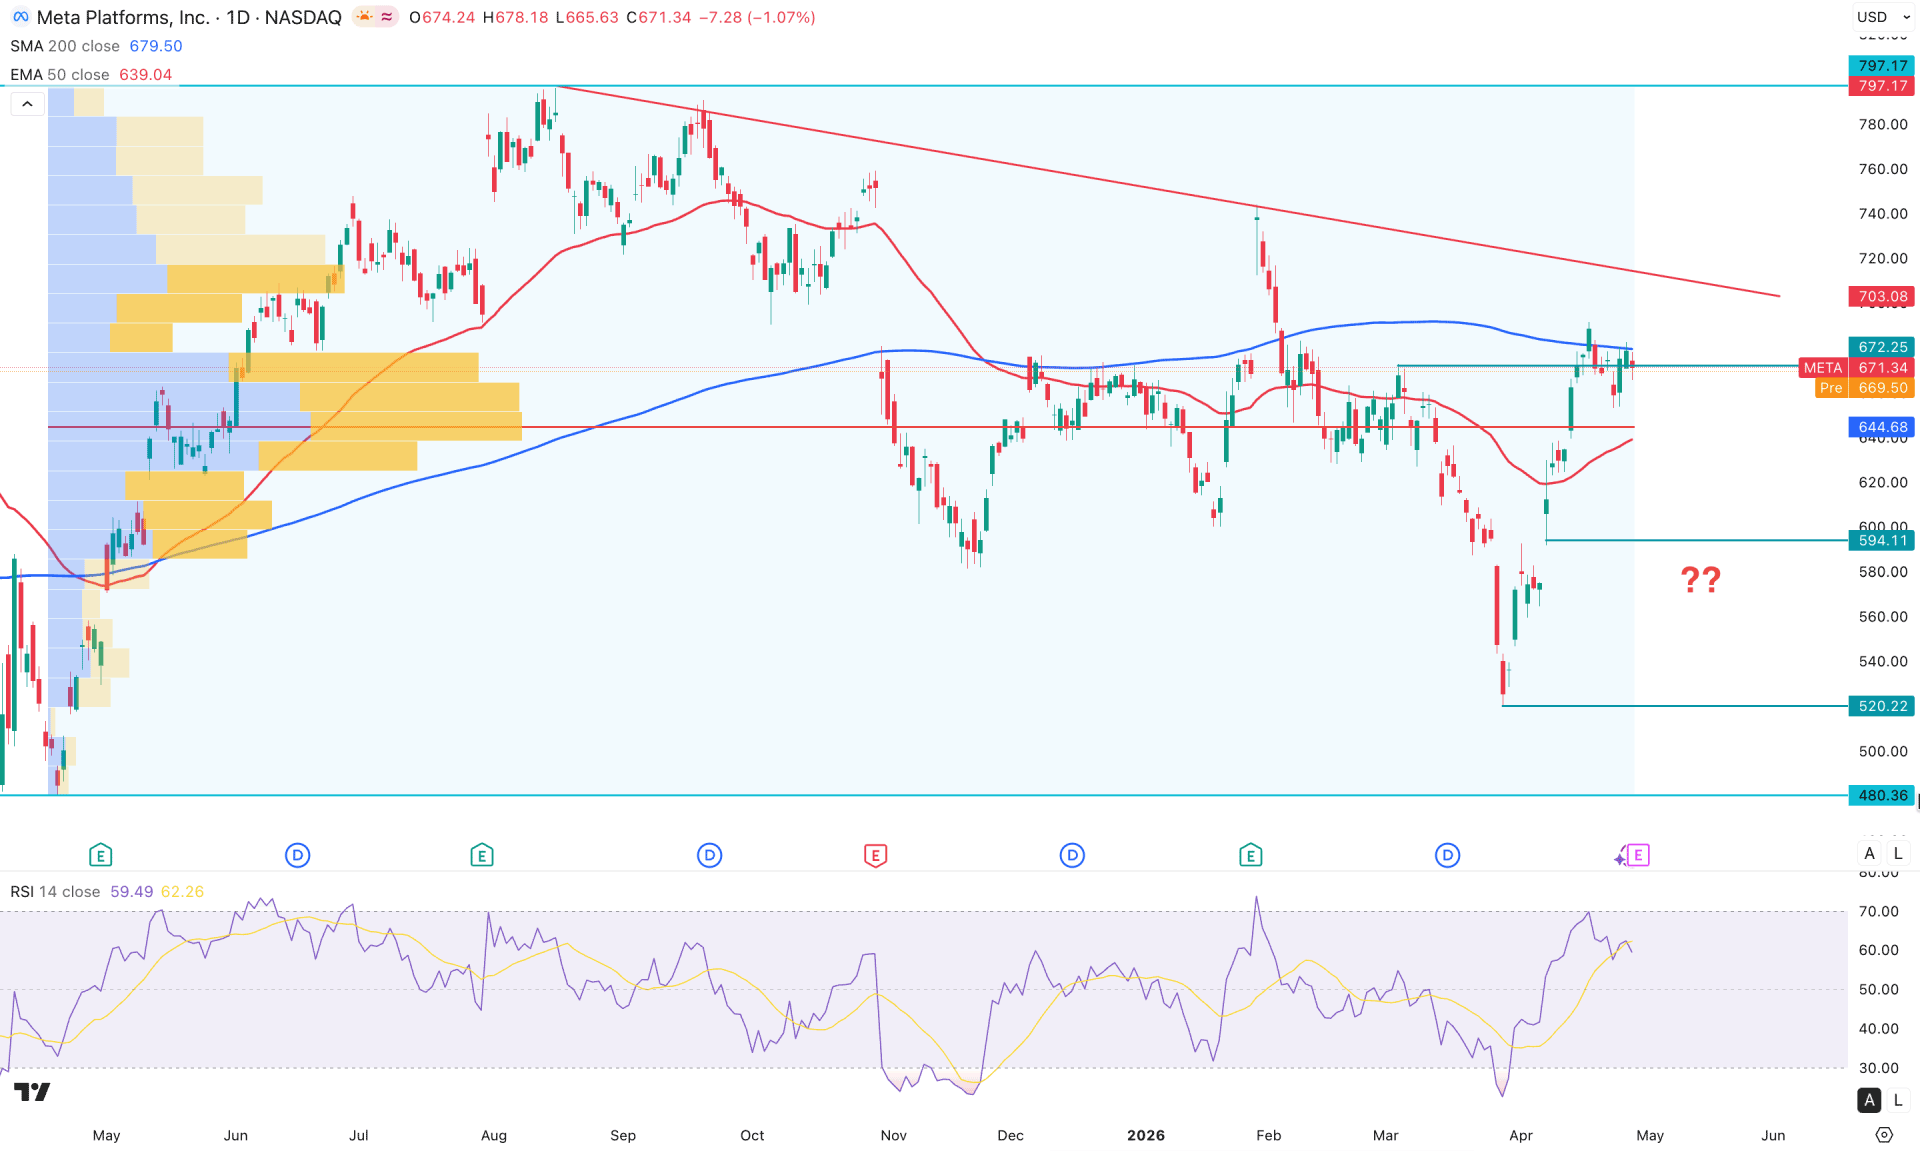
In the daily chart of META, an extended corrective market momentum is visible, where multiple swing low violations are clear. However, the existing market momentum is still within the major bullish structure, suggesting a potential bullish rebound.
Looking at the higher timeframe, the price is trading within a symmetrical triangle formation in the monthly chart, where the most recent monthly candle is showing a bullish reaction after overcoming the 641.92 resistance level. The weekly price shows the same story, as three consecutive bullish weekly candles are present, supported by a strong bullish V-shaped recovery.
In terms of volume, bullish momentum is visible as the largest activity level since April 2025 is below the current price. A bullish breakout with an impulsive pressure above the high-volume level is clear, which is a primary bullish opportunity.
In the main price chart, the daily price is facing strong resistance from the 200-day SMA, which is above the current price. However, the 50-day EMA is below the current price and has a bullish slope, suggesting mid-term buying pressure. Primarily, a break above the 200-day SMA could be a remarkable shift for buyers, as it could validate the bullish opportunity for the coming days.
In the secondary indicator window, the RSI is sideways after testing the 70.00 overbought level. However, the market momentum might remain bullish as long as the RSI stays above the 50.00 neutral point. Based on the market structure, Meta stock is trading with a bullish pre-breakout opportunity. A strong trendline resistance is visible, which is just above the 200 SMA. The conservative approach is to wait for a bullish break above the 720.00 level. The immediate target level would be 797.17.
However, a minor bearish correction is possible, where the immediate support level is at 594.11. A bounce from this support line or the 50-day EMA could offer another long opportunity at any time.
On the other hand, the bearish approach might come from the immediate 200-day Simple Moving Average line. A failure to break the 200 SMA line, along with a bearish daily candle below the high-volume support line, could increase the possibility of testing the 594.11 support level. Moreover, failure to hold the price at this support line could open the room for making a new swing low below the 520.22 level.
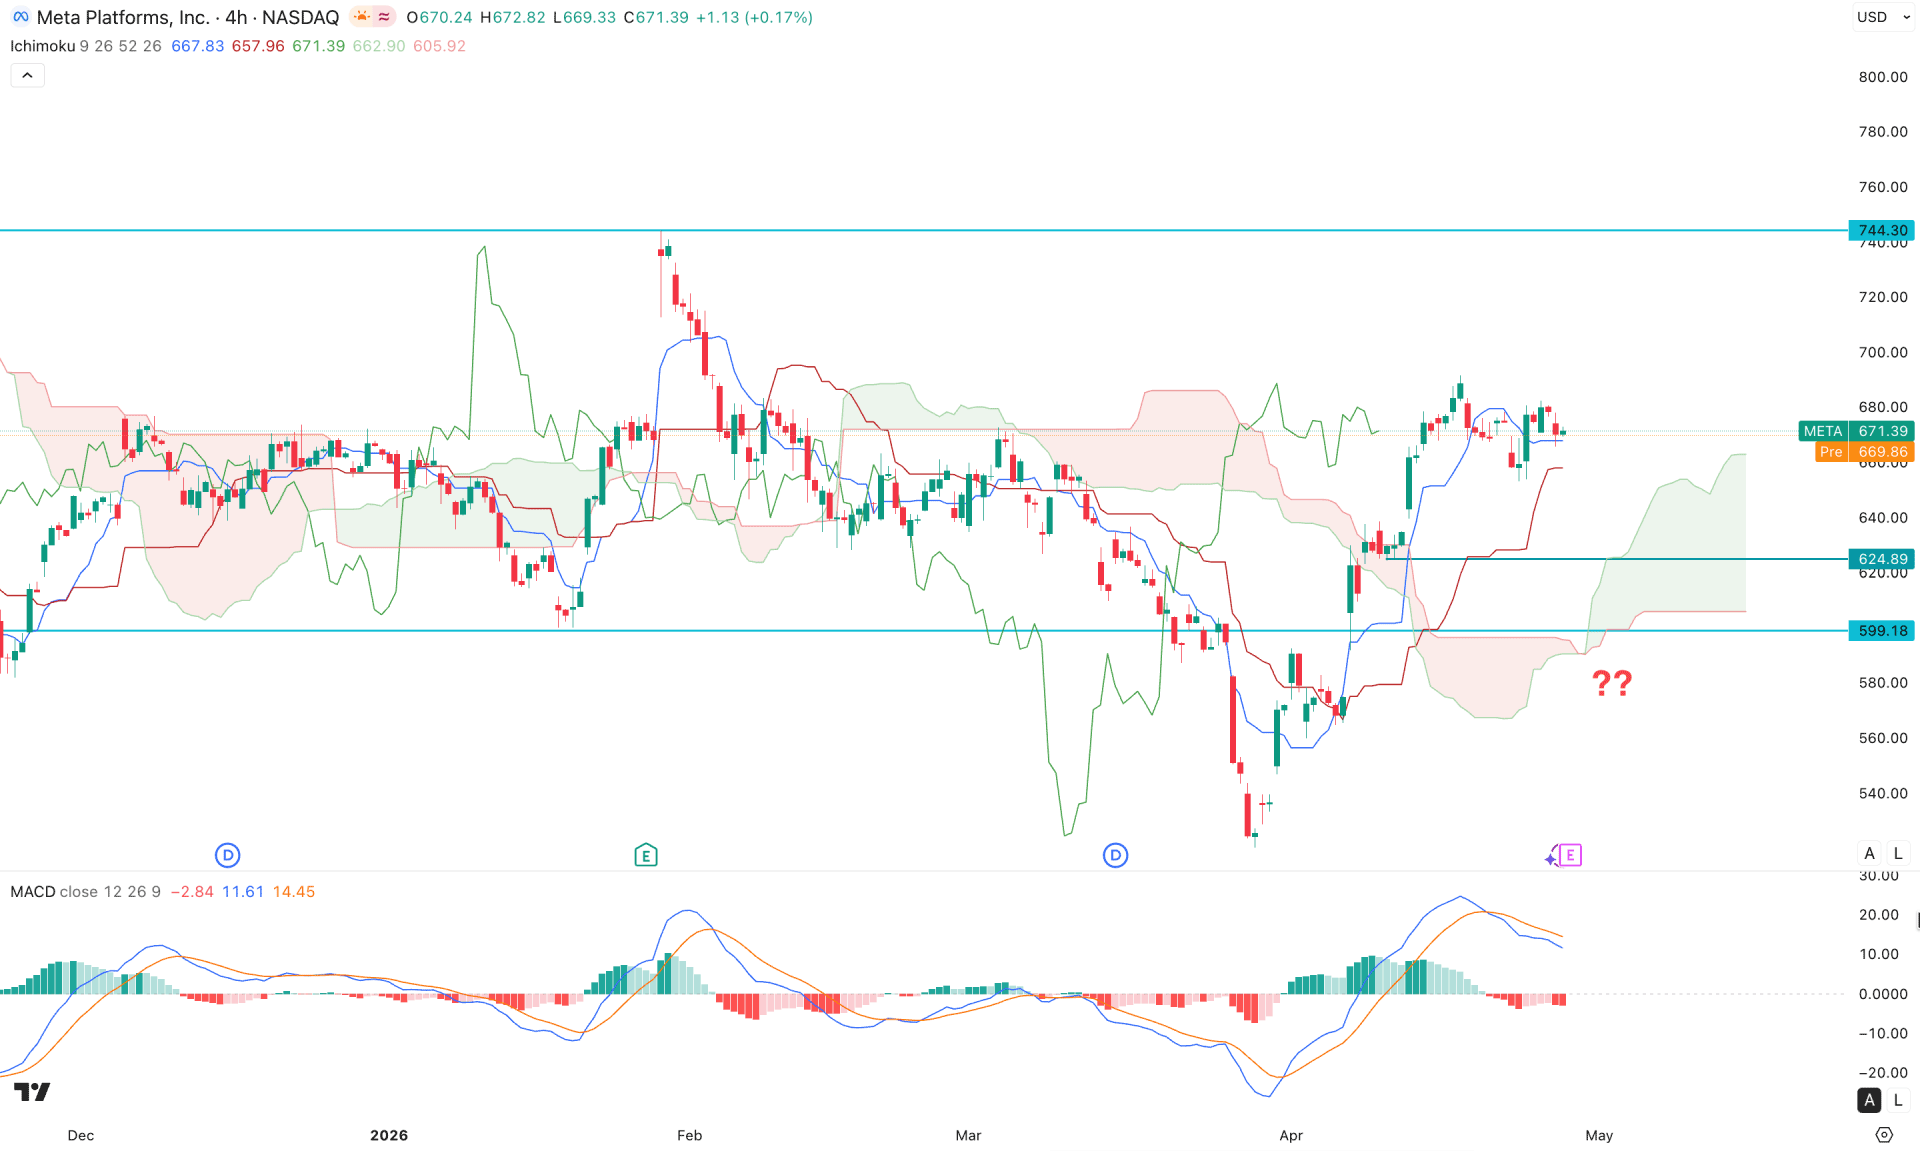
In the four-hour chart of META, a strong bullish recovery is clear, taking the price above the cloud support with a counter-bullish momentum. It is a primary sign of a bullish trend reversal, while the major market momentum remains bullish. Moreover, the future cloud looks positive as both lines are heading upward with strong thickness.
In dynamic lines, the dynamic Kijun Sen level is below the current price and is working as an immediate support.
In the secondary indicator window, the MACD signal line has a downward slope after forming a bearish crossover at the top. It is a sign of minor selling pressure, even if the major market momentum is bullish.
Based on this market outlook, the price has a higher possibility of forming a downside correction before offering a long opportunity.
The immediate static support level is at 624.91, which could be tested before offering the opportunity. Investors should closely monitor the price action in this area, as a valid bullish reversal with an H4 candle above the key level could offer a long opportunity targeting the 744.30 resistance level.
On the other hand, the price is trading sideways at the key support zone. From here, a new swing high above the 700.00 level could offer an immediate long opportunity.
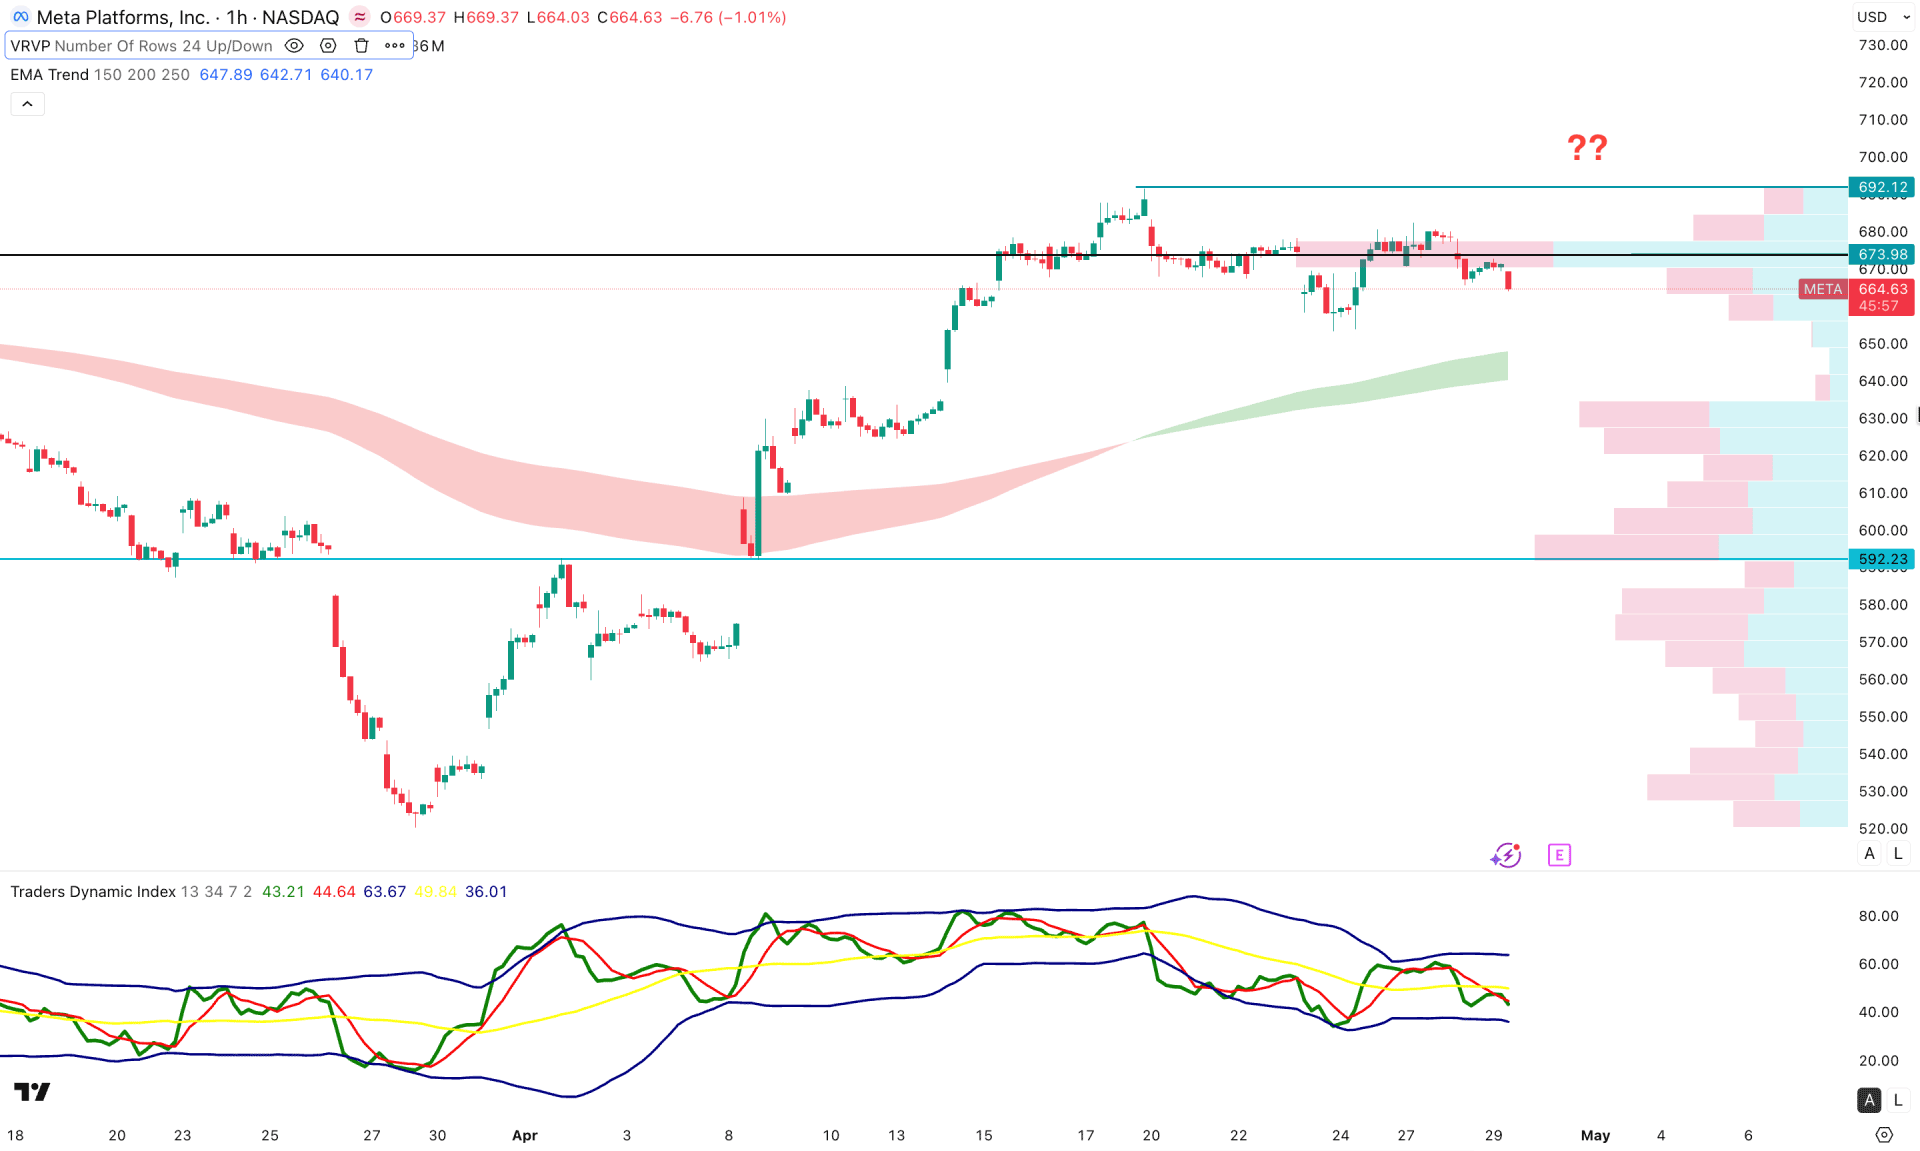
In the hourly chart of META, the intraday price is extremely bullish. However, the most recent market momentum is sideways at the premium zone. As consolidation is seen at the peak, a proper break is needed before validating the market trend.
The EMA wave is below the current price and is working as an immediate support, while the high-volume line is above the current price and acting as a resistance.
In this context, investors need a valid breakout where the immediate resistance is at the 692.12 level. In that case, a bullish engulfing candle above the 692.12 level, with the Traders Dynamic Index above the 50.00 level, could offer a decent long opportunity.
On the other hand, the immediate support is at the 640.00 level, which is in line with the EMA. A break below this line could offer a secondary long opportunity from the 600.00–560.00 zone.
Based on the overall market outlook, META stock is trading within a long-term bullish trend, where the recent price shows a valid recovery with a strong sell-side liquidity sweep. In that case, investors should closely monitor how the price holds buying pressure at the current area, as a valid intraday bullish signal could offer an early trend-following opportunity in line with the higher timeframe direction.


