
Published: August 29th, 2023
The basic investment approach in any trading instrument is to follow the big money. Any buying pressure on a stock with a higher trading volume could hint at a long-term investment opportunity, and there is no exception for the Meta stock.
Since the beginning of 2023, Meta stock faced an unusual trading volume in February, March, May, June, and July, which might work as a bullish factor even if it is a corrective quarter.
Besides, the fundamental outlook is a crucial indicator to determine the future stock price. META's current 3-year sales growth is 19.2%, while the EPS growth is 18.8% for the same period. In the latest earnings report, the company expects the EPS to remain above the 25.% this year.
The strong fundamental institutional investors’ interest and strong growth projections might offer a decent buying opportunity in the Meta stock.
Let’s see the upcoming price direction of this stock from the Meta (META) technical analysis:
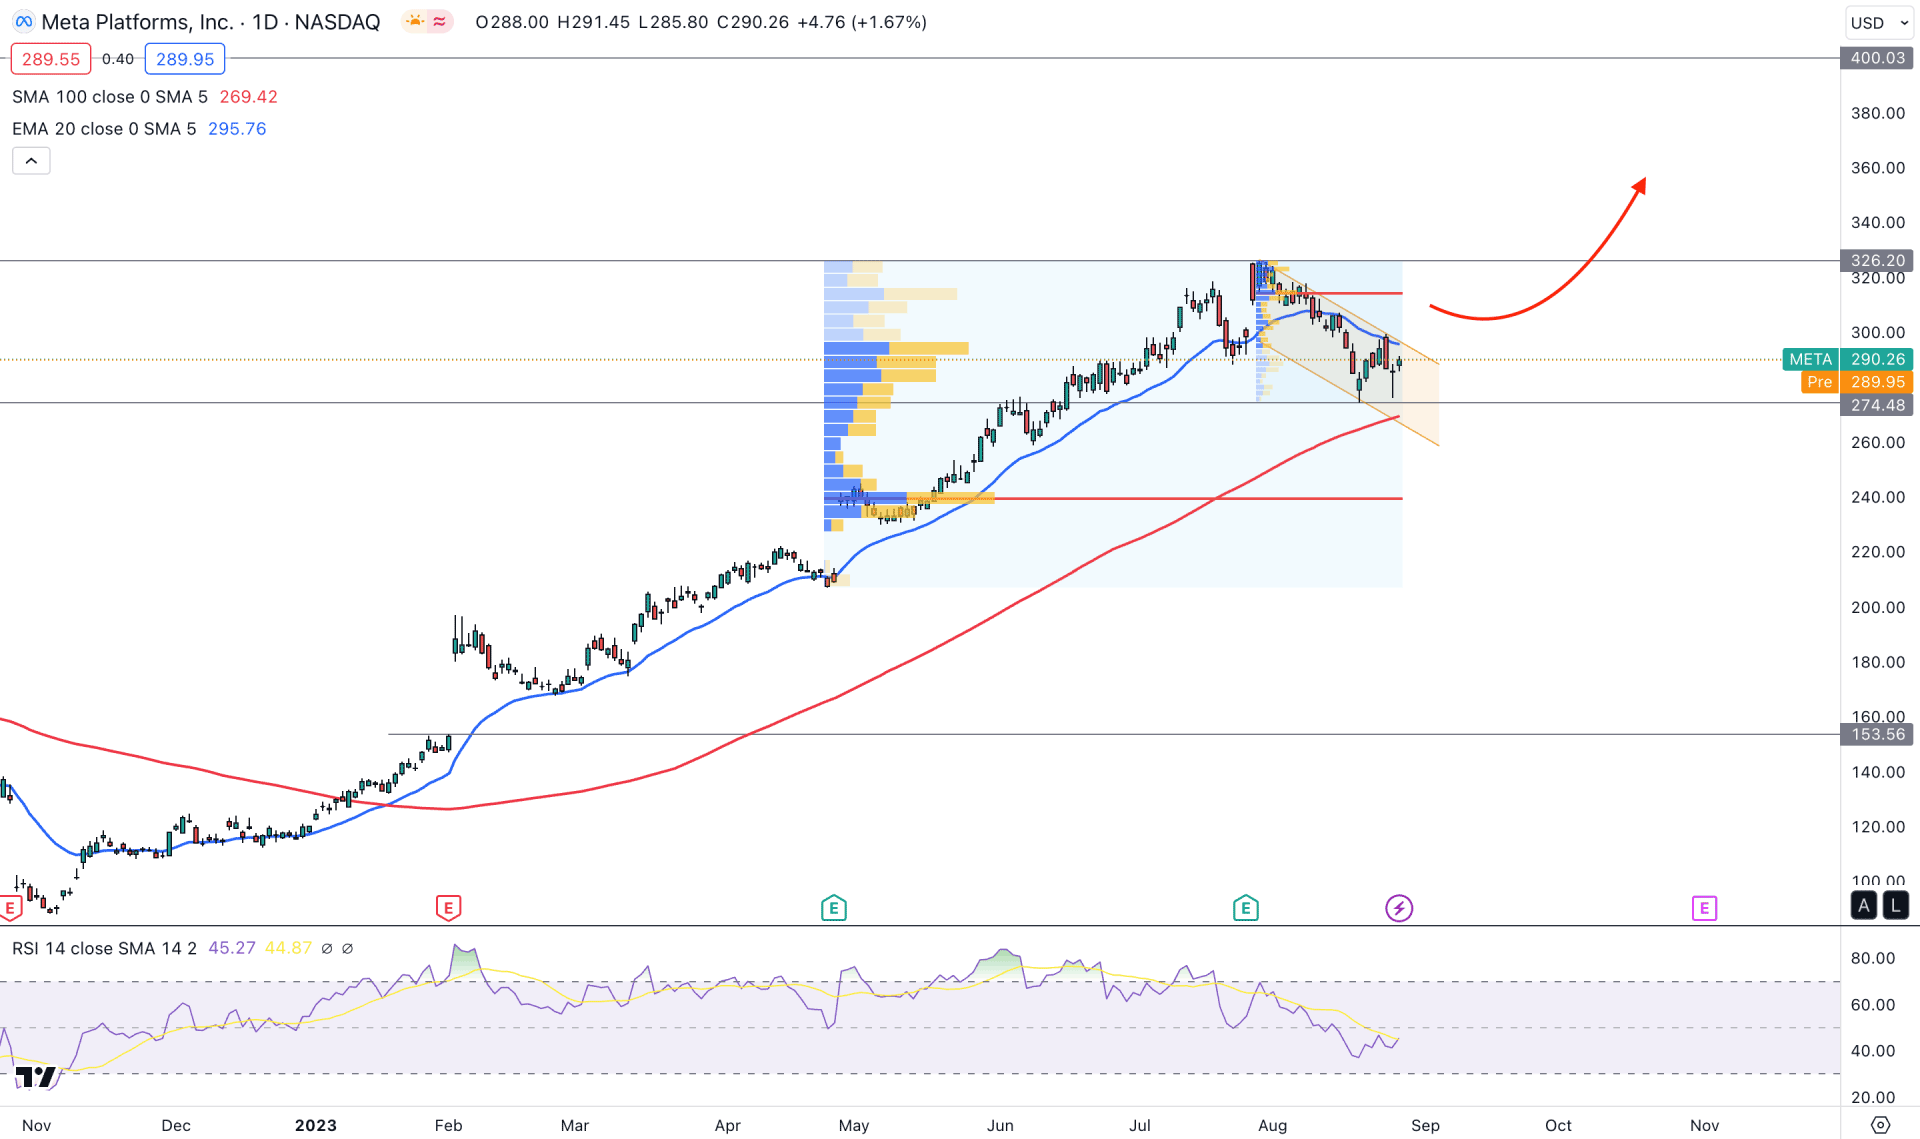
In the daily chart of META, the broader market direction is bullish with a strong fundamental. In this structure, the easiest way to make money is to find a zone where sellers fail, and a bullish reversal is formed. As per the above image, the current price is trading within a channel formation, where a breakout towards the buyers' side could be a strong long signal. The buying pressure is also supported by the higher time frames price action, where the latest monthly candle is still trading within the bullish of July 2023. The weekly price shows a sellers’ presence after a long bull run, from where a new bullish trend needs a valid confirmation.
A clearer view is visible in the daily chart, where the current price is trading below the 20-day Exponential Moving Average. However, the 100-day Simple Moving Average is still below the price, while a mixed sentiment is present from the volume structure.
Based on the visible range high-volume structure, the highest activity level since 15 March is at 239.45 level, which is 17% below the current price. On the other hand, another high volume level since 28 July is at 314.15 level, which is above the current price. Based on this structure, the buying possibility is potent, but a bullish recovery above the 315.00 level could initiate an impulsive bullish momentum.
In the secondary indicator window, the current RSI hovers below the 50.00 level, which signals an active downside correction. In that case, a recovery with a stable reading above the 50.00 level would increase the possibility of initiating a bull run in the market.
Based on the daily price outlook, META stock may resume the bull run after completing the downside correction. The ideal approach is to wait for the price to form the channel breakout and have a daily close above the 314.15 high volume level.
On the other hand, the bearish continuation with a swing low below the 238.00 level could lower the price towards the 160.00 level.
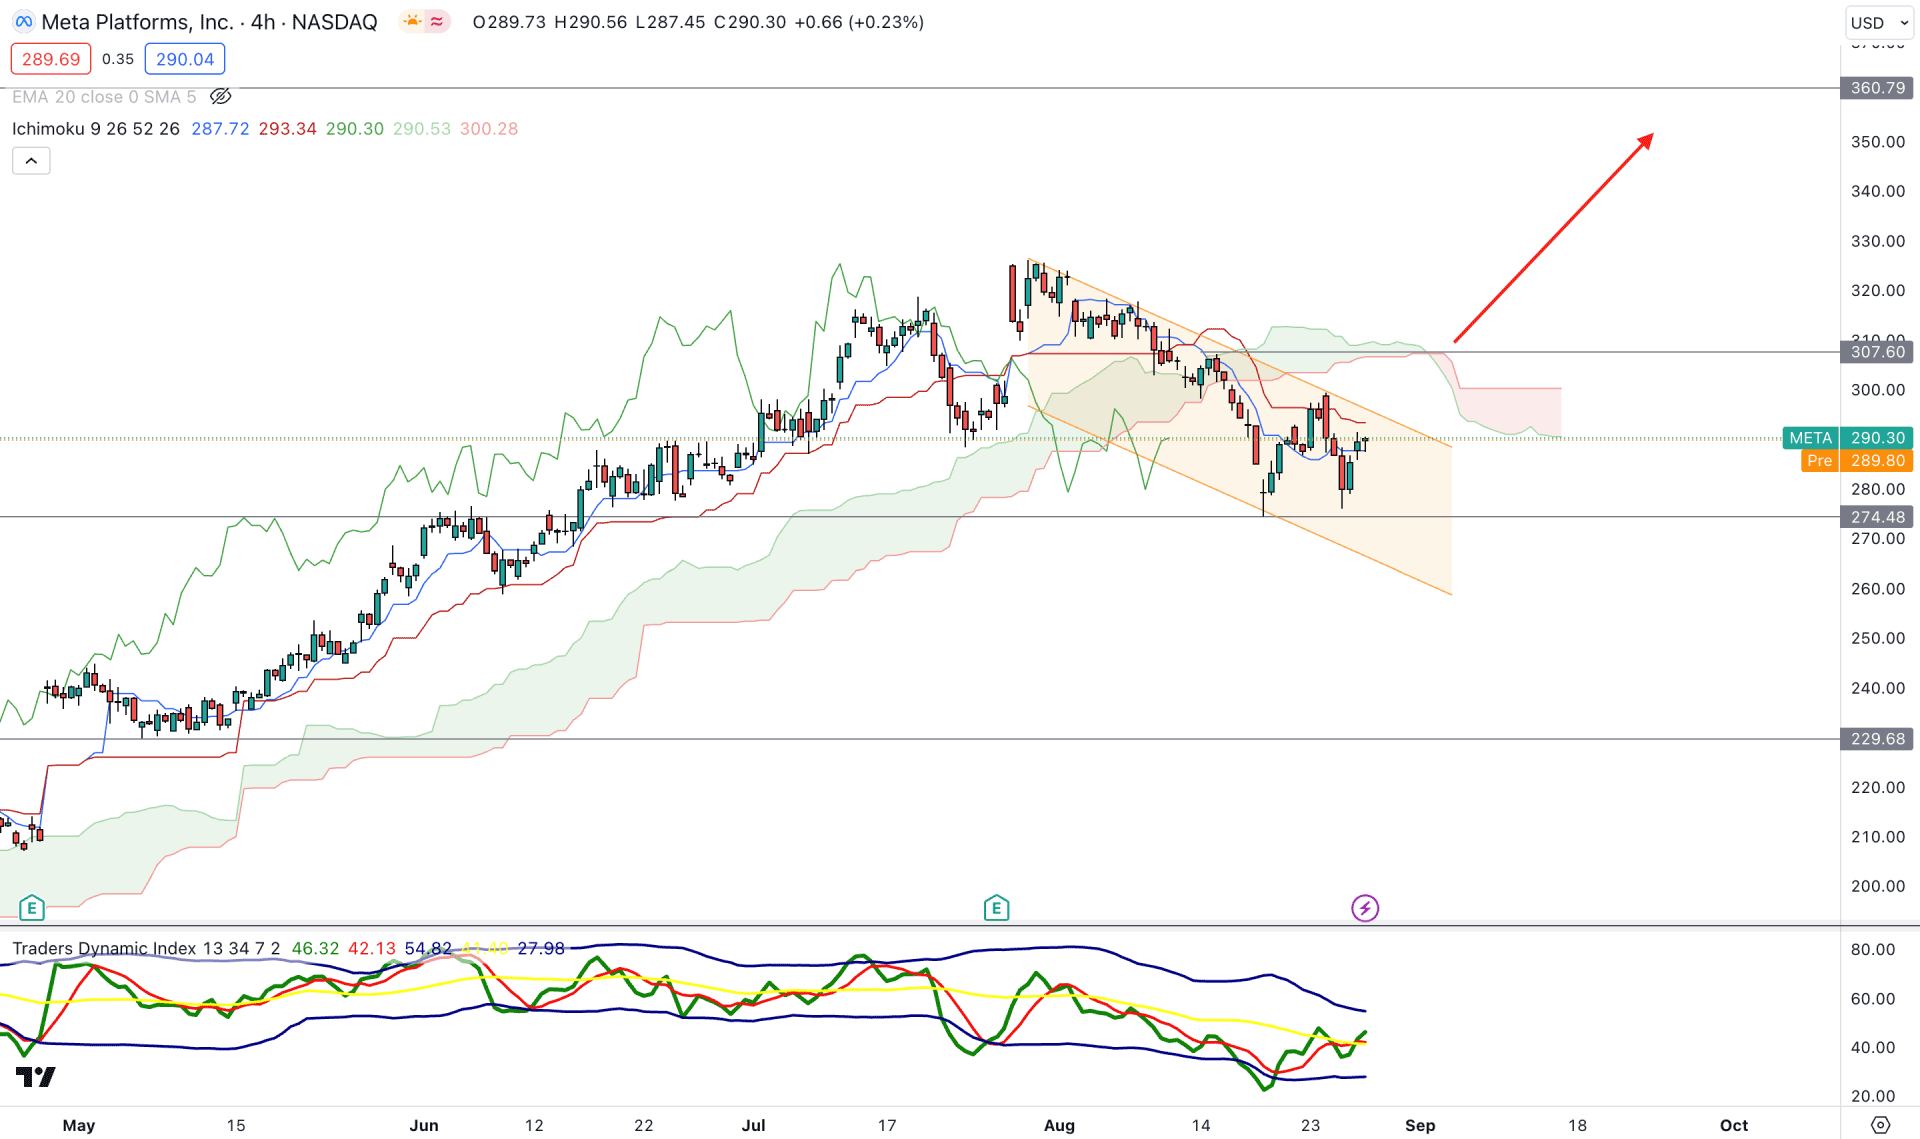
In the H4 chart, the early buy signal is visible from the Traders Dynamic Index indicator, where the current TDI level shows a bullish rebound above the 50.00 level.
On the other hand, the H4 price is still sideways within the channel, where the current Future cloud is working as a strong resistance. Moreover, dynamic levels are above the current price, from where a bearish continuation may appear.
Based on the H4 structure, bulls should wait for a solid breakout before forming a long signal. The general idea is to find a strong H4 candle above the 307.60 level before aiming for the 360.00 resistance area. However, a bearish rejection from the dynamic resistance with an H4 candle below the 273.00 level could resume the bearish trend toward the 220.00 area.
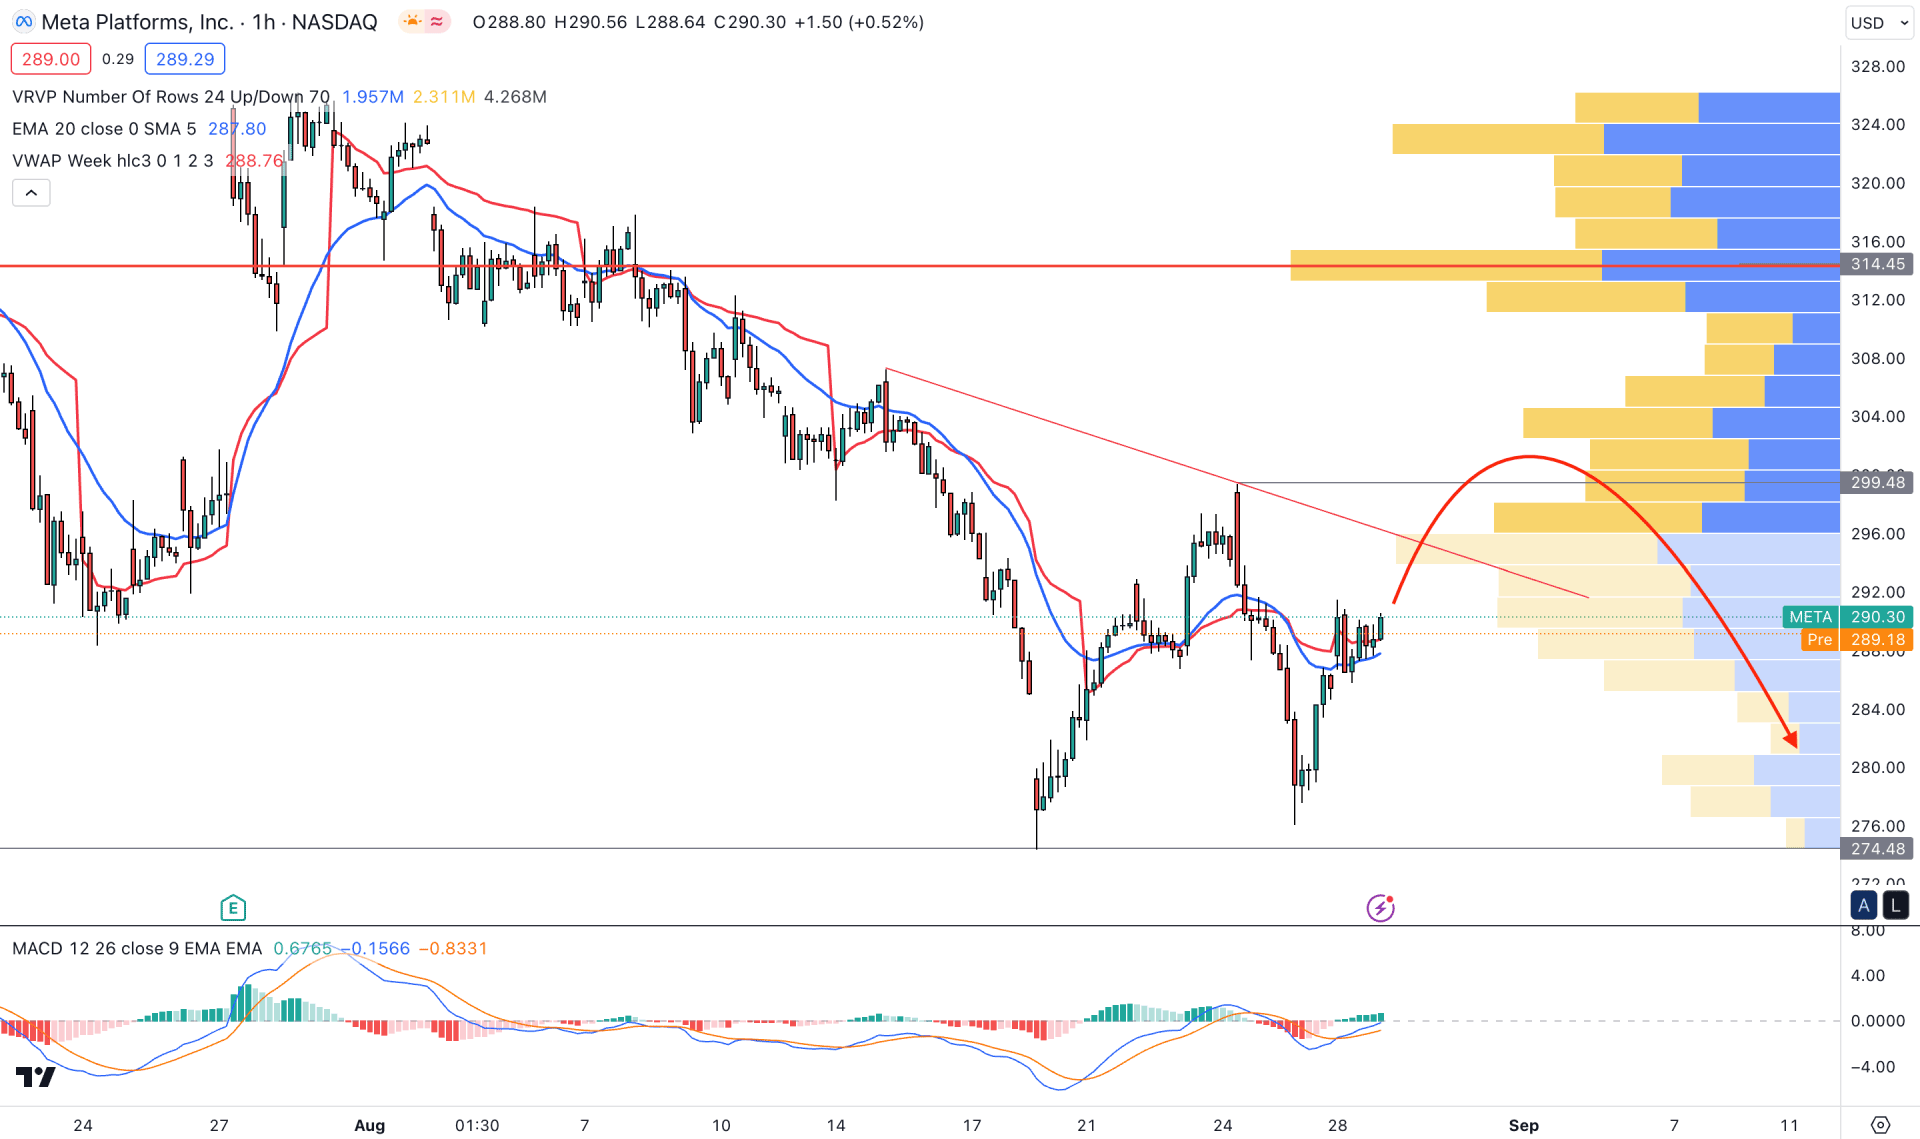
In the H1 chart, the bearish momentum is solid as the intraday high volume level is above the current price. Moreover, several lower lowes have formed below the high volume level while the current price trades above dynamic levels.
The MACD Histogram shows a buying pressure supported by an emerging signal line, where the current price is facing support from the dynamic 20 EMA.
The long-term bullish trend needs confirmation from the H1 chart, which should come with a proper breakout. The conservative buying approach is to find the price above the high volume level before approaching the 350.00 area. However, the 299.49 to 315.00 area could work as a liquid zone, from where a strong selling pressure could resume the current trend.
Based on the current market structure, META stock is trading within a downside correction, which may offer a decent buying opportunity from the bottom. However, investors should closely monitor the H1 chart as any sellers’ rejection could resume the long-term trend.


