
Published: July 29th, 2025
After the bell on Wednesday, Meta Platforms, the social media operator, will disclose its quarterly earnings report, while the price remains at a record high level.
The previous quarter, Meta reported sales of $42.31 billion, growing 16.1% year over year, 2.3% more than experts had predicted. The company had a mixed quarter, with revenue forecast for the upcoming quarter falling well short of the projections of analysts and a significant beat of analysts' EBITDA projections. 3.43 billion users were active every day, a 5.9% increase from the previous year.
Analysts predict that Meta's sales will increase 14.8% compared to the previous year to $44.83 billion this quarter, which would be a slower growth than the 22.1% gain it saw in the same period last year. It is anticipated that adjusted earnings will be $5.86 per share.
Some of Meta's competitors in the consumer web market have already released their Q2 numbers, which gives us an idea of what to anticipate. For example, Coursera posted revenues of 9.8%, exceeding projections by 3.7%, while Alphabet posted year-over-year sales growth of 13.8%, surpassing the projections of analysts by 2.6%. Following the results, Coursera's stock price increased 36.2%, while Alphabet's remained constant.
Meta is down 2.7% over the same period and has a median analyst value target of $754.58 going into earnings, which is lower than the price of the stock of $715.13 at the moment.
Let's see the final outlook for this stock from the META technical analysis:
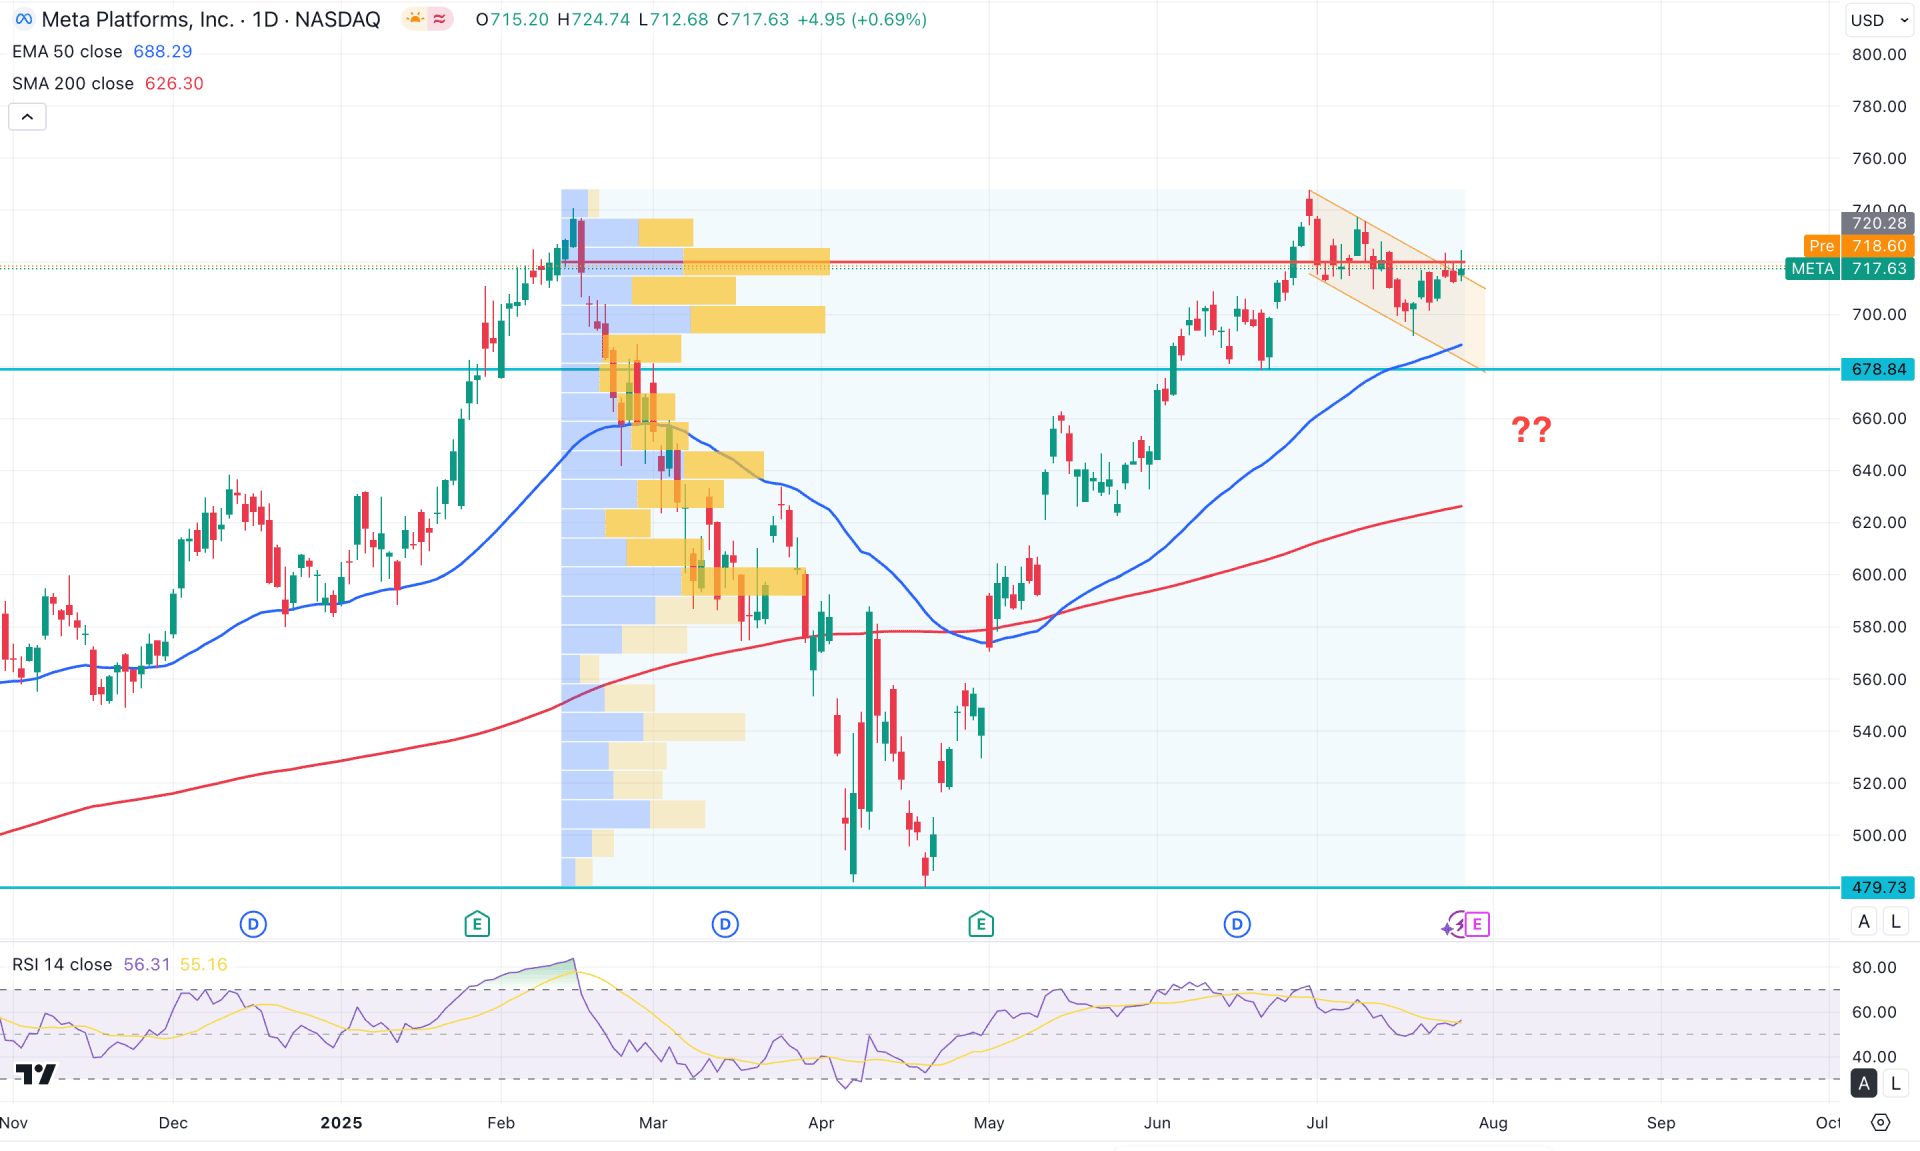
On the daily chart of Meta, ongoing buying pressure is evident as the recent price is trading at a crucial resistance level. A further bullish push is required before anticipating a continuation of the upward trend.
Looking at the higher timeframes, the recent monthly candle is trading sideways within the bullish body of June 2025. The current momentum remains bullish, supported by the recovery from the April 2025 low. The weekly chart tells a similar story, with a bullish V-shaped recovery present, and the price hovering near the key resistance zone.
From the volume perspective, the price is trading within a consolidation zone, with a new high-volume level forming at the top. As the price remains near this high-volume area, a breakout is needed before confirming a stable directional move.
On the main chart, the 200-day SMA acts as a major support level, from which a bullish crossover is seen with the 50-day EMA. Since both moving averages are positioned below the current price, a bullish continuation remains highly probable.
In the secondary indicator window, the Relative Strength Index (RSI) shows sideways momentum, with the most recent reading fluctuating around the neutral 50.00 area. A recovery from the overbought 70.00 level is noted, suggesting investors should remain cautious before entering long positions unless the RSI breaks above the 60.00 mark.
Based on the current market structure, the ongoing bullish trend is likely to extend, and a breakout above the descending channel could offer an immediate long opportunity, targeting the 820.00 level. However, investors should closely watch the high-volume resistance at 720.28. A strong bullish breakout above this level is essential before entering any new positions.
Conversely, the price remains within the descending channel, where the channel resistance continues to act as a significant barrier. If a downside continuation occurs, the next support could be seen at the 678.84 level. A potential bullish reversal may occur from the 678.64 to 650.00 zone, particularly if the price recovers above the 50-day EMA.
However, any immediate bearish pressure with a confirmed breakout below the 640.00 support could invalidate the bullish scenario and drive the price lower toward the 479.00 level.
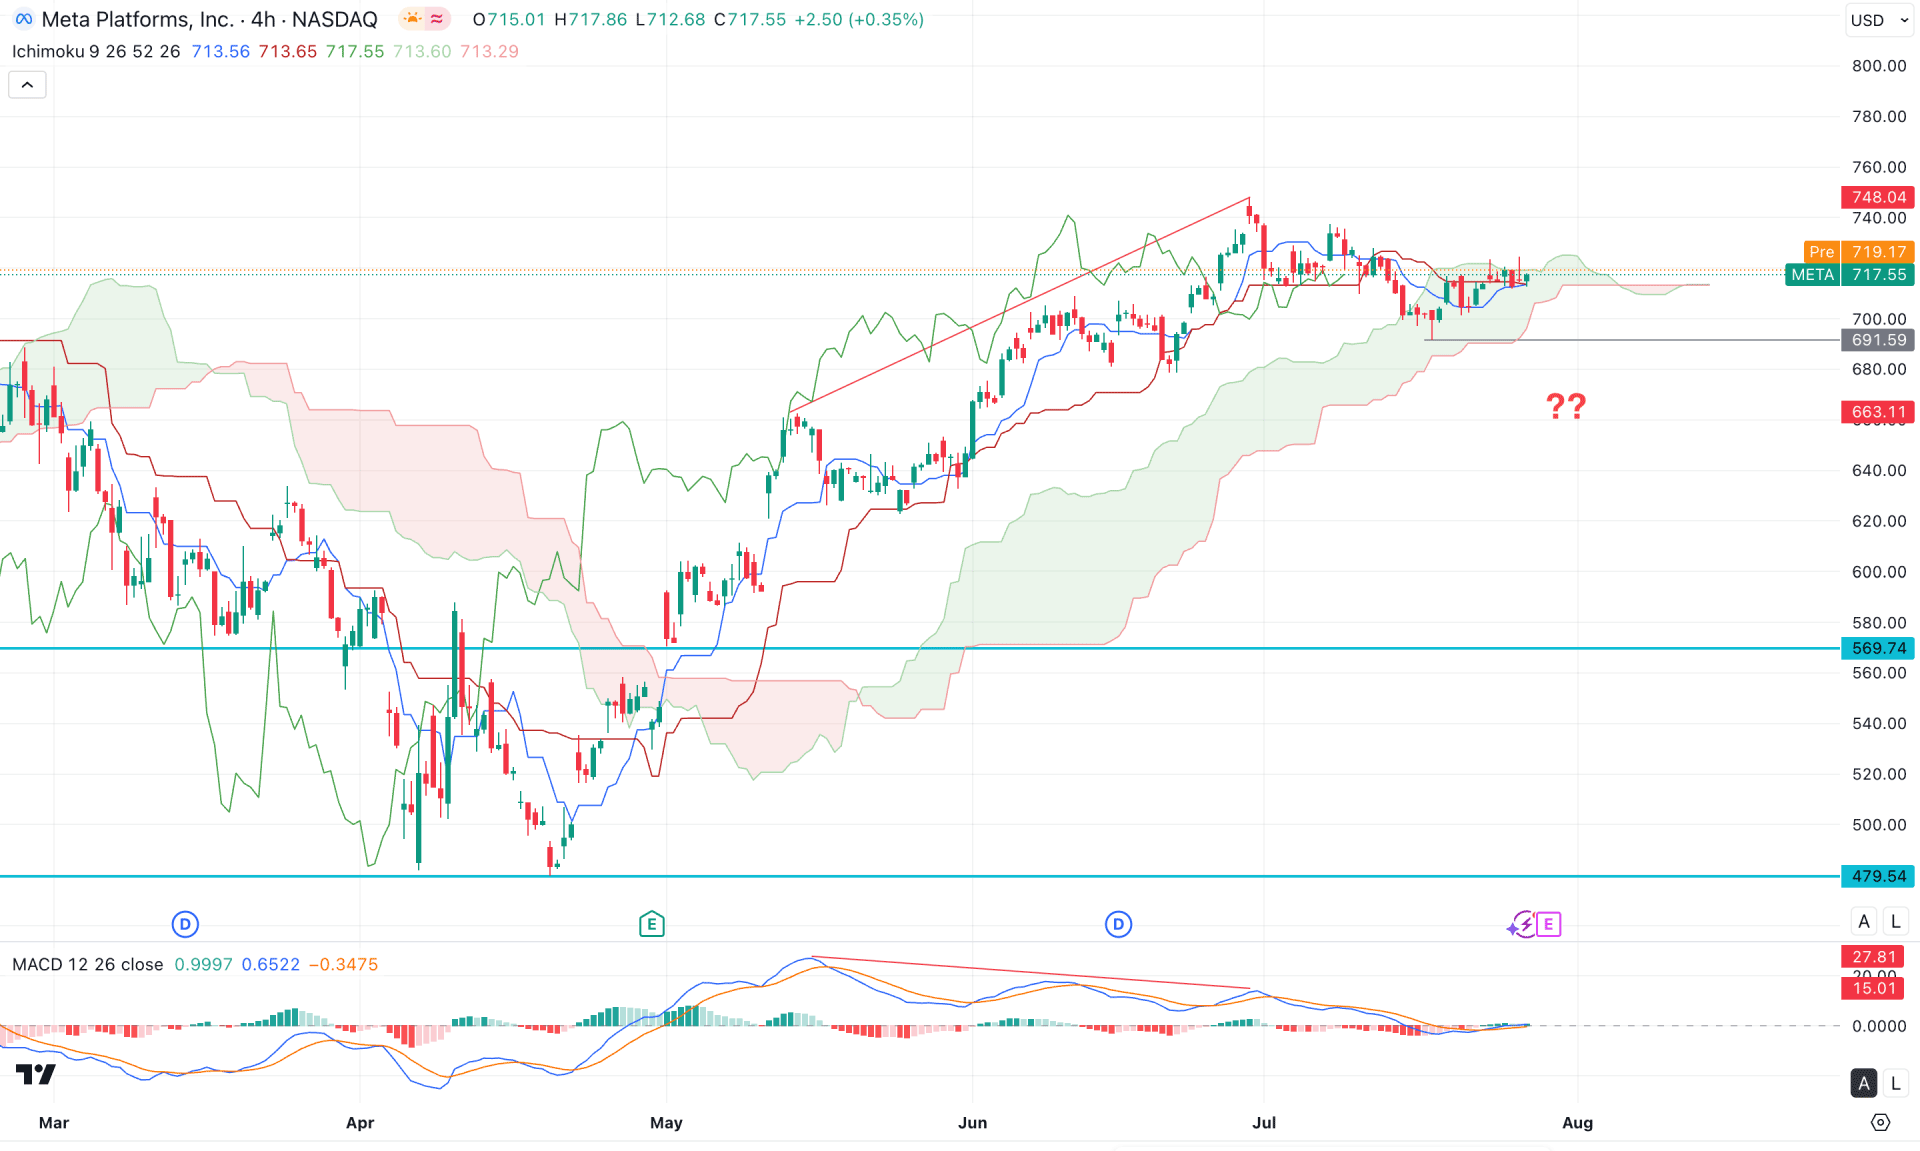
In the 4-hour timeframe, the ongoing price action remains bullish, as the recent price is still trading above the Ichimoku cloud. However, the future cloud thickness is not solid, while the current price is hovering around a dynamic support level, suggesting a possible consolidation phase.
In the secondary indicator window, the MACD histogram continues to reflect buying pressure, with consecutive bullish bars above the signal line. Additionally, the signal line has found a bottom and has rebounded above the neutral level.
However, a potential divergence is visible, as the MACD signal line has failed to maintain bullish traction, indicating, as seen in the main price chart, that momentum may be weakening at the top, and a potential bearish correction could be imminent.
Based on this outlook, investors should closely monitor how the price reacts around the cloud zone. A bullish continuation confirmed by a 4-hour candle close above the 737.60 level could act as a breakout signal, with an upside target toward 800.00.
On the other hand, a failure to hold above the 691.59 level would be a warning sign. A 4-hour candle close below this level could indicate a cloud break, potentially triggering further selling pressure and driving the price down toward the 580.00 area before another buying opportunity emerges.
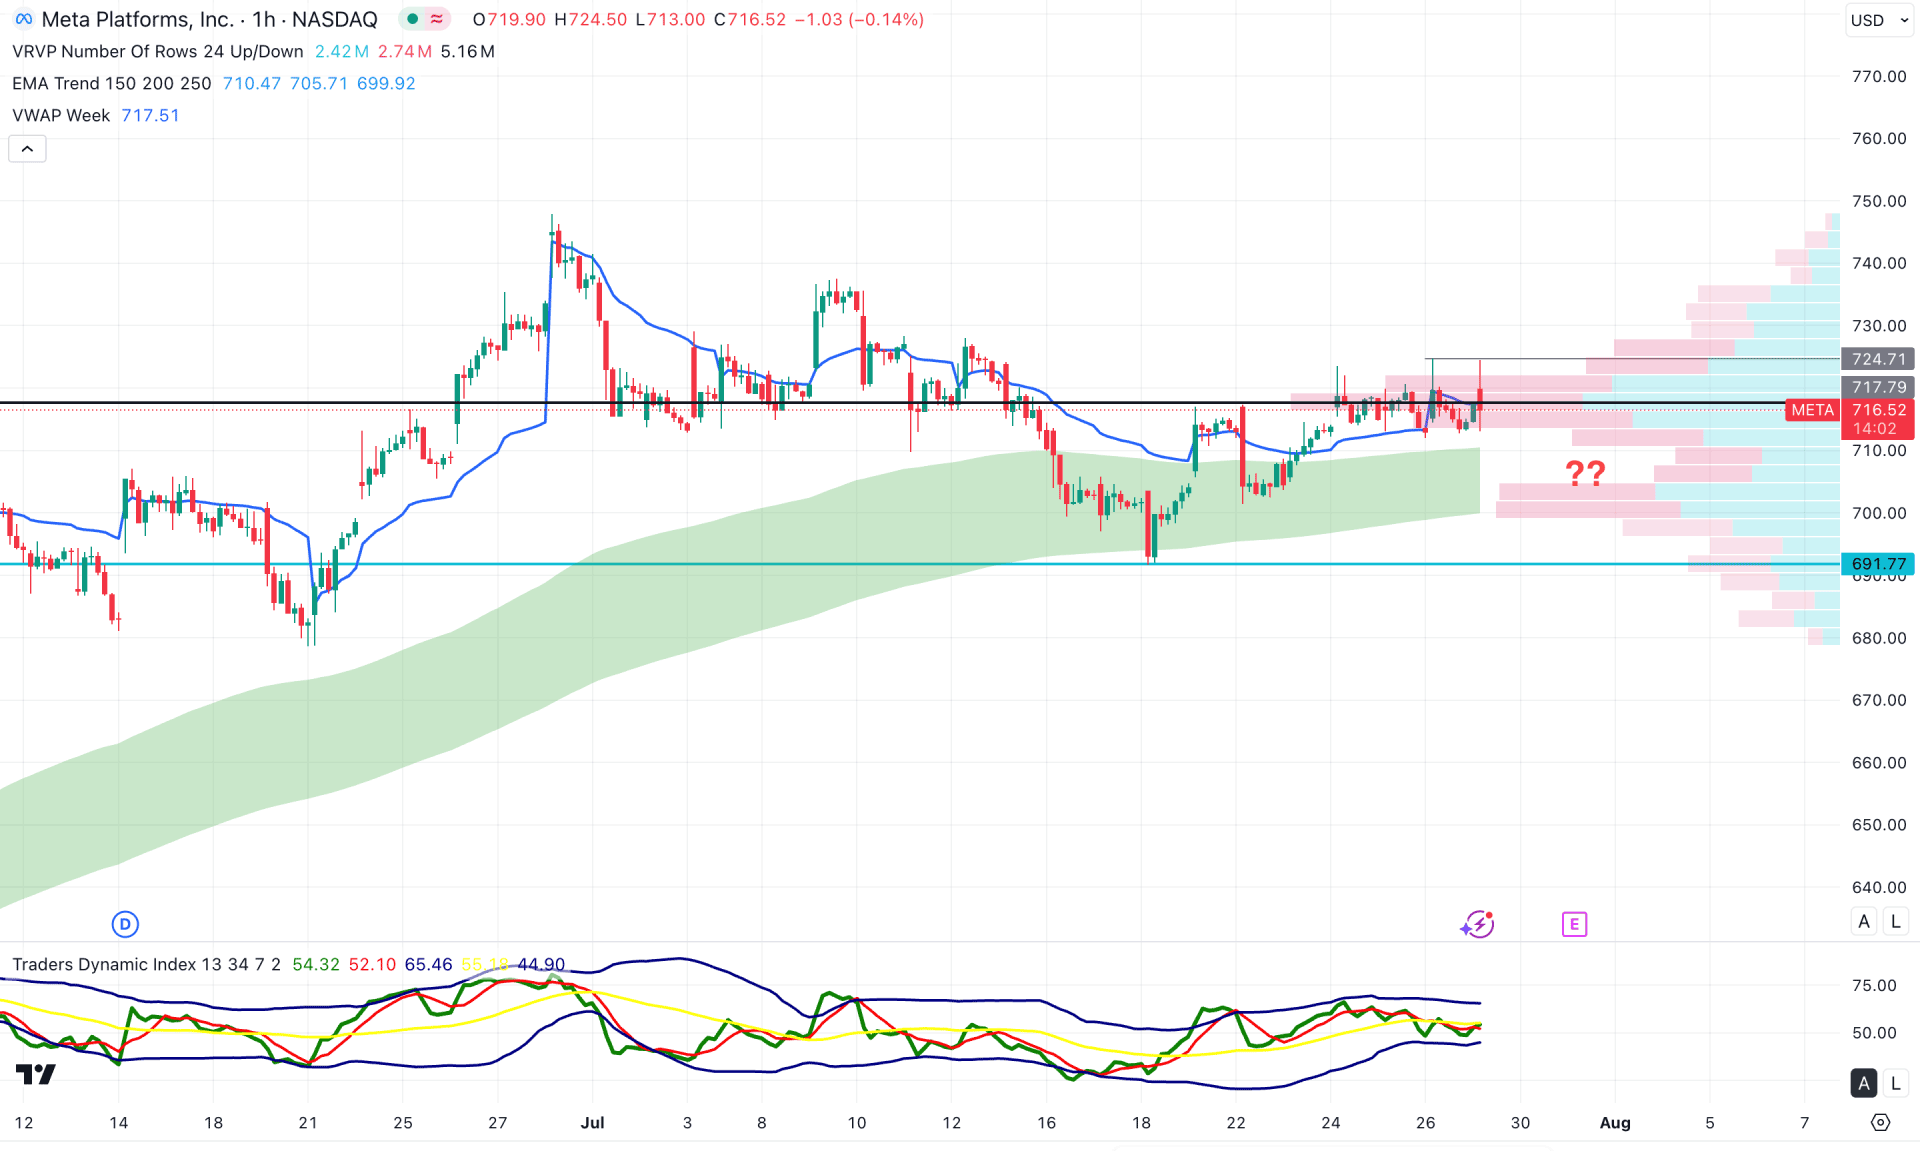
In the early timeframe, Meta stock is trading within a sideways momentum, with the high-volume node located close to the current price. Moreover, the moving average wave is positioned below the current price, acting as immediate support in line with the weekly VWAP level.
In the secondary indicator window, the Traders Dynamic Index maintains a corrective stance, as the most recent line remains above the 50.00 neutral point.
Based on the current market outlook, a bullish breakout with an hourly candle above the 724.77 level could trigger a long opportunity targeting the 750.00 level.
In the price structure, the double top pattern at 724.77 requires proper confirmation through a break below the 711.00 level with a bearish candle. In that case, the price might extend its losses and find support around the 691.70 level.
Based on the current market structure, Meta stock is trading in a premium zone. Additional confirmation is needed before initiating any long positions. However, the broader market structure remains bullish, supported by strong fundamentals, which could resume the existing bullish trend and potentially lead to a new all-time high.


