
Published: February 8th, 2022
Meta Platforms Inc (FB) reported the Q4 earnings report that showed a negative sentiment regarding the new users' adoption and revenue. As a result, investors have seen the Meta stock (FB) crash 24.24% on a single day from 323.00 to 244.65 level.
The Q4 earnings report came with an adjusted EPS of $3.67, 5% down from the last year and below the expectation of $3.85. One of the key reasons for missing earnings estimation is higher expenses, although the revenue came with a 20% growth to $33.67 million.
According to Meta, the company is taking Reels to prove a fertile ground in terms of monetization, which is facing pressure from its competitor, TikTok. However, it might take some time to find the overall result from Reels as it is less potential for ad-heavy news feeds and stories.
One of the company's growth factors is its Reality Labs Division, which might show growth with metaverse through virtual reality software and headsets. Besides, the family of Apps, including Facebook, WhatsApps and Instagram, showed operating incomes of $15.9 billion. Therefore, the earnings guidance for Q1 remains with an expectation of $27- $29 billion, pointing out a 3-11% growth than the last year.
Let’s see the upcoming price direction from the Meta Stock (FB) technical analysis:
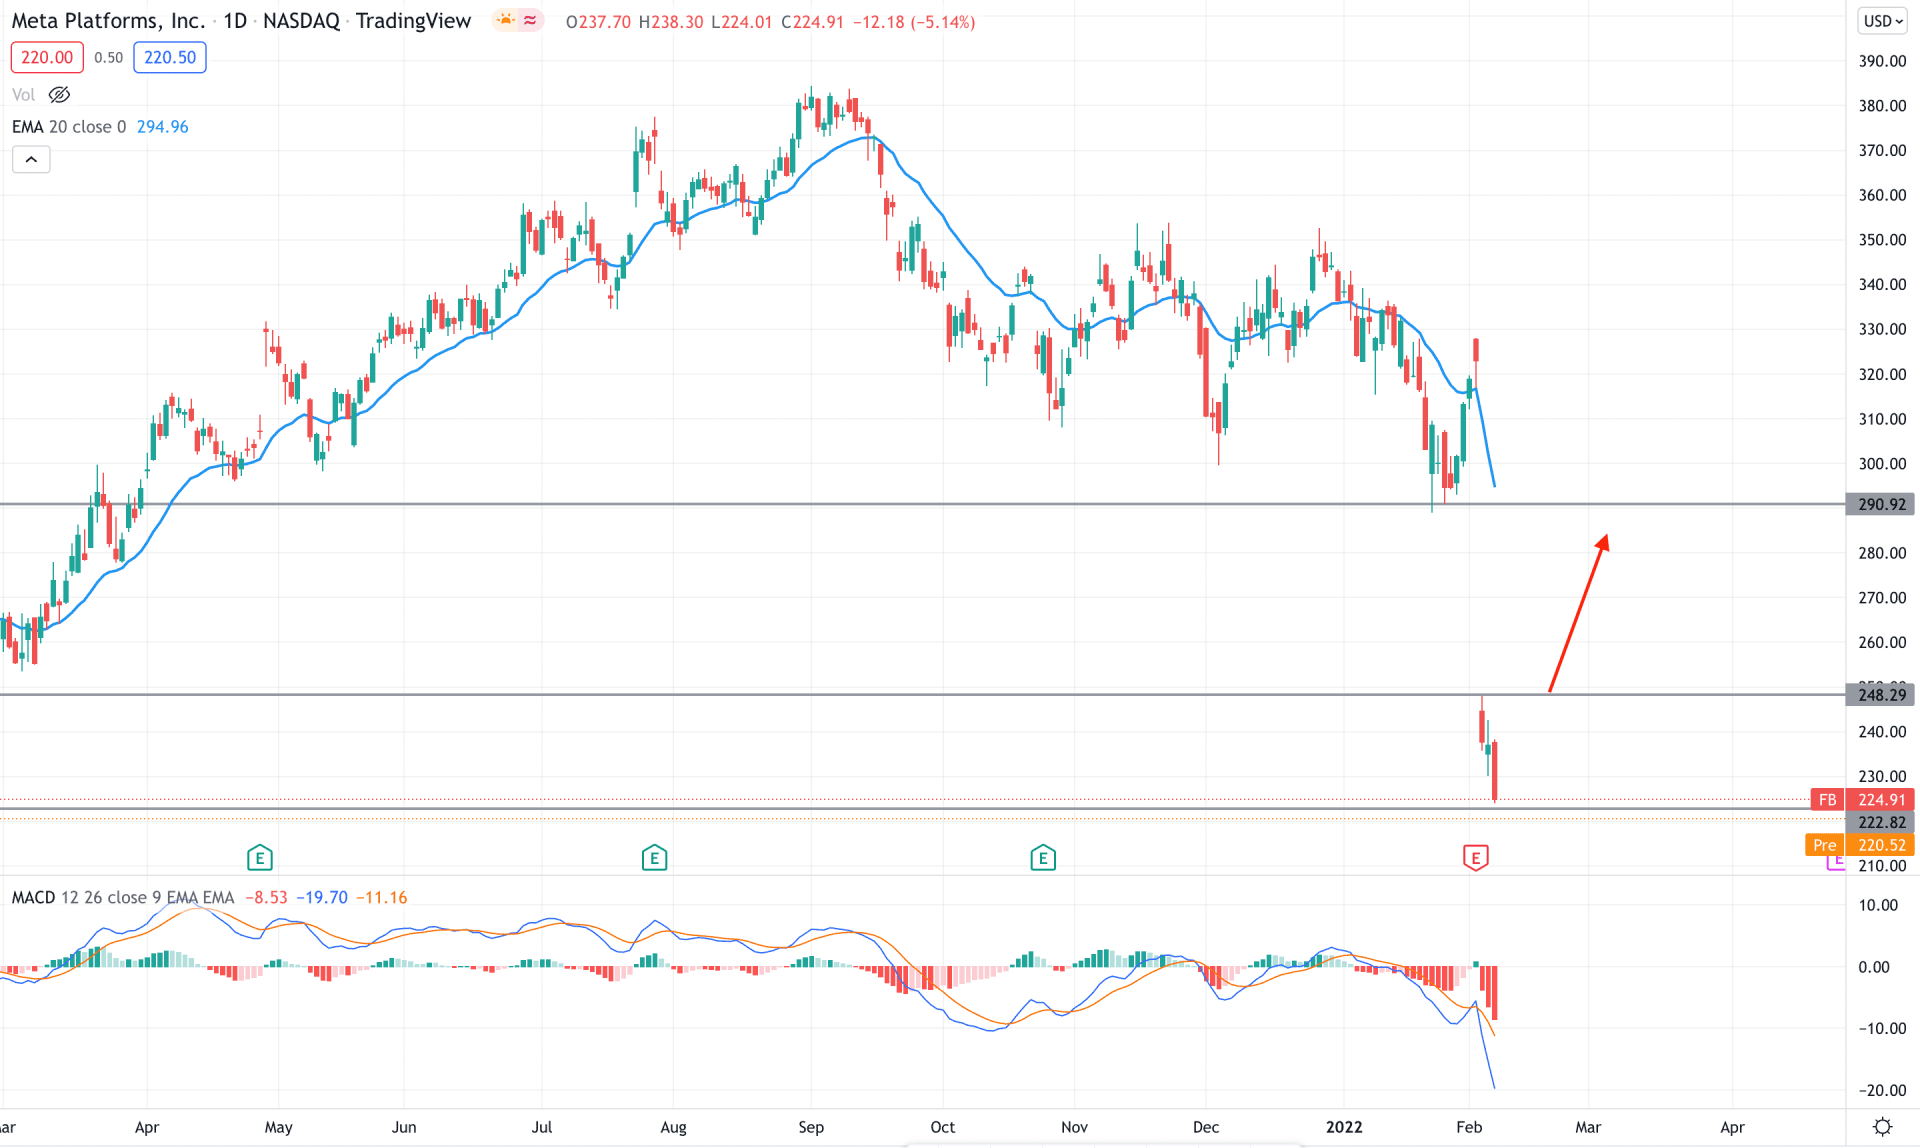
Meta Stock (FB) has a long history of providing a sustainable gain to investors, and one recent quarterly earnings miss might not eliminate the gain. Before the market crash, FB traded within a bearish channel where the price made multiple swing lows with a violation with dynamic level. As the selling pressure came with pure fundamental logic, investors should observe how the price reacts on the 248.28 level to find the upcoming price direction.
The above image shows how the gap between the dynamic 20 EMA and the price extended where the MACD Histogram remained oversold with massive selling pressure. The MACD Line shoots lower from the EMA, pointing out an extensive bearish pressure in the price. The price formed an indecision candle on the next day and traded above the 222.82 key support level.
Based on the current daily price structure, investors should observe how the price trade above the 222.82 support level where bullish rejection and a daily candle above the 248.29 would increase the buying pressure towards the dynamic 20 EMA. On the other hand, below the 222.82 level, the next support level is at 220.26.
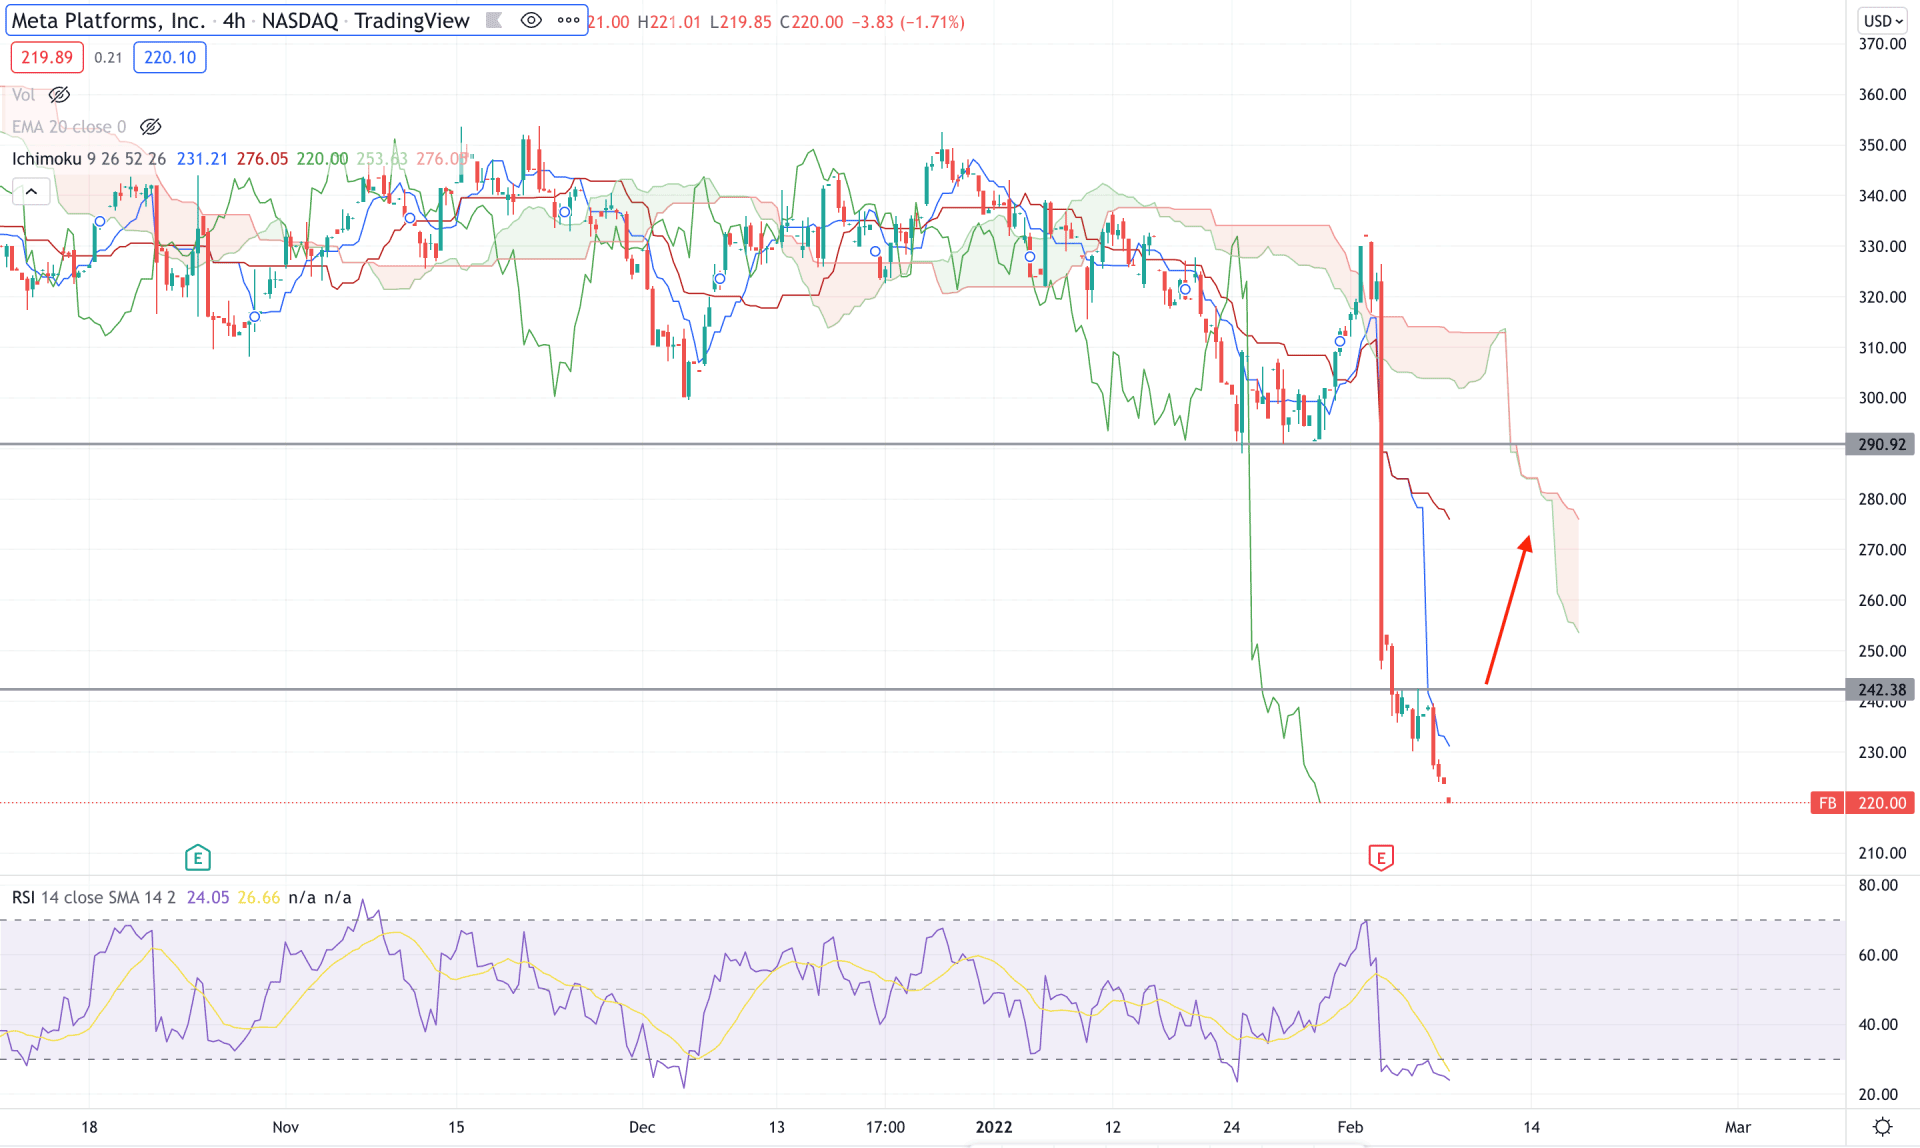
According to the Ichimoku Cloud, the Meta Stock (FB) H4 chart is trading within an intense selling pressure where the current price is below the Kumo cloud while the future cloud is highly bearish. However, the thickness of the current cloud is not substantial, indicating a pending correction towards dynamic levels.
The above image shows how the price is trading below dynamic Tenkan Sen and Kijun Sen while RSI is below the oversold 30 levels. Therefore, although a bullish correction is pending, the broader short-term direction is still bearish until the price breaches the Kumo Cloud resistance.
Based on the current market structure, a bullish H4 candle above the 242.38 level would take the price above the dynamic Tenkan Sen will increase the possibility of correction towards the 280.00 area. On the other hand, any selling pressure from the 242.38 level with a bearish rejection might open rooms for testing the 220.26 support level.
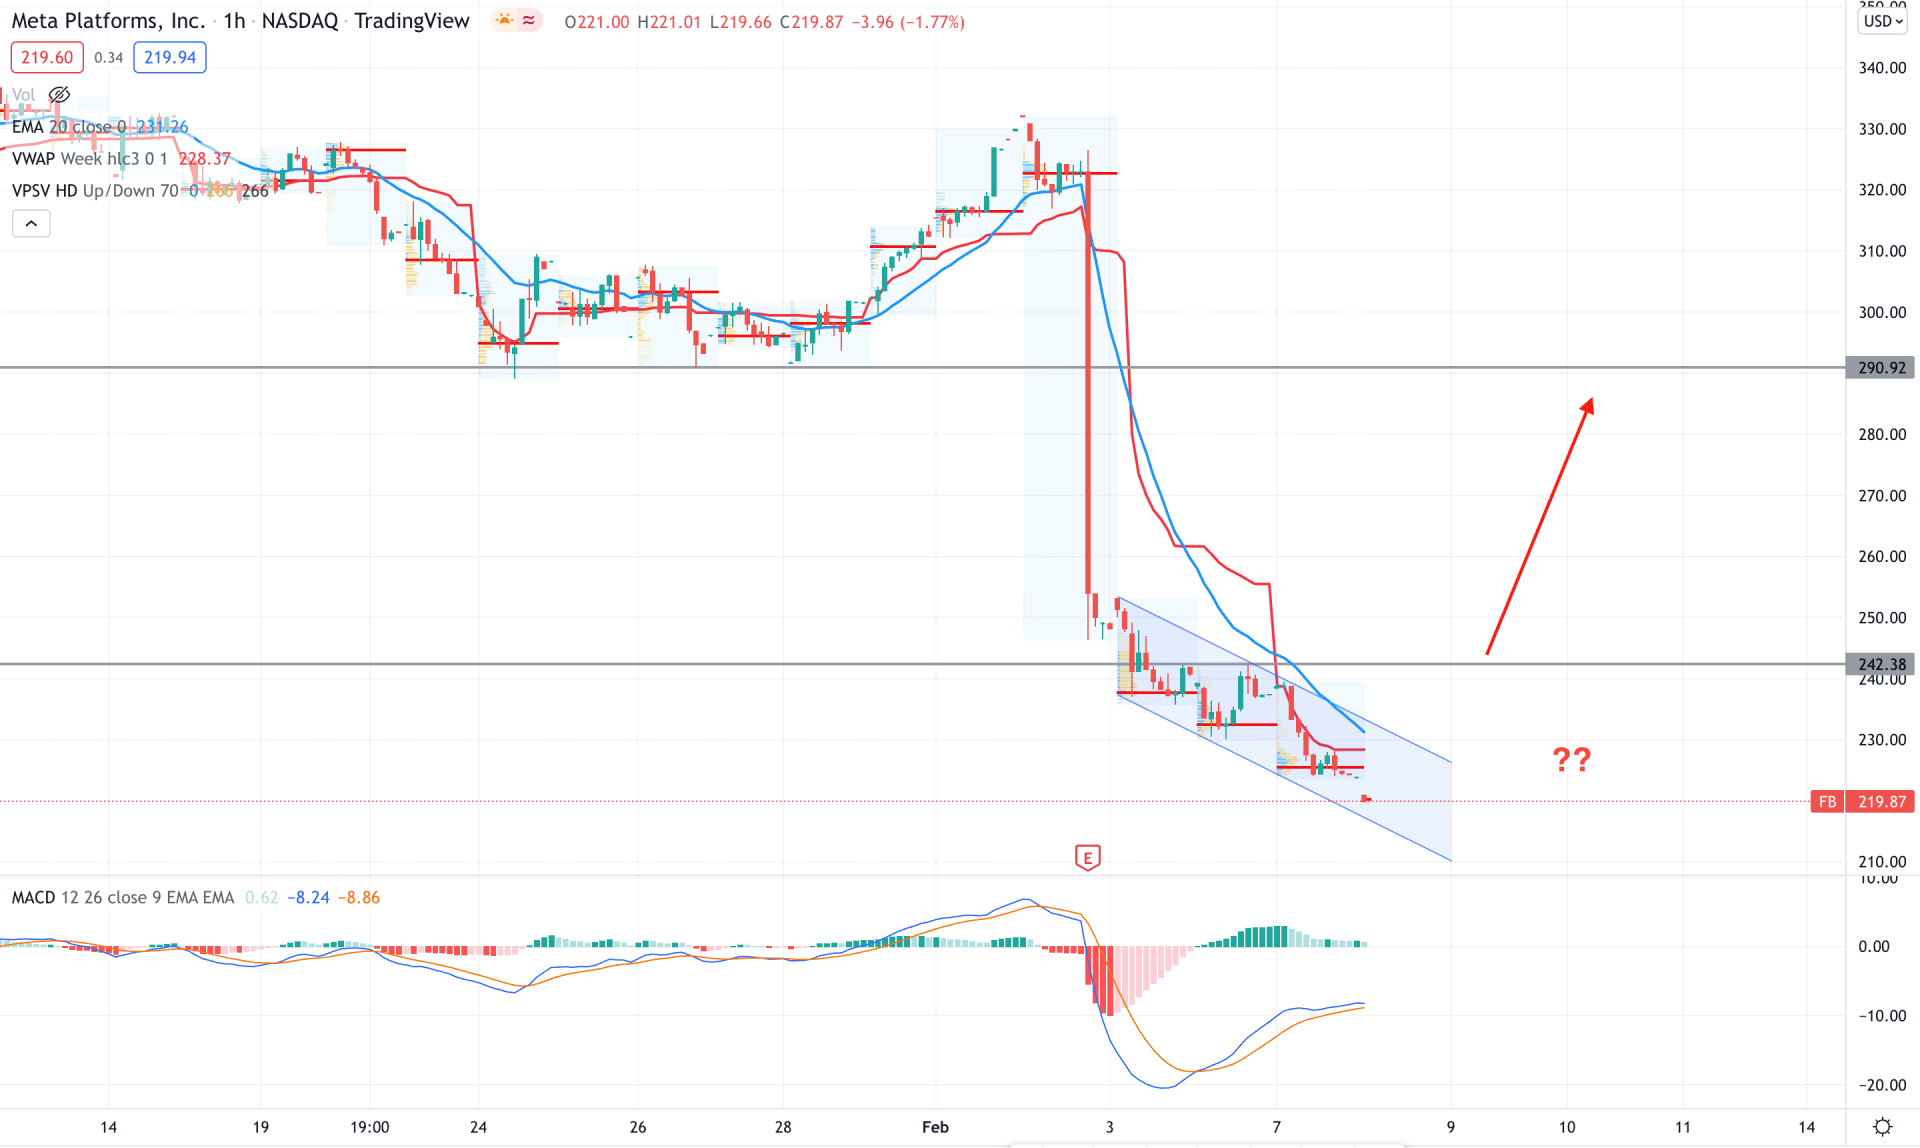
In the intraday chart, Meta Stock (FB) is trading within a bearish channel that pushed the price t remain corrective after the massive downside pressure. Therefore, the corrective movement after the selling pressure is a sign that a bullish correction is pending where investors should remain cautious about finding a reliable price direction.
The above image shows how the price trades below dynamic 20 EMA and weekly VWAP where the MACD Histogram turned bullish. Therefore, any bullish H1 candle above the dynamic 20 EMA and static 242.38 would increase the bullish possibility towards the 290.92 level. On the other hand, a bearish rejection from the 242.38 level might initiate a broader correction in the price.
As per the current market context, Meta Stock (FB) has a higher possibility of showing a bullish correction as long as the price trade is above 222.82 in the daily chart. Any bullish H4 candle above the dynamic Tenkan Sen in the H4 chart would increase the buying possibility in the coming days.


