
Published: March 15th, 2023
On Tuesday, Meta Platforms revealed plans to lay off 10,000 people, or 13% of its staff. Mark Zuckerberg's "year of efficiency" calls for this step. Meta's recruiting team will be restructured this week, with tech and business improvements planned in April and May.
In November, Meta laid off nearly 11,000 workers, 13% of the workforce. The employee layoff has worked as a bullish factor for stock as it would reduce the employment expense and increase the profit margin.
Besides, Meta will close 5,000 unfulfilled job posts. The company began testing its hybrid return-to-office approach in March 2021 and is to finish the analysis this summer.
For companies like Meta Platforms Inc, earnings growth is important, but sales growth is also important. Meta's consensus sales estimate for the upcoming quarter is $27.47 billion, down 1.6% year-over-year. Earlier, estimates of $122.01 billion and $135.76 billion for the current and next fiscal years show 4.6% and 11.3% increases.
Meta Platforms had $32.17 billion in revenues and $3 EPS in the past quarter, which is down 4.5% from the year before. Meta Platforms outperformed revenue forecasts three times and EPS estimates twice in the last four quarters.
Should you buy Meta stock now? Let’s see the upcoming price direction from the Metal Platforms Stock (META) technical analysis:
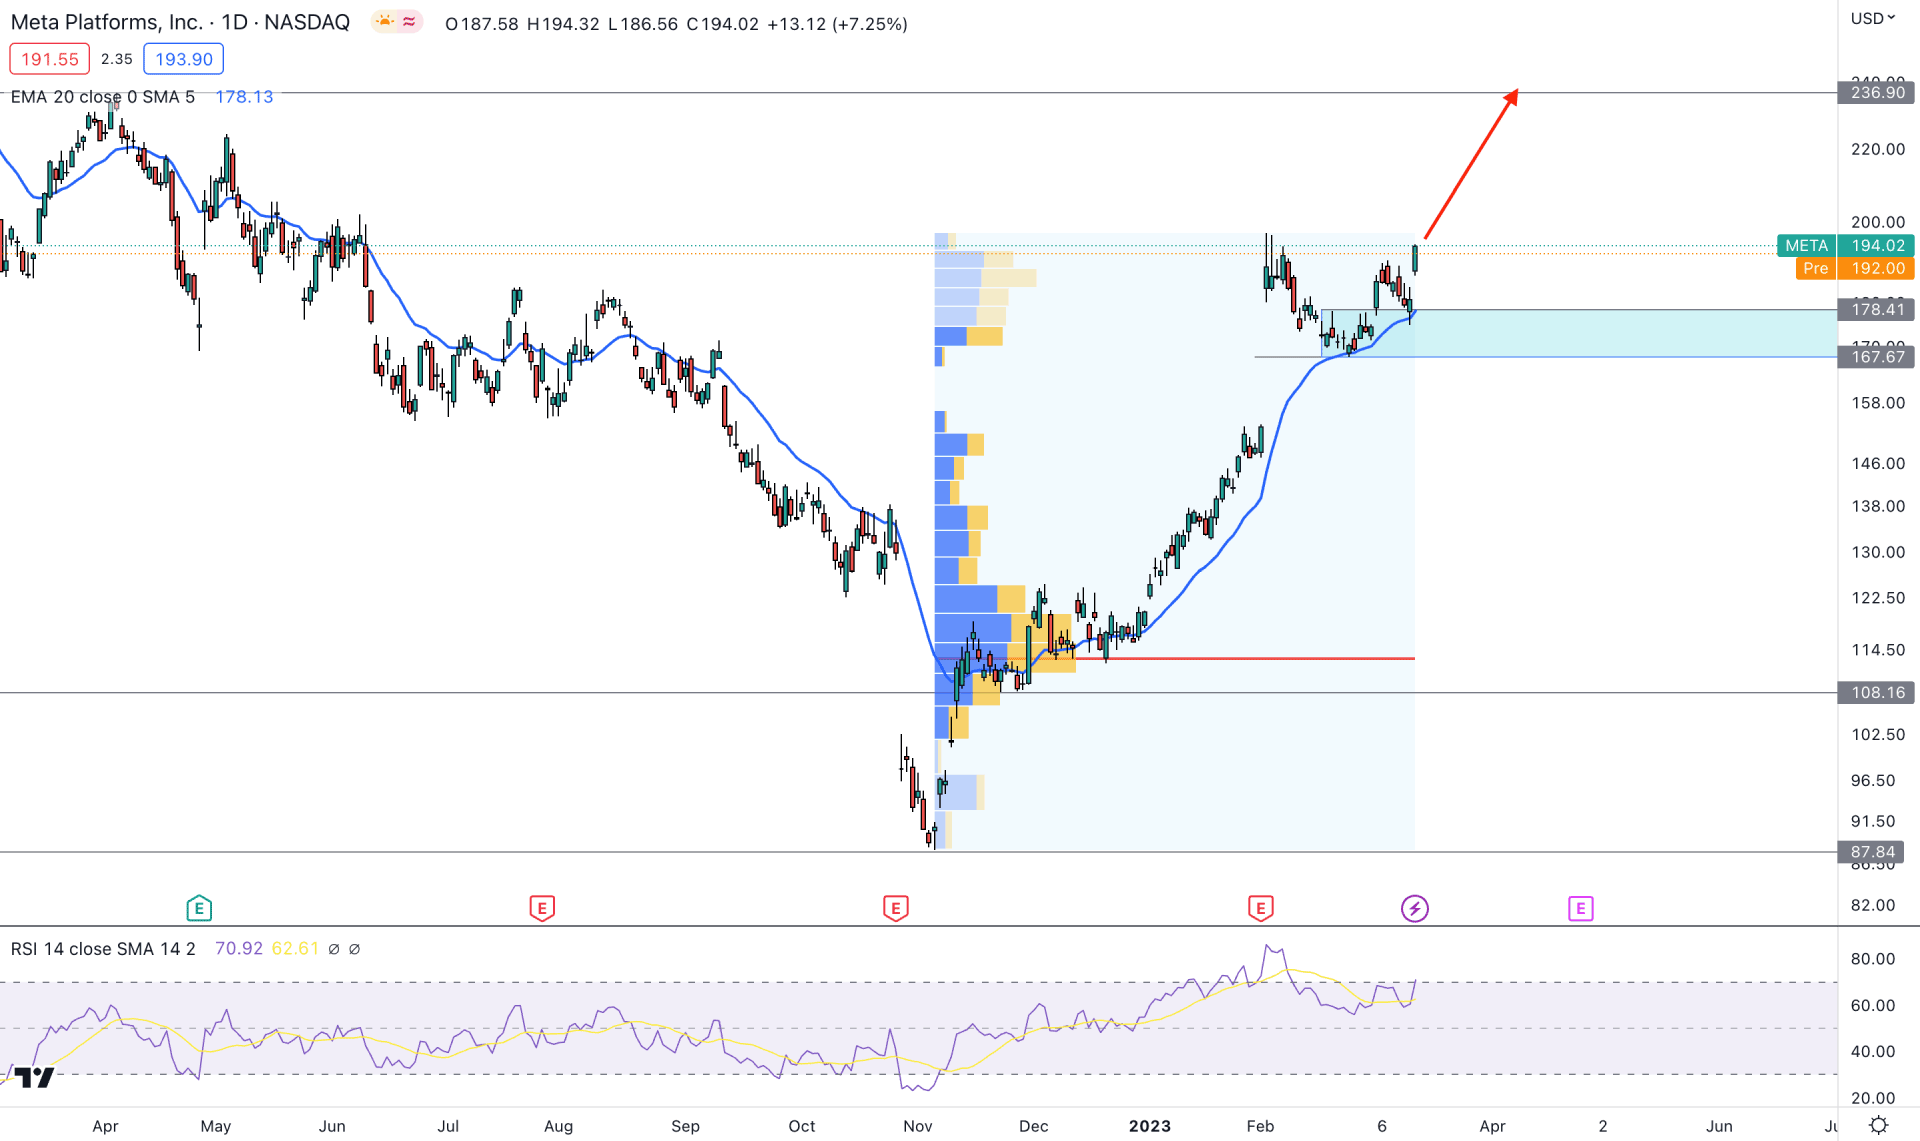
Since the META stock market crash due to a poor earnings report On October 2022, Meta stock has shown a strong rebound with a V-shape recovery. A strong earnings report supported the counter-impulsive bullish pressure, which allowed investors to rely on this instrument.
On the daily chart, a stable upside market is visible where the dynamic 20-day Exponential Moving Average is carrying the price. Moreover, the buying pressure has solid interest from institutional investors.
The high volume trading level from November 2022 to March 2023 is at 94.89 level, which is below the current price. It is a sign that institutional investors have accumulated buying positions and expect the price to move even higher from the current price.
In the indicator window, the current RSI level is stable above the middle line, which is a sign of active buying pressure in the market.
Based on the current daily price structure, a bullish trend continuation opportunity is available in this instrument. Any buying possibility from the 178.41 to 167.00 area could increase the price towards the 236.50 key resistance level.
On the other hand, breaking below the 165.00 level with a daily candle close could lower the price towards the 115.00 psychological area.
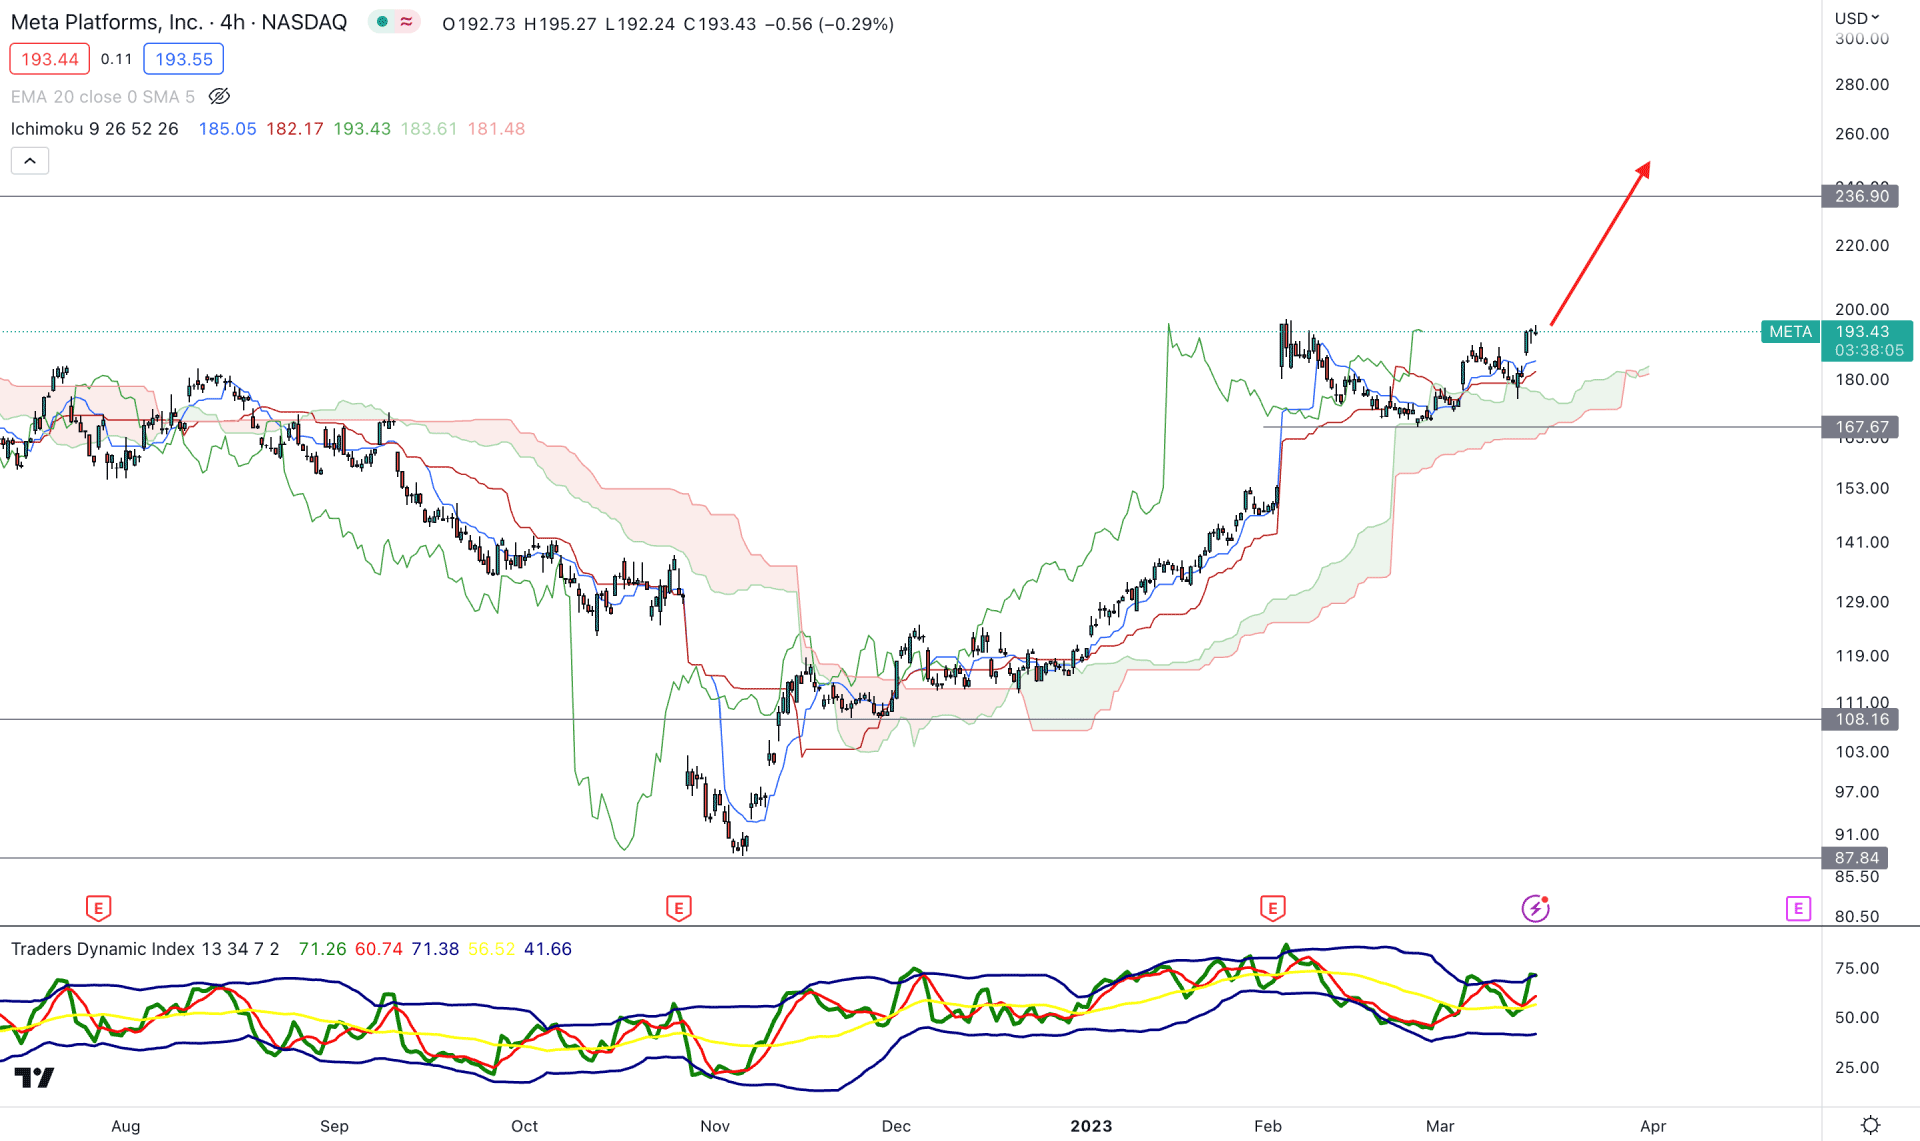
In the H4 chart, the current price is stable above the dynamic Kumo Cloud area, which is a primary sign of a strong bullish trend. In the future cloud, the position of Senkou Span A and B is also supportive of bulls, while the Lagging Span is above the current price. It is a sign that the broader bullish outlook has become stronger in this instrument, which can end up with another bullish leg.
The indicator window shows the same story, where the current Traders Dynamic Index level is above the 50.00 level. It is a sign that bulls are active in the market and can extend the momentum at any time.
Based on the H4 outlook, investors may expect the price to rise above the 250.00 area. The bullish possibility is valid as long as the price trades above the dynamic Kijun Sen support level. Breaking below the dynamic Cloud and static 167.67 support level could lower the price towards the 130.00 area.
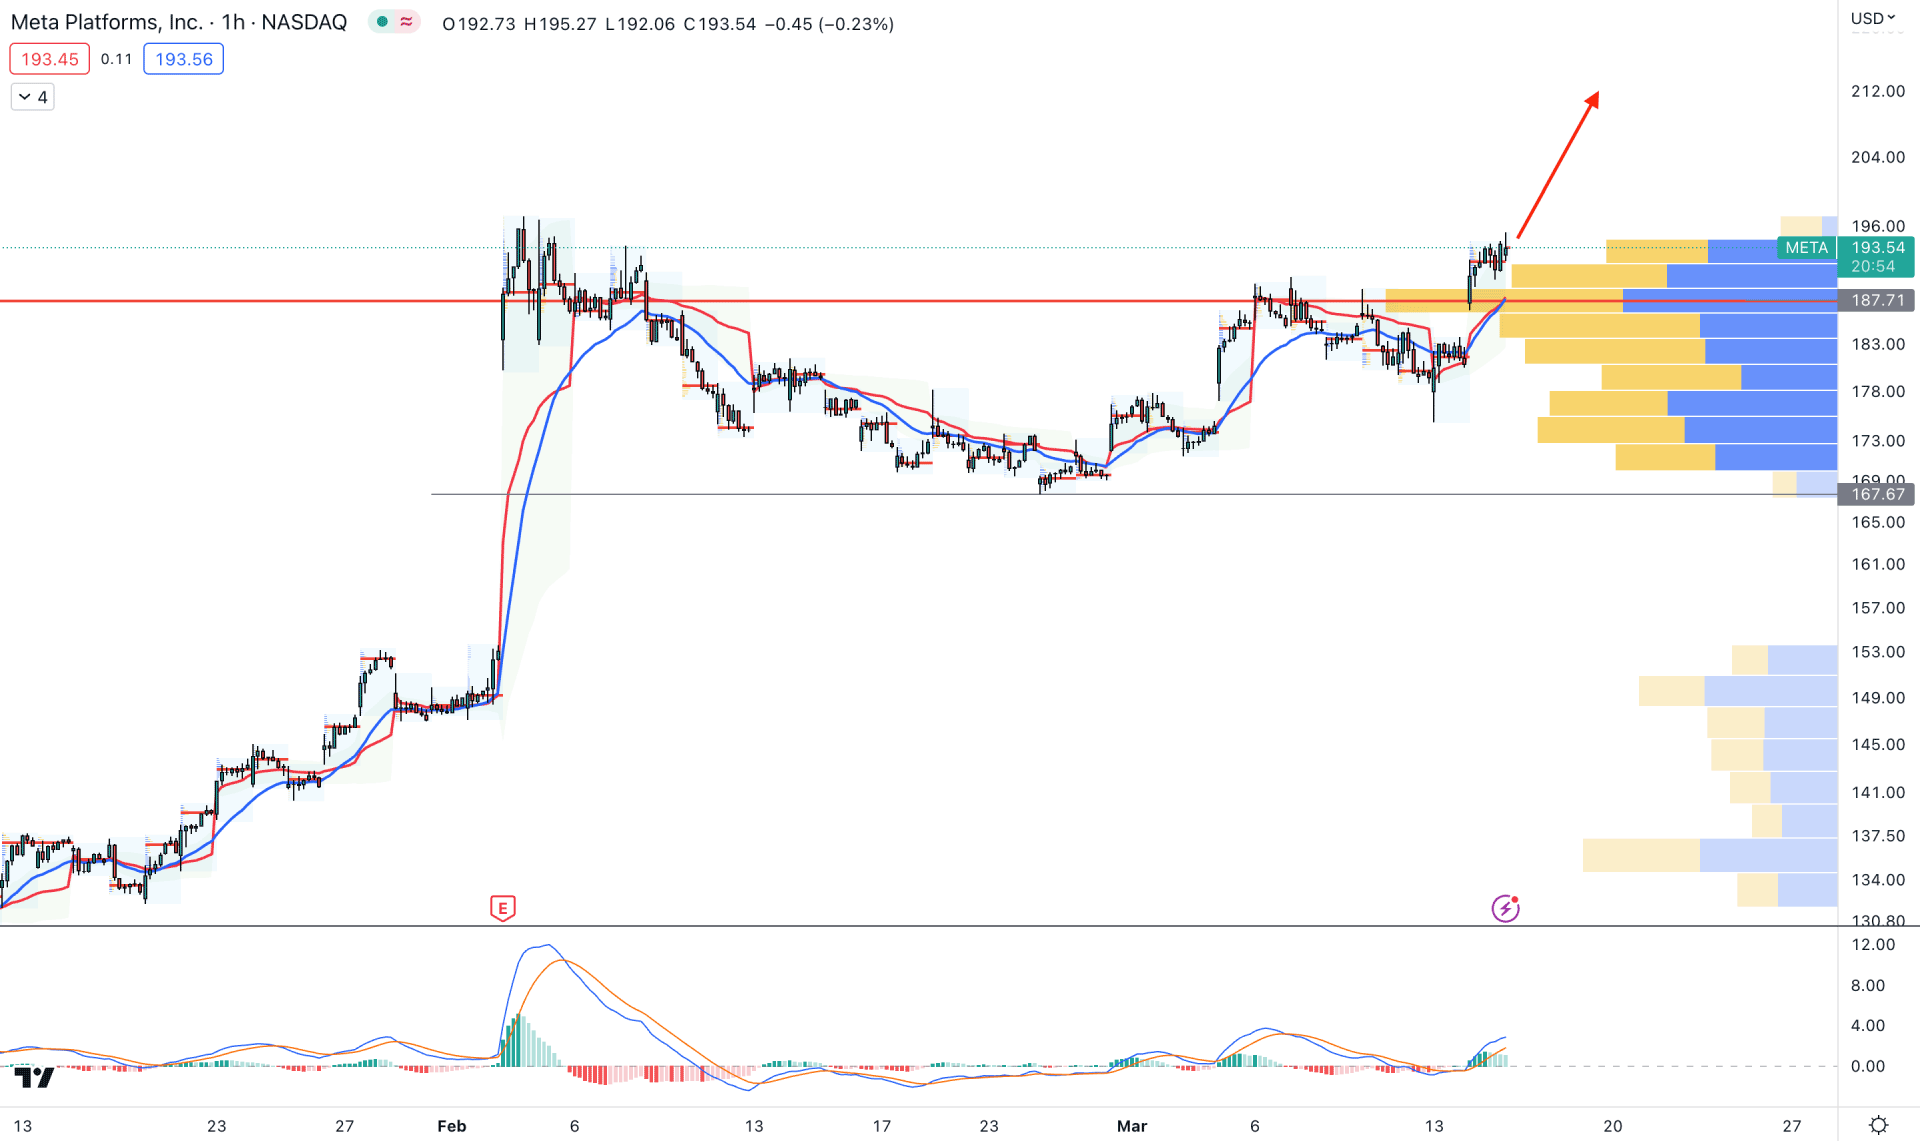
In the Hourly timeframe, the intraday outlook is extremely bullish for Meta stock as the current price is trading up by creating multiple higher highs.
The visible range high volume level is working as immediate support at 187.71 level, while the dynamic 20 EMA is providing an upside pressure.
In the indicator window, the MACD Histogram is bullish, while MACD lines are pushing higher with a buying momentum.
Based on the H1 outlook, investors should closely monitor how the price trades at the 20 EMA support. Any bullish rejection with an H1 candle could increase the price in the coming hours.
The alternative approach is to wait for the price to come below the 168.00 level, from where a bearish momentum may come.
Based on the current findings, Meta stock is more likely to increase in the coming hours. Investors should closely monitor near-term support levels to find the best area to buy. However, multiple violations of the H4 Kijun Sen support could be an alarming sing to bulls, which may indicate an extensive bearish correction.


