Published: July 31st, 2024
Following the bell on Wednesday, investors will be observing Meta Platforms (META) for information on its artificial intelligence (AI) plans and the strength of its advertising revenue after the company recently announced its AI model. Meta Platforms is scheduled to report its second-quarter revenue.
Analysts estimate that the parent company of Facebook and Instagram will announce revenue of $38.35 billion, up roughly 20% from last year. Net income is anticipated to reach $12.31 billion, or $4.71 each share, a 58% increase over the same quarter last year.
When Meta reports its second-quarter ad revenue, analysts at Citi predict that it will reach $37.95 billion, up 20.5% from last year. The company attributes this growth to adopting Instagram Reels, new advertising products, and a stronger ad environment.
On the other hand, Meta Platforms Inc. has received its first fine from the European Union due to accusations that it exploited its market leadership in the classified ad industry by connecting Facebook Marketplace to its social network.
According to people who understand the situation, Facebook may be told by European Commission authorities that it must develop a different version of its classified ads platform as part of the impending EU order, which is expected to be issued in the upcoming months. By doing this, users could access Facebook Marketplace without going via the social media network.
Let's see the upcoming price direction from the META technical analysis:

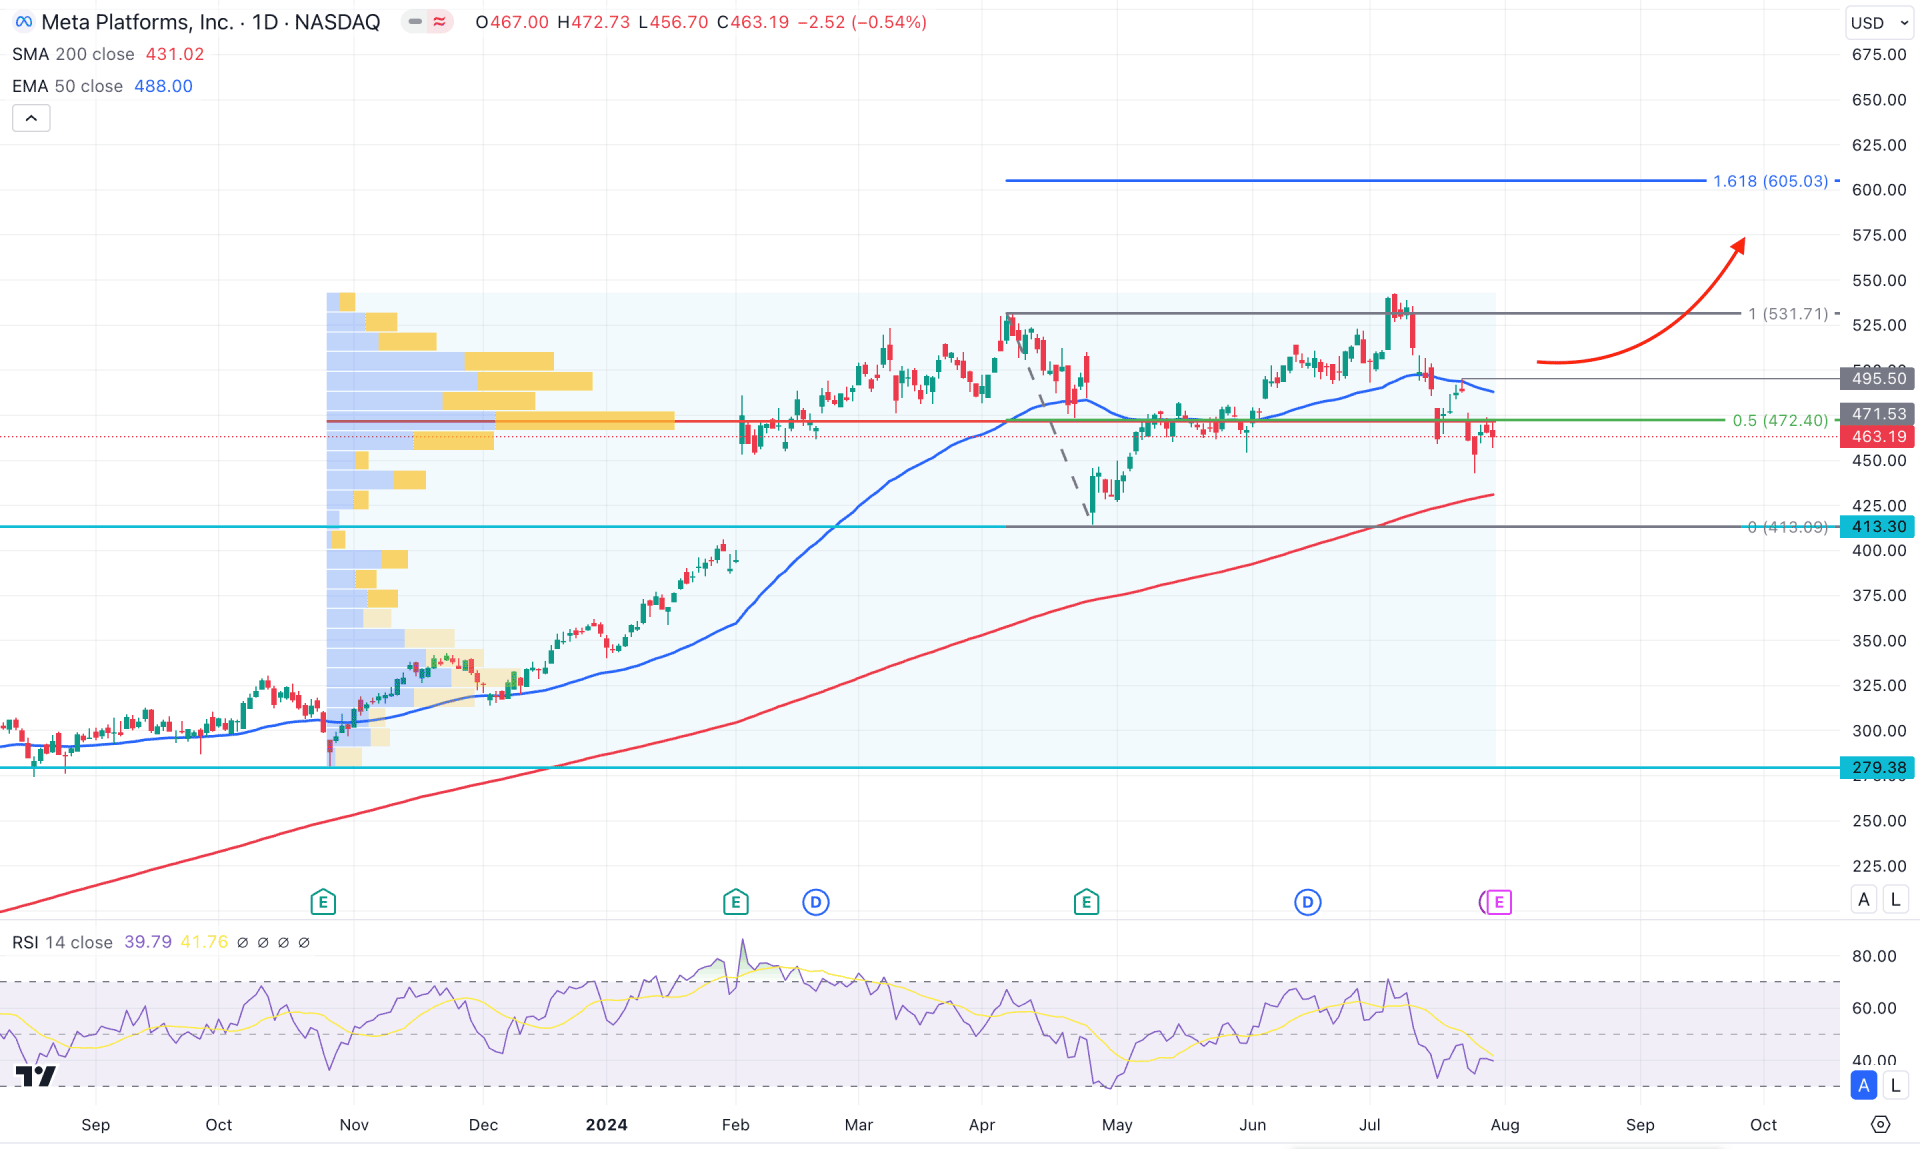
In the daily chart of META, an existing bullish trend is visible, while the price action for the last six months shows a corrective price action. Even if the downside pressure came in April, the price rebounded immediately but failed to show a stable momentum above the existing high of 531.71 level.
In the higher timeframe, the broader market context is sideways, with a potential bearish outside bar candlestick formation in the monthly chart. The outside bar candlestick at a swing high is a potential bearish reversal signal, which a valid price action might validate. However, the weekly price suggests indecision as the previous weekly support of 413.30 is still protected.
In the volume structure, the corrective momentum is clear, where the current high volume line since November 2023 is at 471.53 level, which is just above the current price. In that case, a valid bearish reversal from this zone, could be the primary sign of a possible bearish reversal in this stock.
In the main chart, the recent price shows a stable downside pressure below the 50-day Exponential Moving Average, while the 200-day SMA is still protected. Moreover, the Relative Strength Index (RSI) is hovering below the 50.00 line, signaling a downside continuation.
Based on the daily market outlook, the ongoing buying pressure could resume after overcoming the price above the 50-day EMA line. In that case, a daily candle above the 495.50 resistance level could extend the upward pressure at the 605.03 level, which is a 161.8% Fibonacci Extension level.
The alternative approach is to look for a failure to break above the 531.71 level with a bearish daily candle below the 50-day EMA, which could be the first bearish scenario. On the other hand, any immediate bearish continuation with a stable bearish momentum below the 413.00 static line could be a continuation opportunity, aiming for the 279.38 static support level.

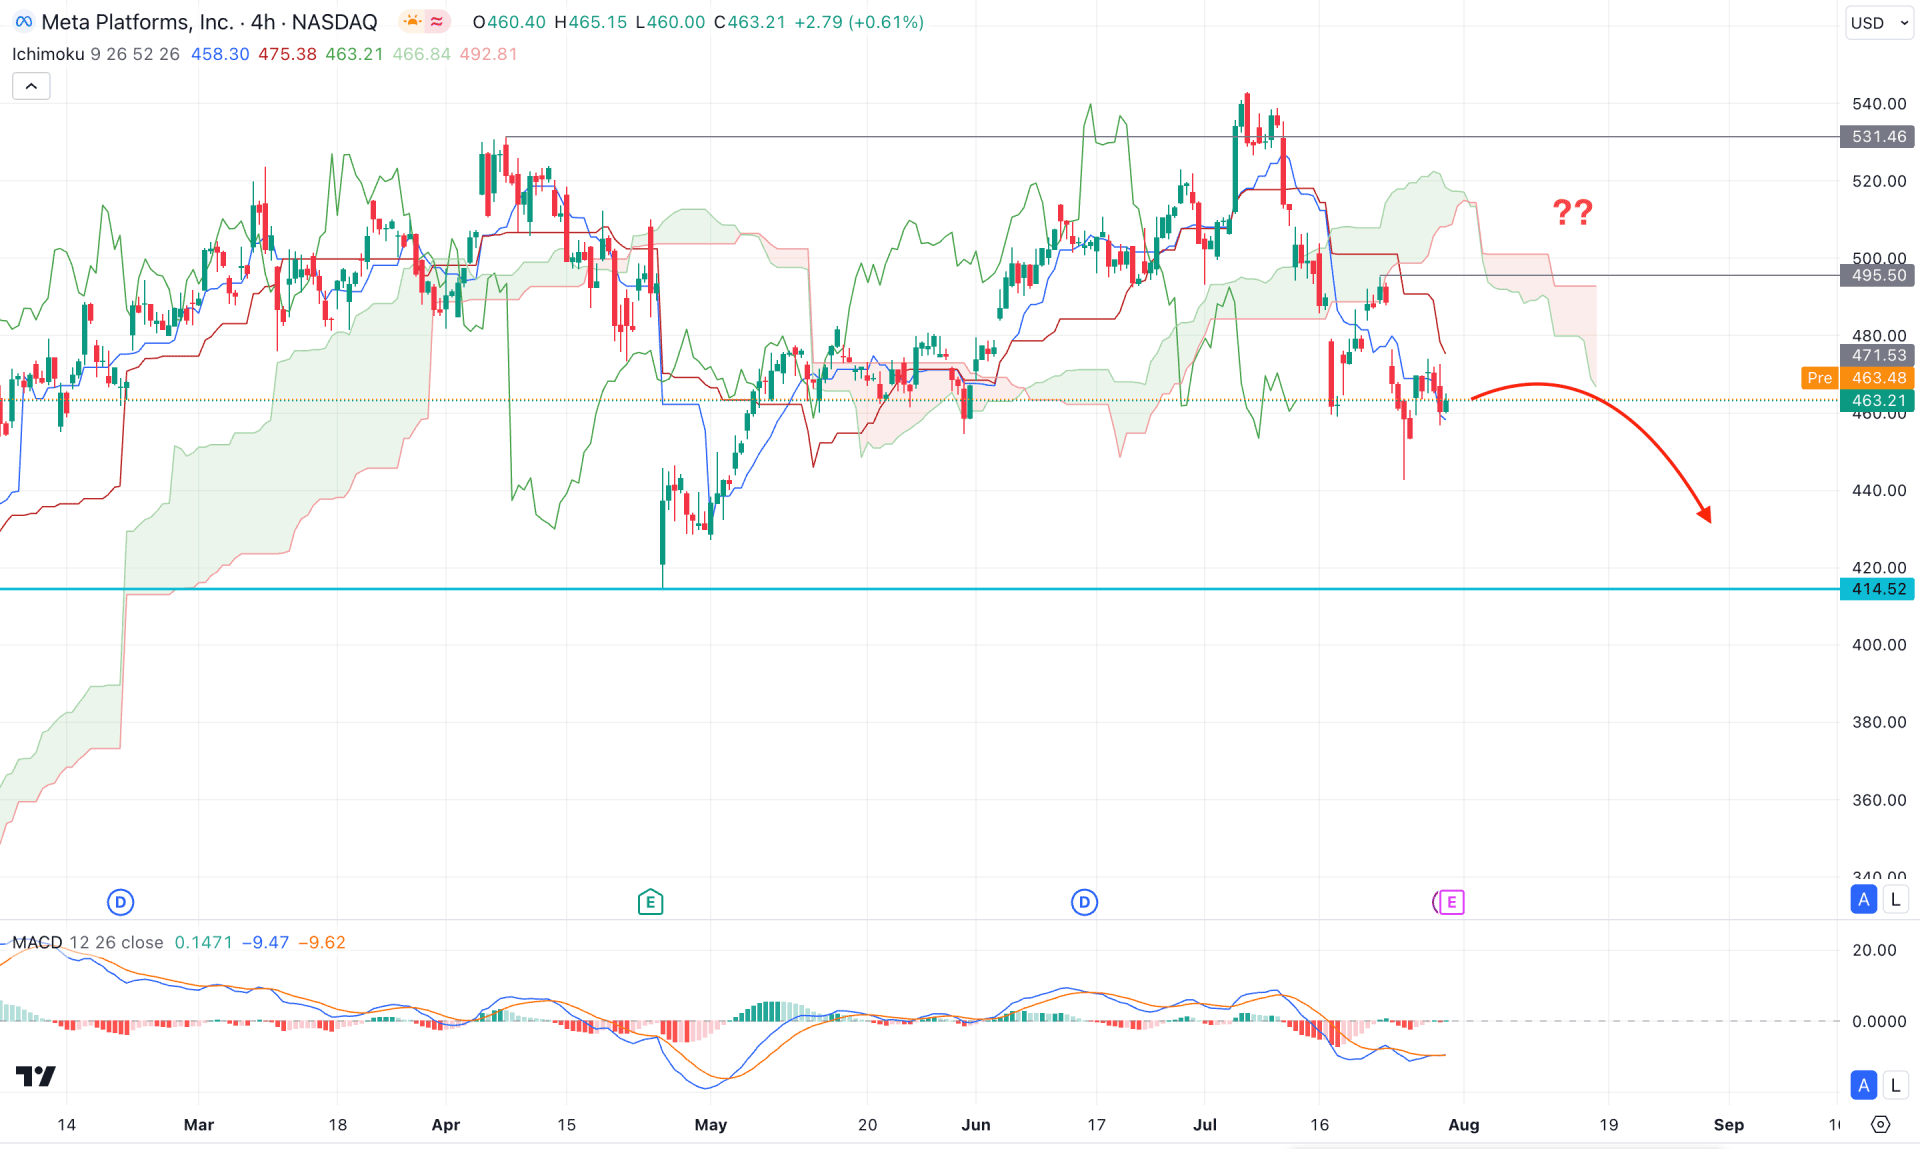
In the H4 chart, the recent price trades below the Ichimoku Cloud zone, suggesting a potential bearish continuation opportunity. Moreover, the future cloud is bearish, where the Senkou Span A is below the Senkou Span B.
In the secondary window, the MACD divergence is visible, where the signal line failed to follow the momentum shown in the daily chart. Moreover, the Histogram remained sideways at the neutral area, from which a potential breakout could happen.
Based on the H4 market structure, any minor upward correction could offer a potential bearish opportunity after valid price action from the dynamic Kijun Sen level.
On the other hand, a bullish breakout is possible, from where a daily candle above the 495.00 level could signal a bullish continuation, aiming for the 600.00 area.

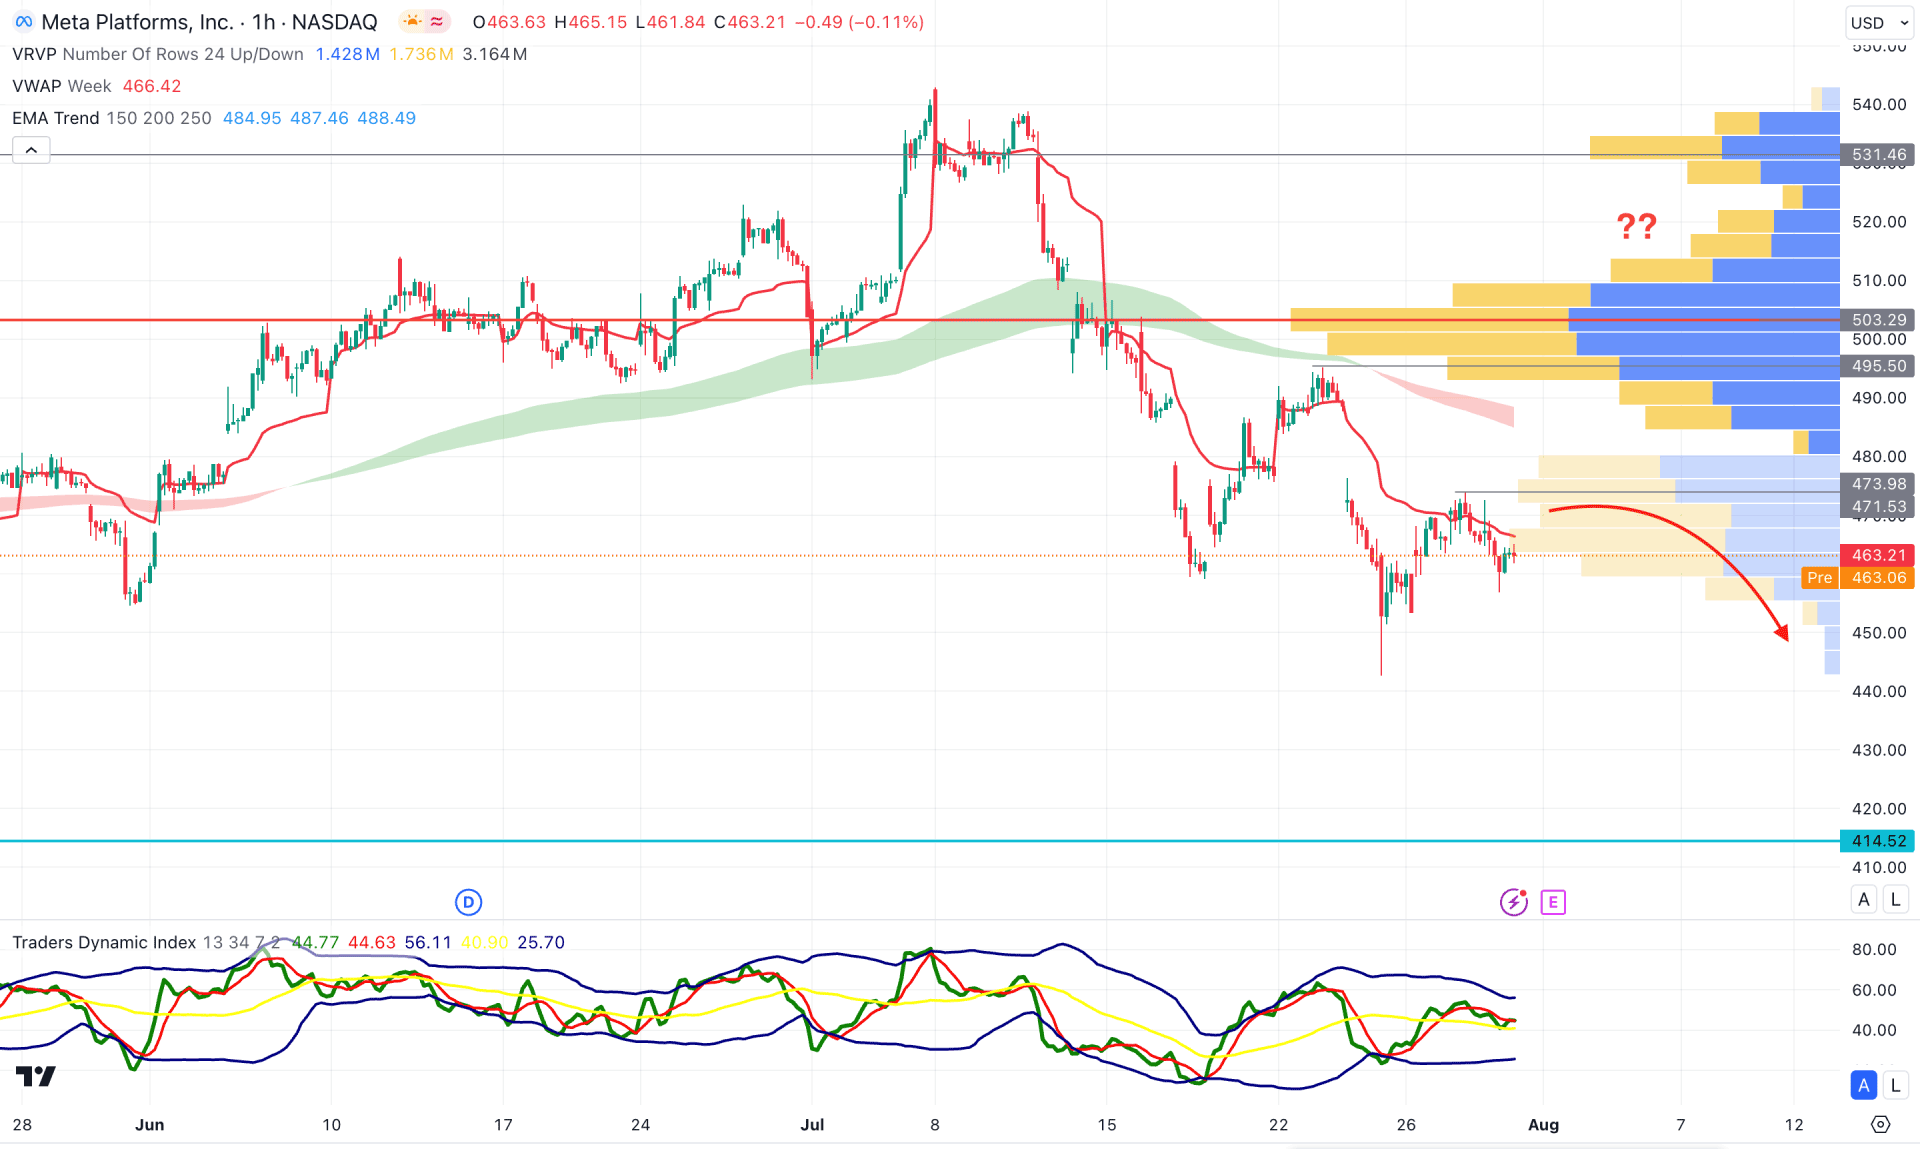
In the hourly chart of META, an existing bearish pressure is visible as the current price hovers below the visible range high volume line. Moreover, the EMA wave consists of MA 150 to 250, which remains bearish, working as a confluence of bearish pressure.
In the indicator window, the Traders Dynamic Index (TDI) remains above the mid-point, suggesting a bottom formation at the 442.75 level.
In this context, a bearish continuation needs a valid reversal from the 473.98 to 500.00 zone, which might open room for reaching the 414.00 area.
On the other hand, any immediate bullish reversal above the 503.29 high volume line could validate the long-term bullish opportunity, aiming for the 600.00 psychological line.
Based on the current market outlook, META is more likely to show a decent recovery following the candlestick pattern in the monthly timeframe. Investors should closely monitor how the price closes the month along with the earnigns reports to gauge the future price.