
Published: October 4th, 2023
Merck's (NYSE: MRK) stock has declined by 6.3% over the past three months, making it difficult to be enthusiastic about its recent performance. Nevertheless, stock prices typically reflect a company's long-term financial health; in this instance, Merck's finances appear quite healthy. Today, we will examine Merck's Return on Equity (ROE).
ROE, or Return on Equity, is crucial for determining how well a company's management utilizes its capital. Essentially, ROE indicates the amount of profit generated per dollar of shareholder investments.
Merck's ROE is calculated to be 8.1% using the formula $3.1 billion divided by $39 billion (based on the trailing twelve months ending in June 2023).
Merck's ROE may not appear particularly attractive at first glance. The company's ROE is not competitive with the industry average of 22%, as revealed by a closer examination. Merck has nevertheless managed a respectable 17% net income growth over the past five years. Additional factors may be at play, such as the company's management making sensible strategic decisions or a low payout ratio.
Merck's median payout ratio over the past three years is 64%, indicating that it retains 36% of its profits. Despite this, the company has experienced substantial earnings growth in the past. This demonstrates that the company's high payout ratio has not hindered its capacity for growth.
In addition, Merck has consistently distributed dividends for at least a decade, demonstrating its dedication to distributing profits to shareholders. According to the latest analyst consensus data, the company's future payout ratio is anticipated to decrease to 38% in the next three years. Consequently, this anticipated reduction in the payout ratio explains the anticipated increase in ROE for the same period to 38%.
Let’s see what the company offers in terms of technical analysis:
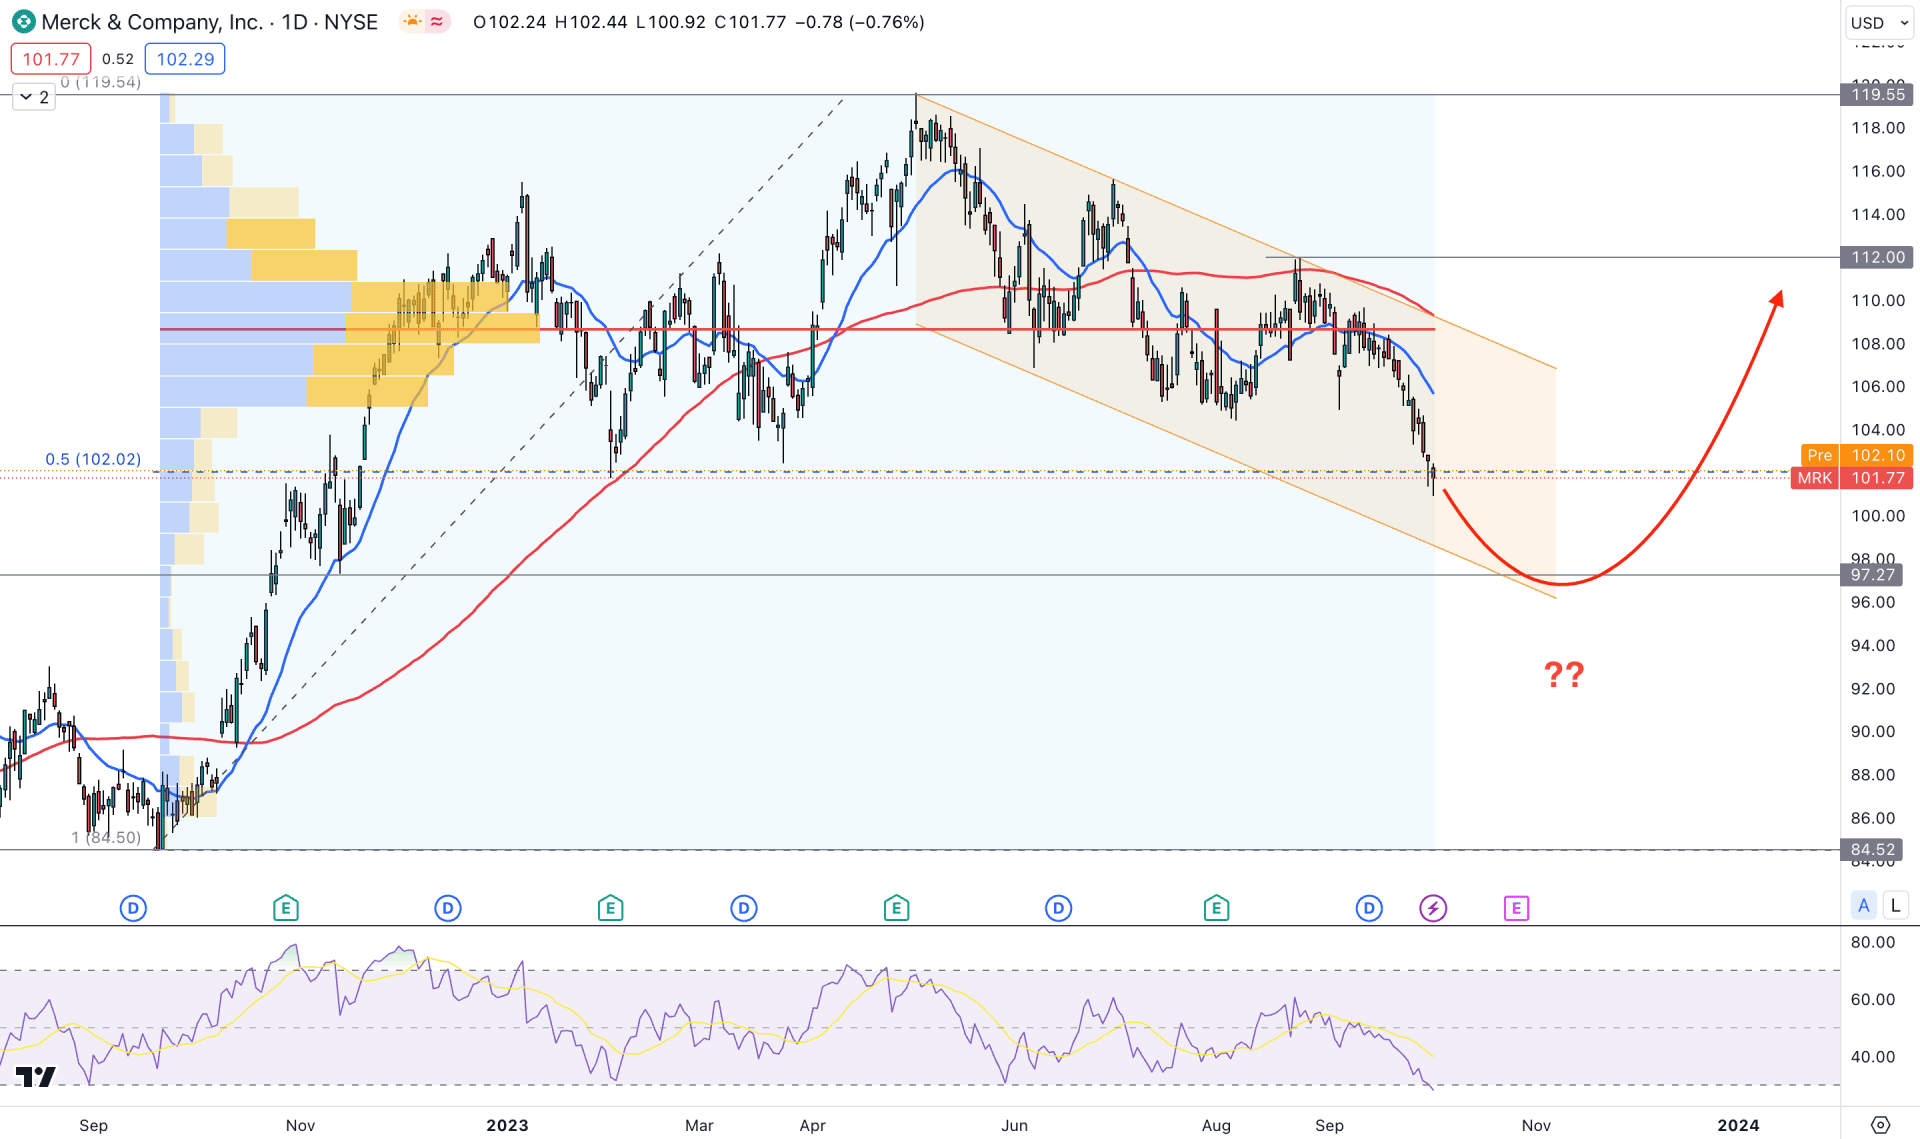
In the daily chart of Merck & Co stock (MRK), the overall market momentum is bullish. However, the recent corrective downside pressure could indicate sellers presence in the market with no confirmation of the bearish trend reversal.
Volume plays a crucial role in stock trading, where the current high volume level since September 2022 low is at 108.67 level, which is 6.62% above the current price. As bulls failed to hold the price above the high volume level, we may consider that the profit-taking is still active in the market.
In the higher timeframe, the monthly candlestick shows a bearish continuation for three consecutive candles but found support at the 20-month SMA level. Moreover, the weekly RSI turned bearish below the 50.00 line, with a downside possibility at the 30.00 overbought level.
In the daily price outlook, the recent bearish correction within the descending channel indicates a minor sellers presence in the market. However, the countertrend momentum reached the discounted zone from the 119.55 high to the 82.50 low, as the 50% Fibonacci Retracement level is at 102.02 level. Moreover, the recent bearish pressure took the price below the critical horizontal level at 102.46, indicating a sell-side liquidity sweep.
In the current swing, the 161.8% Fibonacci Extension level from the 104.46/ 112.00 area is at the 99.80 level, which could be the current target level of the bearish pressure.
The 14-day Relative Strength Index is already at the oversold zone, while the 20 and 100-day SMA are above the current price.
Based on this outlook, the first bullish opportunity might come from the 98.00 to 90.00 area with a daily candle above the 20-day EMA level. On the other hand, a sharp downside pressure and a daily close below the 90.00 psychological level could lower the price towards the 70.00 area.
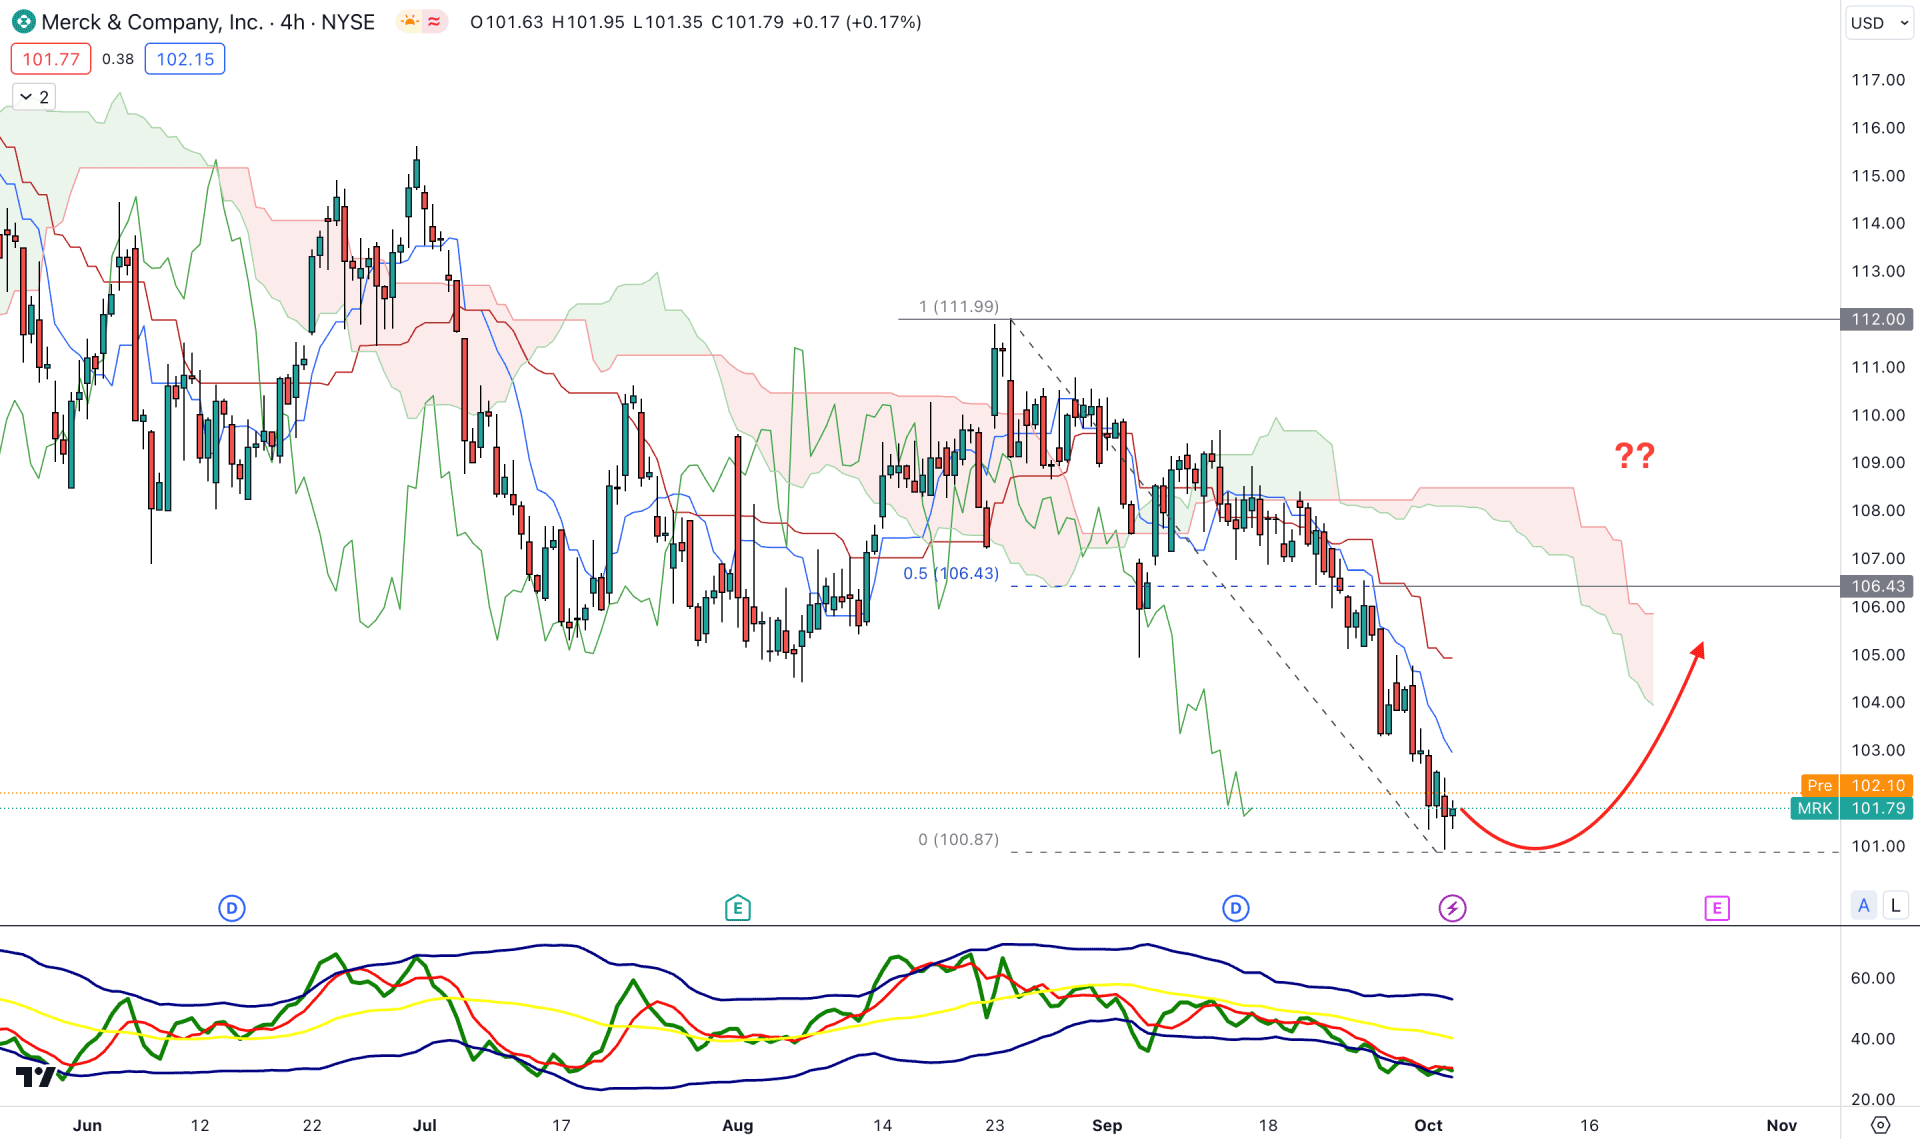
In the H4 chart, the overall market pressure is bearish as the recent price trades below the Ichimoku Kumo Cloud after a consolidation. Moreover, the Senkou Span A and B move downward in the future cloud, which suggests a bearish continuation opportunity.
In the secondary indicator section, the Traders Dynamic Index (TDI) shows an extreme bearish pressure as it remains below the lower band area. It is a sign that an upward correction is pending until the TDI level reaches the 50.00 line.
Based on this outlook, a bullish correction is pending in this stock and a valid bearish rejection from the 106.43 or dynamic Kijun Sen could lower the price below the 100.00 psychological level.
On the other hand, a counter-impulsive bullish momentum is needed with a stable market above the Ichimoku Cloud zone before targeting the 116.00 swing high.
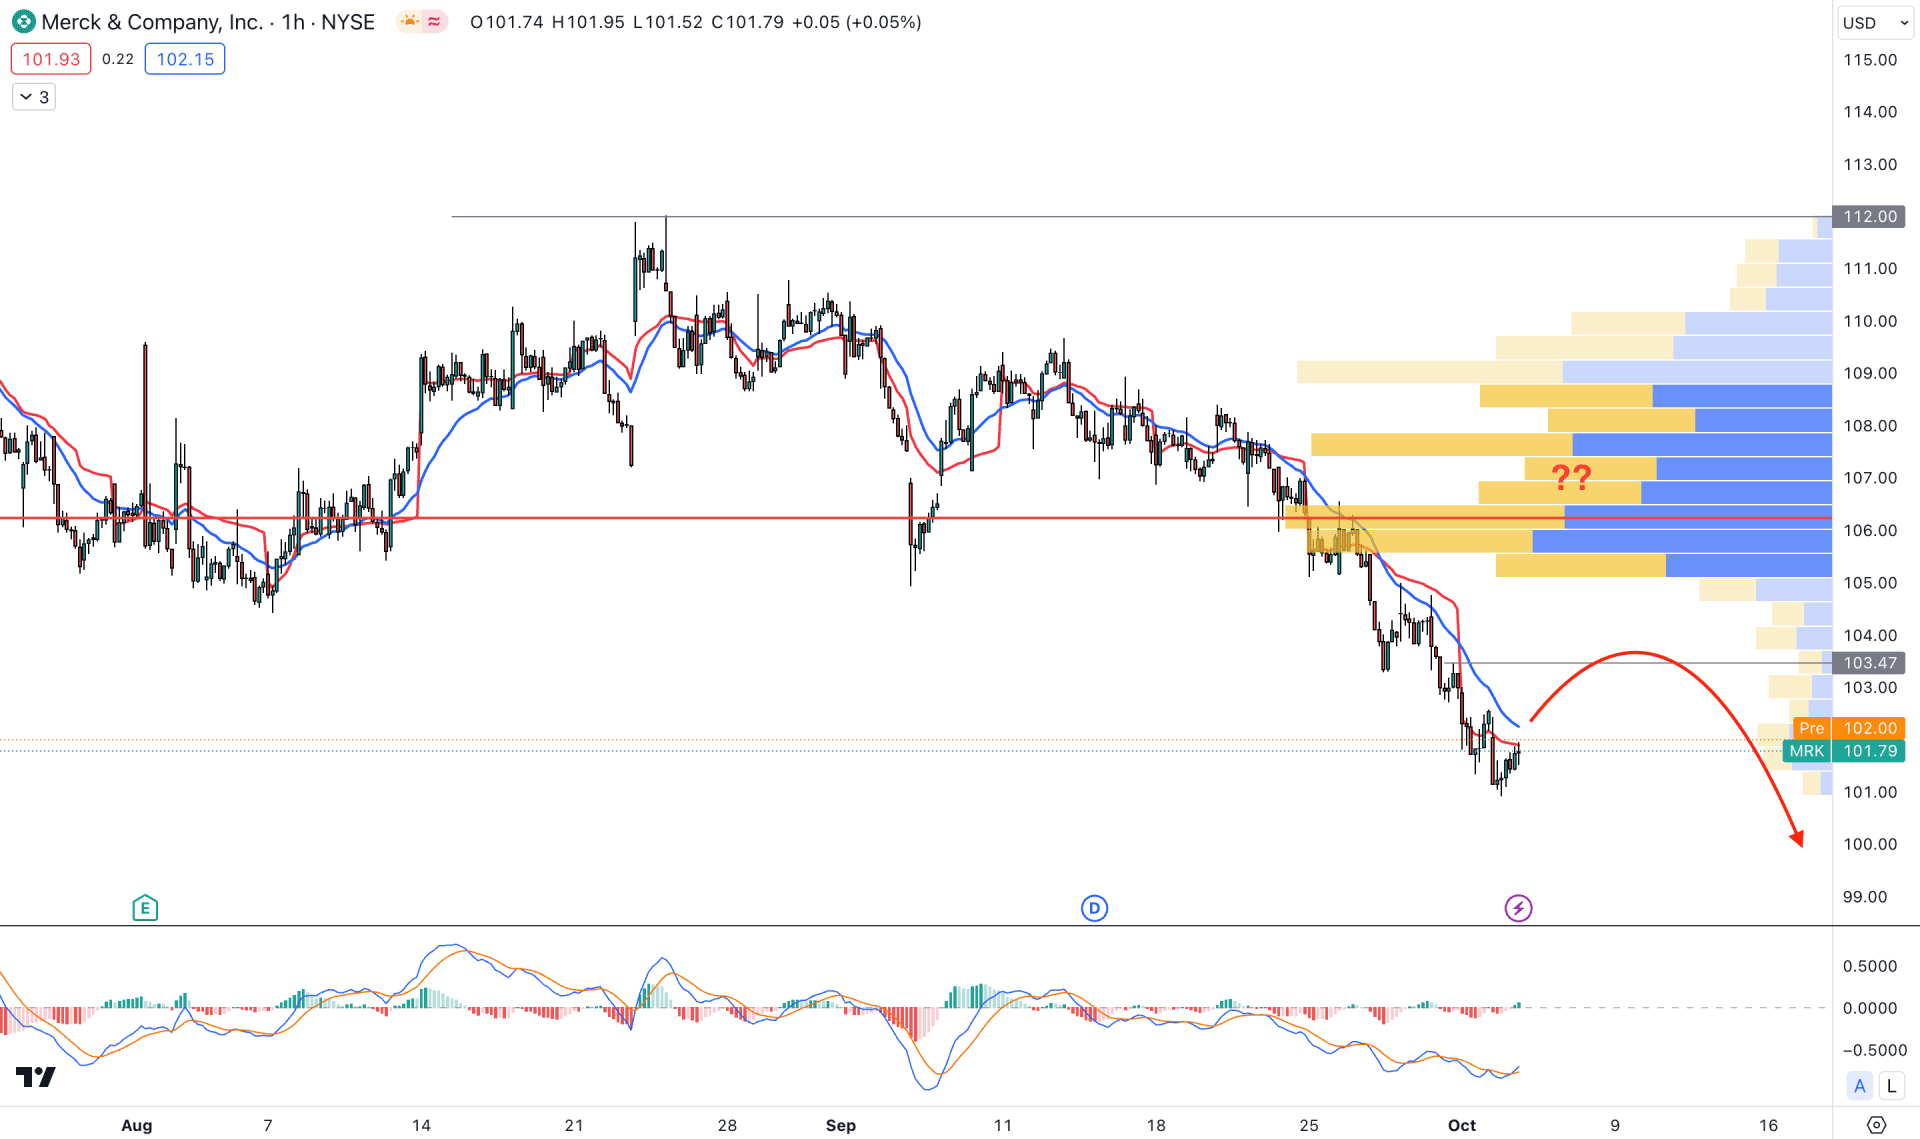
In the hourly MRK chart, the overall market pressure is bearish, where the current price trades below the visible range high volume level. In that case, a bullish recovery needs a solid price action above the high volume level before anticipating a trend change.
In the indicator window, the MACD Histogram turned bullish, while the current MACD Signal line shows a bullish crossover at the negative zone.
Based on the intraday chart, the bearish possibility is solid as long as the price trades below the near-term high volume level. A bearish reversal with an H1 candle close below the 105.00 to 103.00 area could be a short opportunity targeting the 95.00 level.
Based on the current multi-timeframe analysis, the MRK stock could see a bullish continuation after reaching the bearish overextension level, as marked in the daily chart. However, the current bearish momentum is solid in the intraday chart, which could result in a trend change after exhaustion.


