
Published: May 16th, 2024
The prevailing consensus earnings estimate for MercadoLibre for the current fiscal year is $34.28, which signifies a significant 76.2% growth compared to the previous year. This figure was last updated one month ago and now stands at $34.28. In anticipation of the forthcoming fiscal year, the consensus estimate of $48.55 indicates an additional 41.7% expansion compared to the previous year, following a recent downward adjustment of -3%.
Although earnings growth is a critical metric, a company's financial health depends on sustained revenue growth. The anticipated quarterly sales figure for MercadoLibre is $4.24 billion, representing a significant year-on-year growth of 24.2%. The projected expenditures for the current and subsequent fiscal years are $21.82 billion and $17.7 billion, respectively, corresponding to respective growth rates of 22.3% and 23.3%.
During the most recent quarter for which data is available, MercadoLibre produced $4.33 billion in revenue, representing a significant increase of 42.7% compared to last year. Earnings per share (EPS) rose to $6.78 from $3.97.
It is worth mentioning that the revenues reported exceeded analysts' expectations by 9.86%, and the EPS exceeded expectations by 2.11%. MercadoLibre consistently surpassed revenue expectations during the previous four quarters and outperformed consensus EPS estimates in three instances.
Should you include this stock in your portfolio? Let's see the complete outlook from the MELI technical analysis:
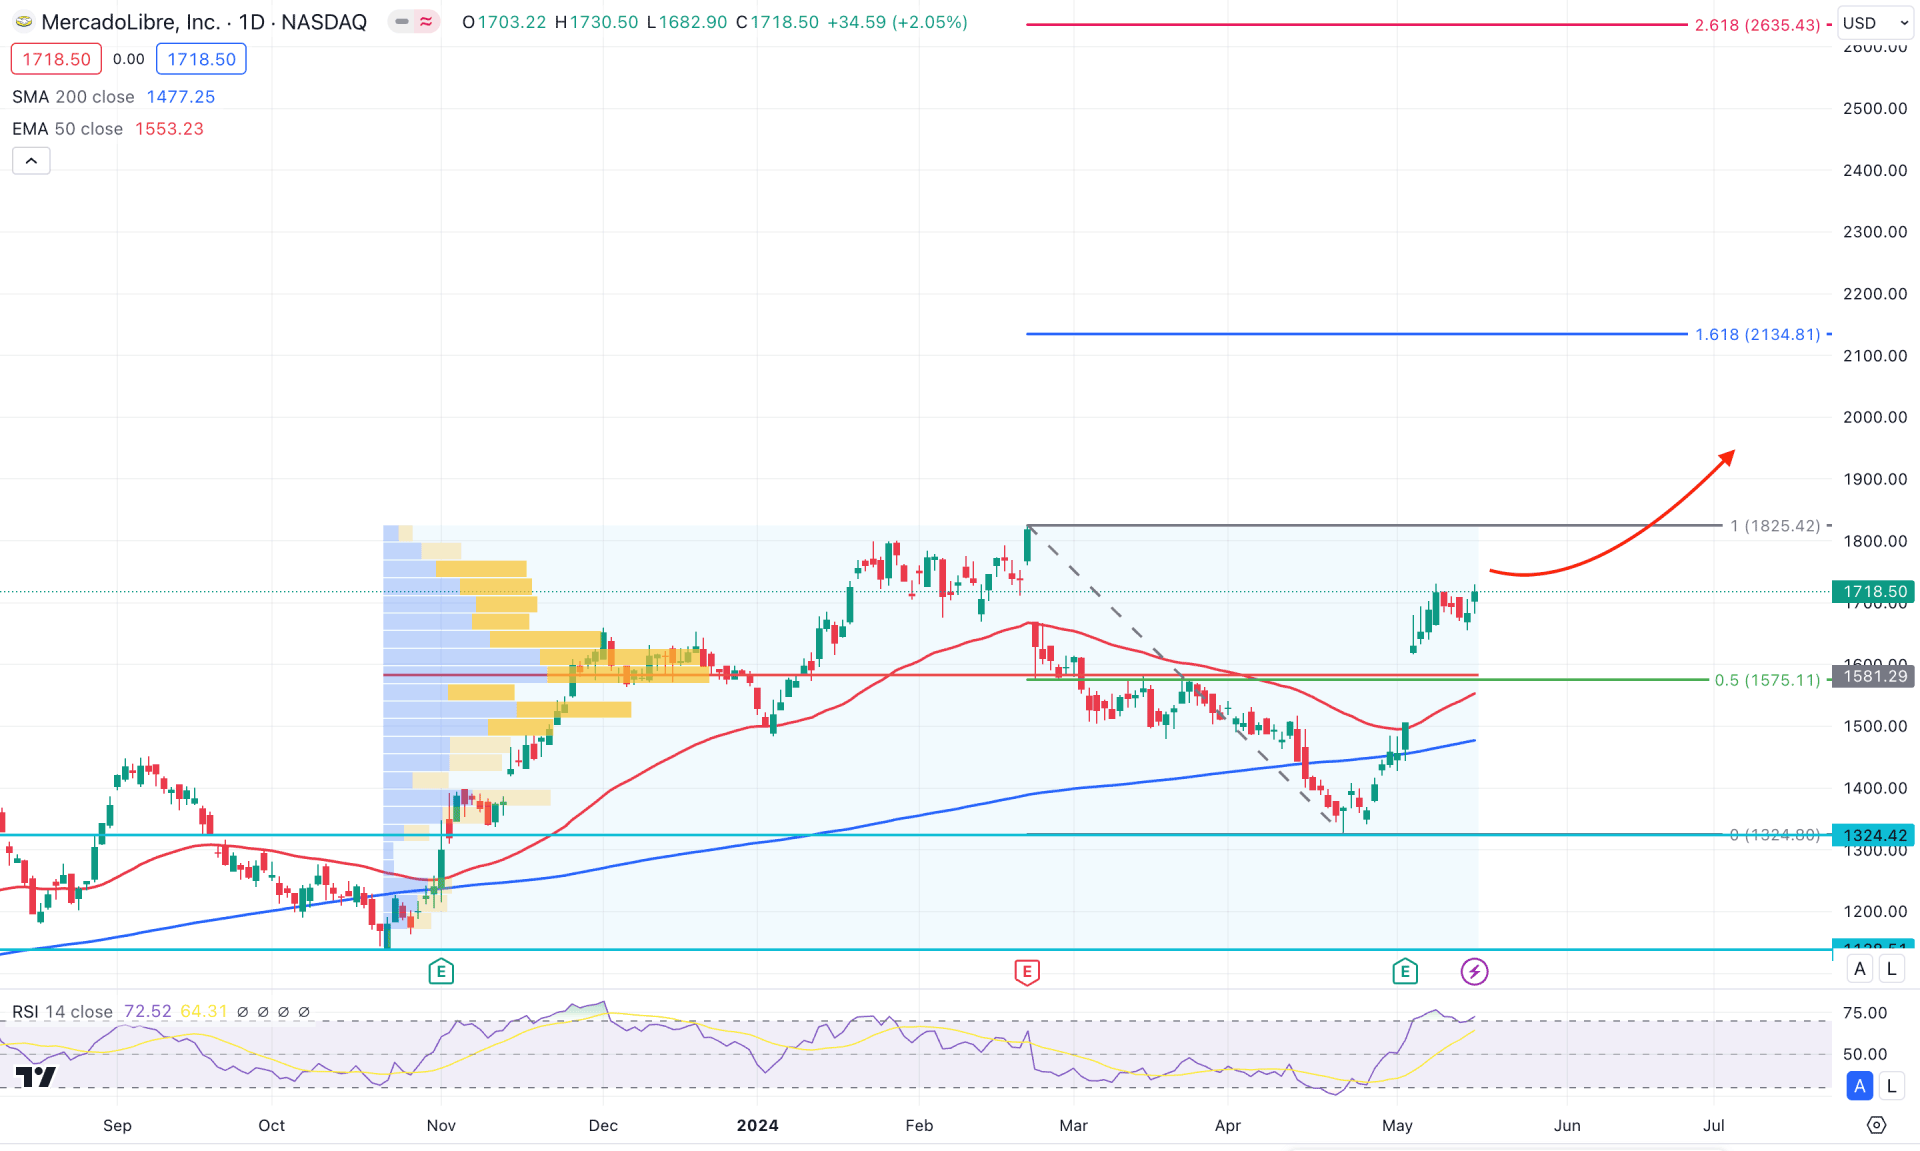
In the daily chart of MELI, the ongoing buying pressure is strong as it came from grabbing the sell-side liquidity from the 200 day Simple Moving Average line. As the current price trades sideways above the 200 day line, we may expect the buying pressure to extend in the coming days.
In the volume structure, the highest activity level since November 2023 is at 1581.29 level, which is above the current price. The downside pressure after forming a top at the 1825.42 level came with a valid bullish reversal above the high volume line. It is a sign that bulls have joined the market and are ready to take the price even higher from the current price.
In the higher timeframe, the current monthly candle trades bullish after three consecutive bearish months, while the current weekly price trades bullish with an impulsive momentum.
In the daily chart, the recent price failed to hold the downside pressure below the 200-day SMA line and showed an immediate recovery. Moreover, the 50-day Exponential Moving Average is below the current price, working as near-term support. In that case, any minor downside correction with a bullish reversal from the 50-day EMA could resume the existing trend.
In the indicator window, the Relative Strength Index (RSI) showed extreme buying pressure as the current level is above the 70.00 overbought line. Primarily, the bullish possibility is potent in this instrument as long as the RSI holds the momentum above the 50.00 line.
Based on MELI's daily market outlook, the ongoing buying pressure is valid as the current price hovers above the dynamic 50-day EMA. In that case, the price is more likely to extend and reach the 2134.81 Fibonacci Extension level. Moreover, a stable market above the 1825.42 high could extend the momentum at the 2635.00 level.
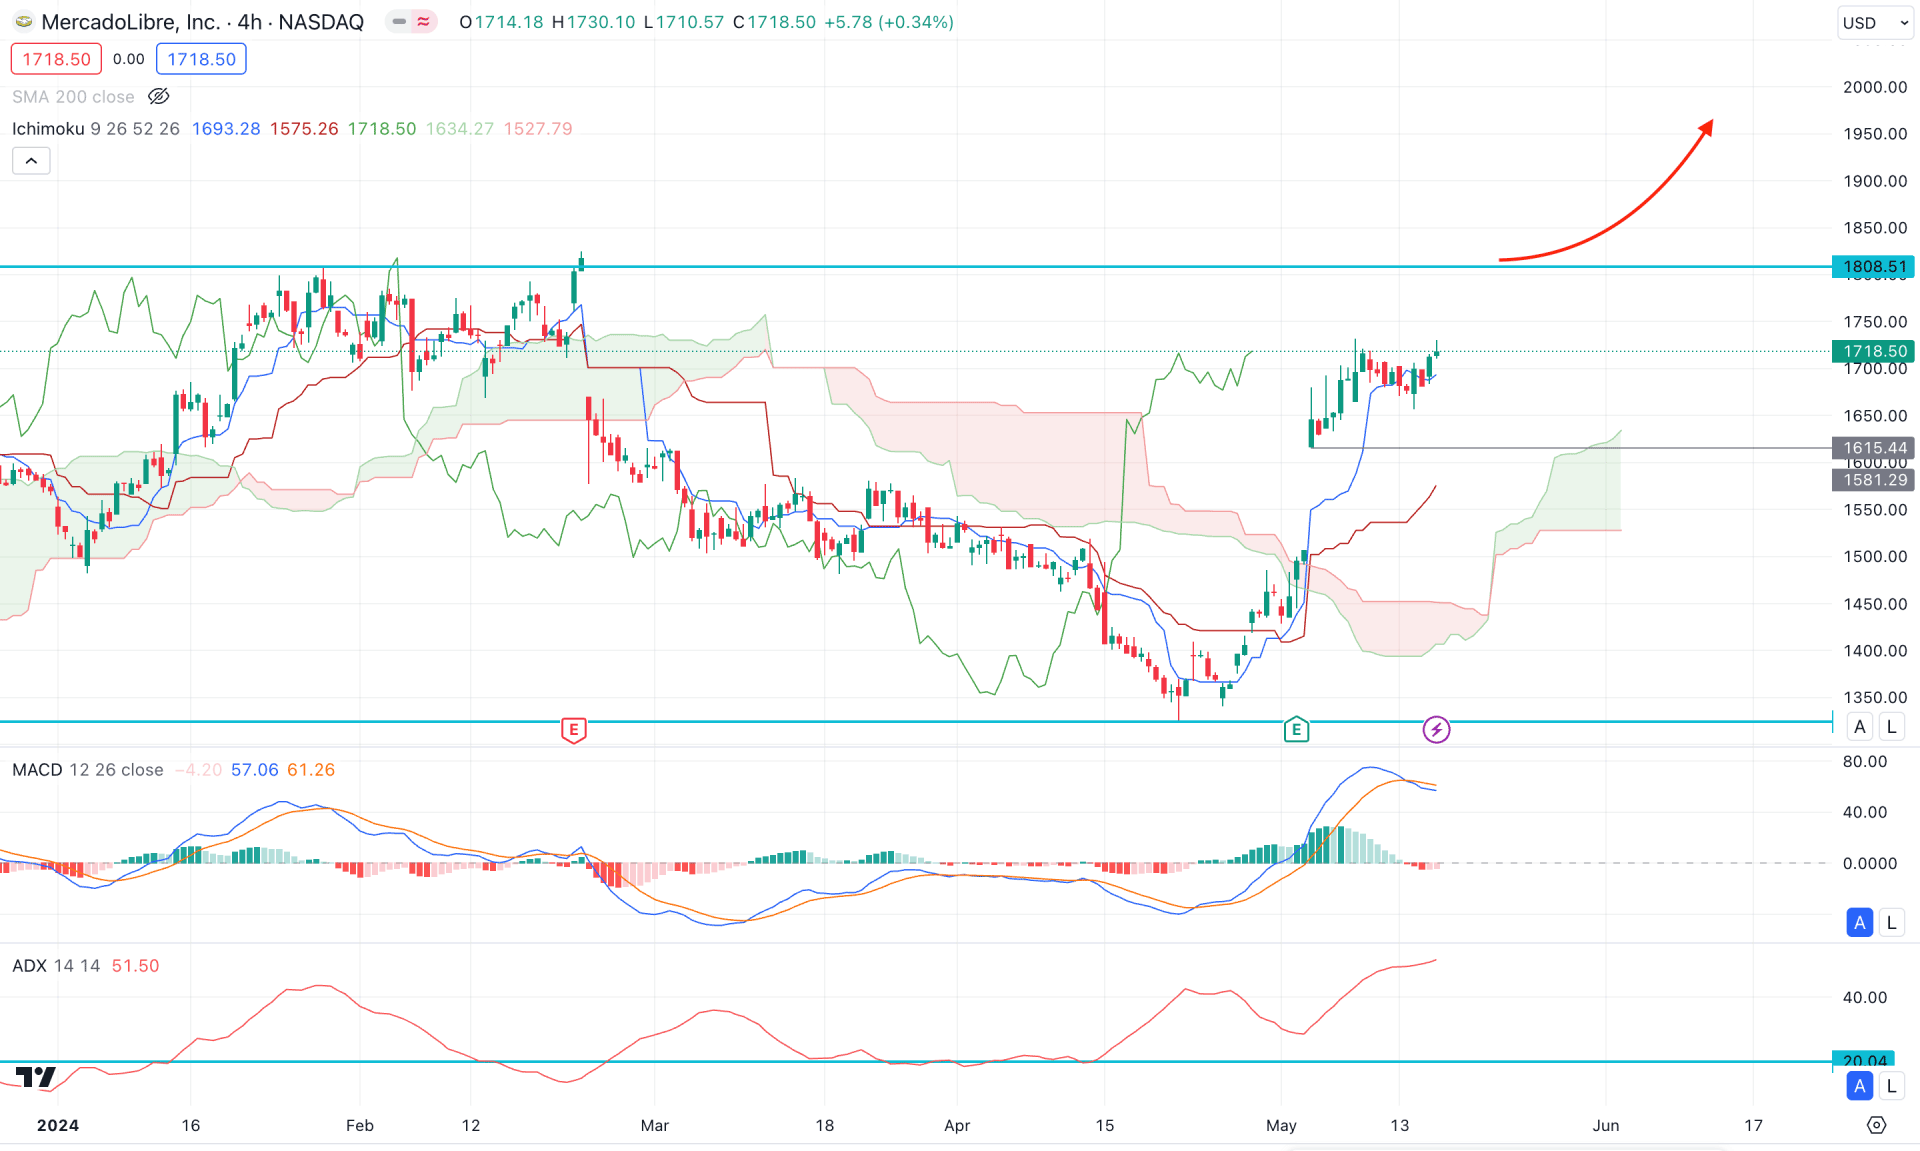
In the H4 timeframe, the ongoing buying pressure is potent as the dynamic Ichimoku Cloud zone is below the current price, working as a major support. Moreover, the Senkou Span A is above the Senkou Span B, which showed upward traction. It is a sign of ongoing buying pressure, from where any bullish reversal could be a trend trading opportunity.
In the indicator window, the MACD Histogram remained at the neutral level, while the signal line formed a bearish crossover at the top. Moreover, the Average Directional Index (ADX) moved above the 50.00 level and became flat.
Based on the position of the technical indicators, a downside correction is pending. However, the main chart shows ongoing buying pressure above the 1615.44 support level. In that case, a downside correction and the bullish reversal from the 1650.00 to 1500.00 zone could be a valid long signal, targeting the 2000.00 level.
On the other hand, a strong downside pressure with a bearish H4 candle below the 1450.00 level could extend the loss toward the 1324.42 support level.
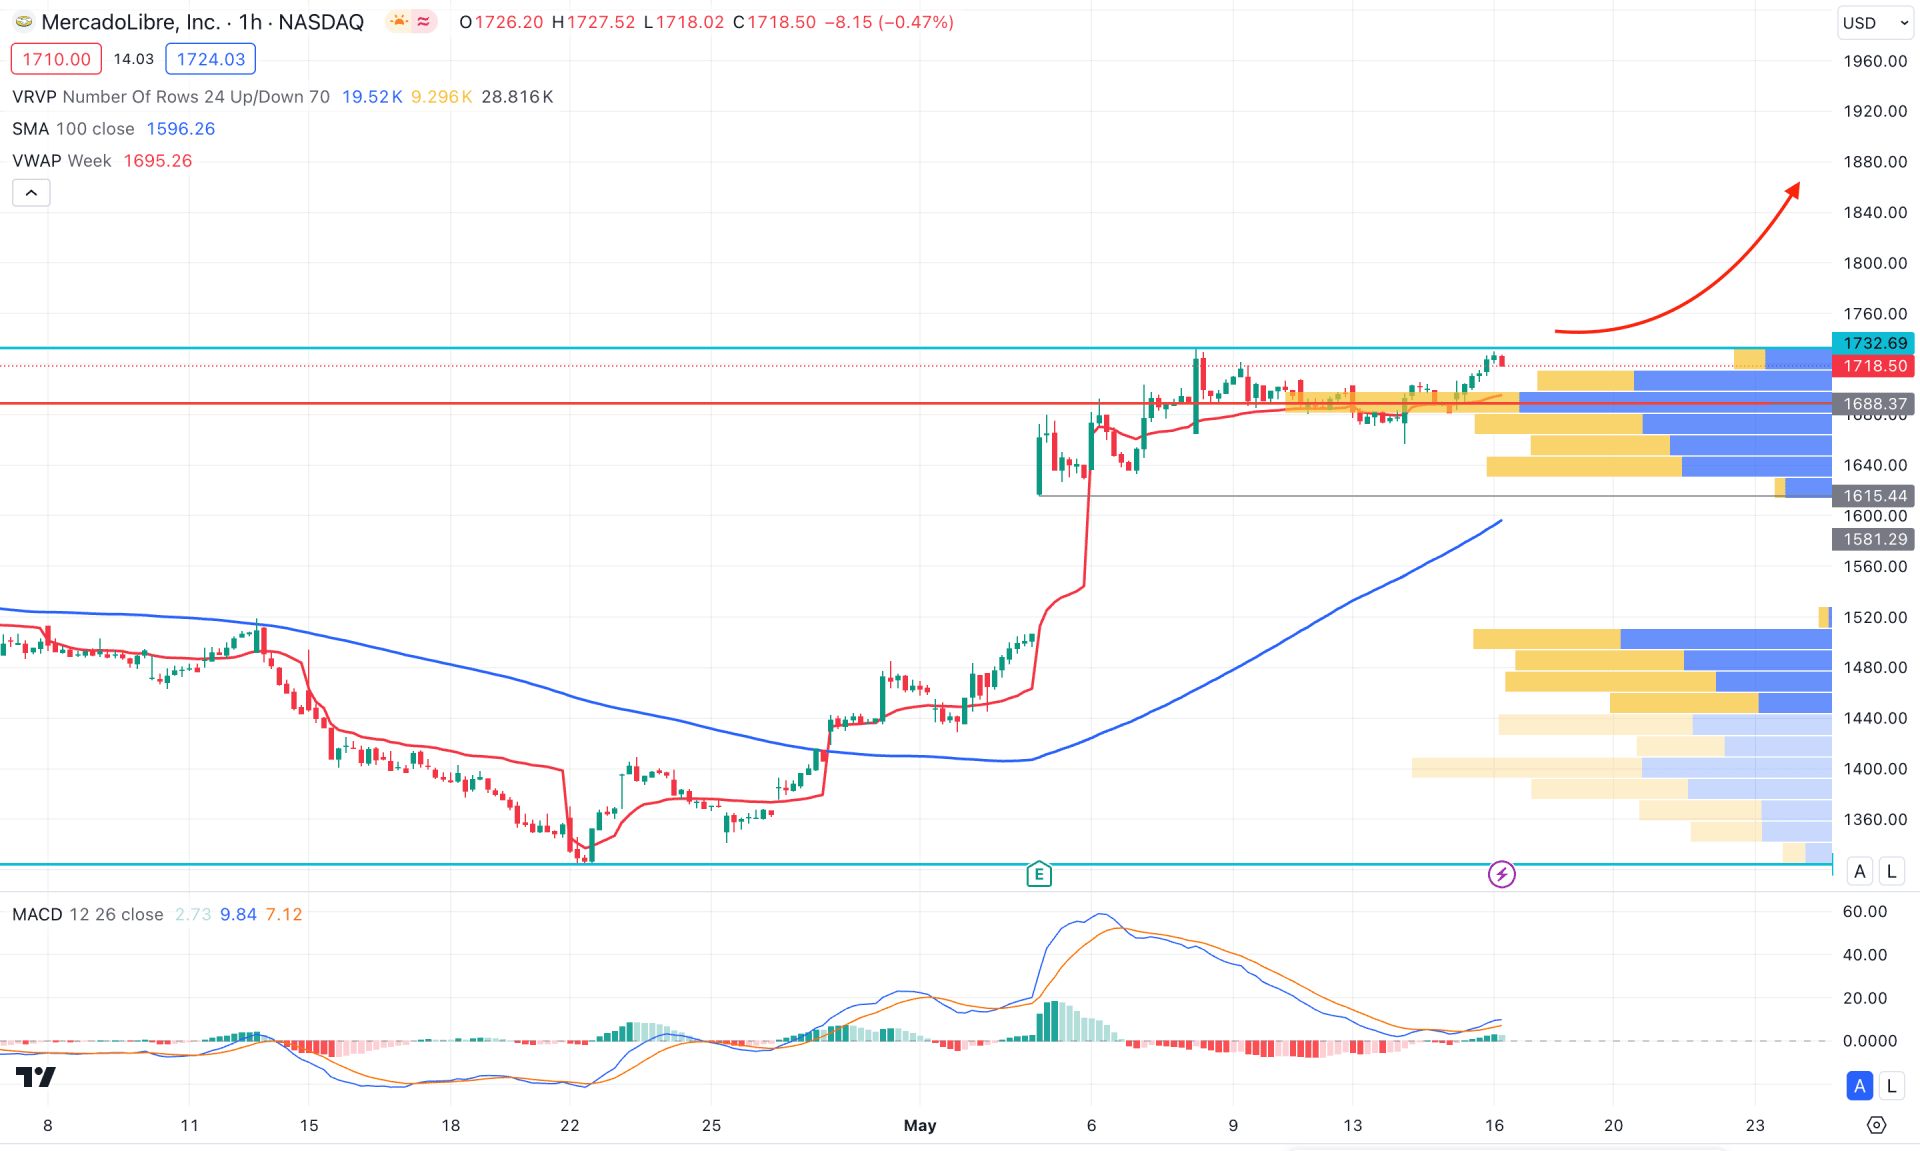
In the hourly chart, the MELI is trading above the visible range high volume level, where the most recent correction suggests a bullish re-accumulation.
The 100 SMA line is below the current price, while the weekly VWAP is the immediate support. Moreover, the MACD Signal line showed a bullish recovery from the neutral point, while the Histogram maintained the upward momentum.
Based on the H1 outlook, a bullish breakout with an hourly candle above the 1750.00 level could resume the buying pressure toward the 2000.00 level.
On the other hand, downside pressure could extend after having a solid bearish reversal from the 1750.00 level with a bearish H4 candle below the 1669.70 low.
Based on the current market outlook of MELI, the ongoing bullish trend has a higher possibility of extending in the coming days. Investors should closely monitor the near-term price action in the intraday chart to find the bullish pinpoint.


