

Published: July 16th, 2026
Over the last seven days, MemeCore has rebounded almost 90% from the recent bottom after the massive collapse.
MemeCore saw severe selling pressure after plunging more than 80% from over $2.80 to roughly $0.51 in late June amid market speculation about potential insider involvement and project-related issues.
Following the MemeCore development group's release of several public security upgrades that resolved those issues, confidence began to grow again.
Investors who had remained on the sidelines after the collapse were reassured by promises, which persuaded many that the safety issues were external rather than network-related.
Can M/USDT rebound from the current collapse? Let's see the full outlook from the M/USDT multi-timeframe analysis:
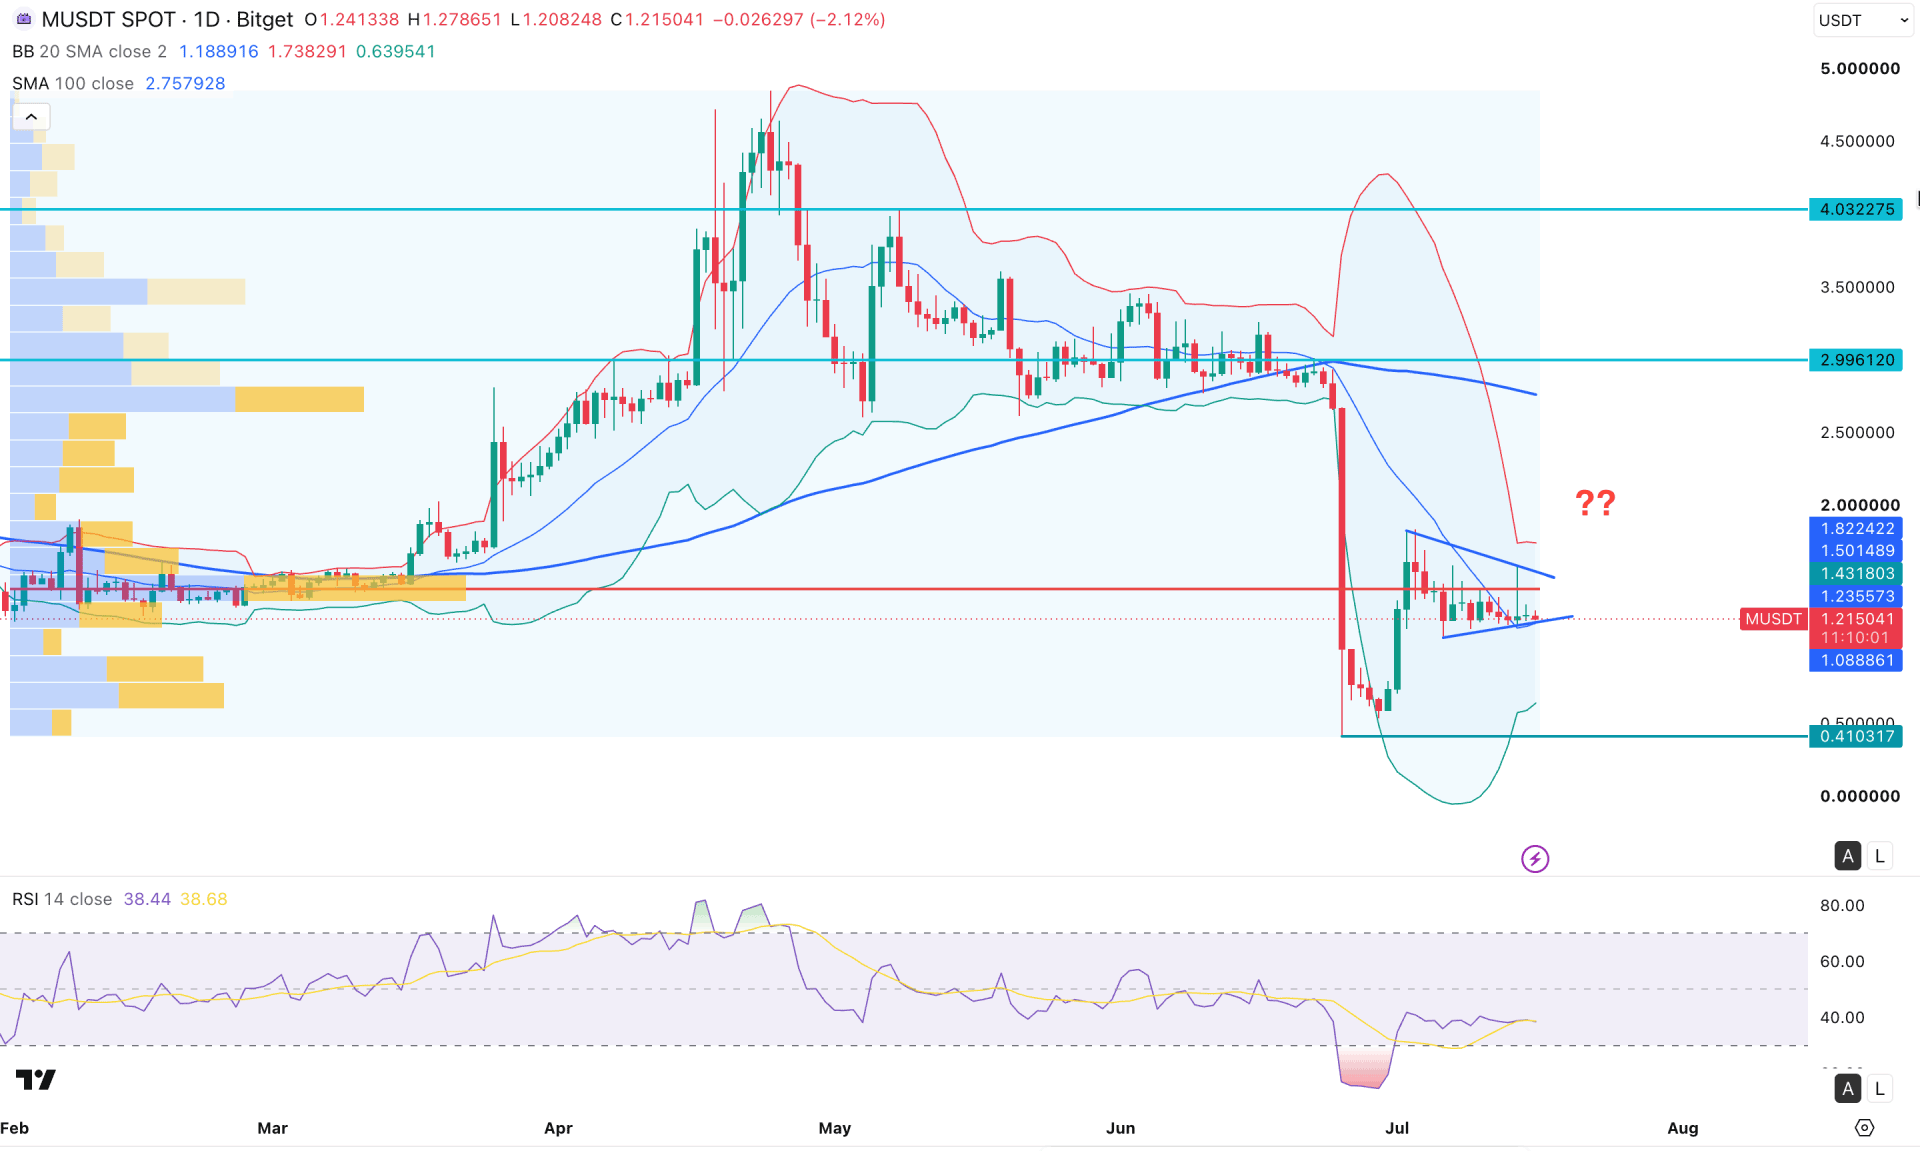
On the daily chart of MemeCore (M/USDT), the price recently broke down, dropping below the existing yearly low, with no sign of a meaningful bullish recovery. The price rebounded from the 0.4103 bottom with counter-bullish momentum but went sideways after creating a swing high at the 1.8388 level. As the most recent price action is sideways, investors should closely monitor how the price breaks out of the range, creating a stable trend.
Looking at the higher time frame, the current buying pressure is insignificant compared to the existing selling pressure in the previous month. The price is still trading within an inside bar, from where a bearish break is highly possible. The weekly chart shows corrective pressure, but the crucial weekly resistance is still protected. As long as the price remains below the 1.8388 weekly high, we may expect the bear momentum to extend.
In terms of volume, selling pressure is still dominating the market. The largest activity level since January 2026 is just above the current price and is working as a crucial resistance. Moreover, a buy-side liquidity sweep is also visible from this high-volume resistance level, signalling active bearish momentum in the market.
Looking at the price action, the price is trading within a pennant pattern, from where a bullish breakout can relieve some pressure for buyers. However, the most recent price is hovering at the pennant support level, and failure to hold this momentum could be a challenging factor.
The price remains in line with the mid Bollinger band, where the upper and lower Bollinger bands are flat. It is a sign of a sideways market, from which a breakout is possible. The 100-day simple moving average is far above the current price, signalling a major ceiling in the market.
In the indicator window, the RSI remains below the 50.00 level for a considerable time, signalling active selling pressure in the market.
Based on the overall market structure, the massive selling pressure amid a sideways market in the discounted area increases the likelihood of a bearish continuation. As long as the price remains below the 1.2355 high-volume resistance level, we may expect downside pressure to extend. A failure to hold the price at the mid Bollinger band could create immediate selling pressure, targeting the 0.4103 support level.
The secondary short opportunity might come after a valid bearish reversal at the high-volume resistance area. However, a bullish break above the 1.4318 level with a daily close could be a positive sign for buyers, which can extend the bullish correction towards the 100-day SMA area.
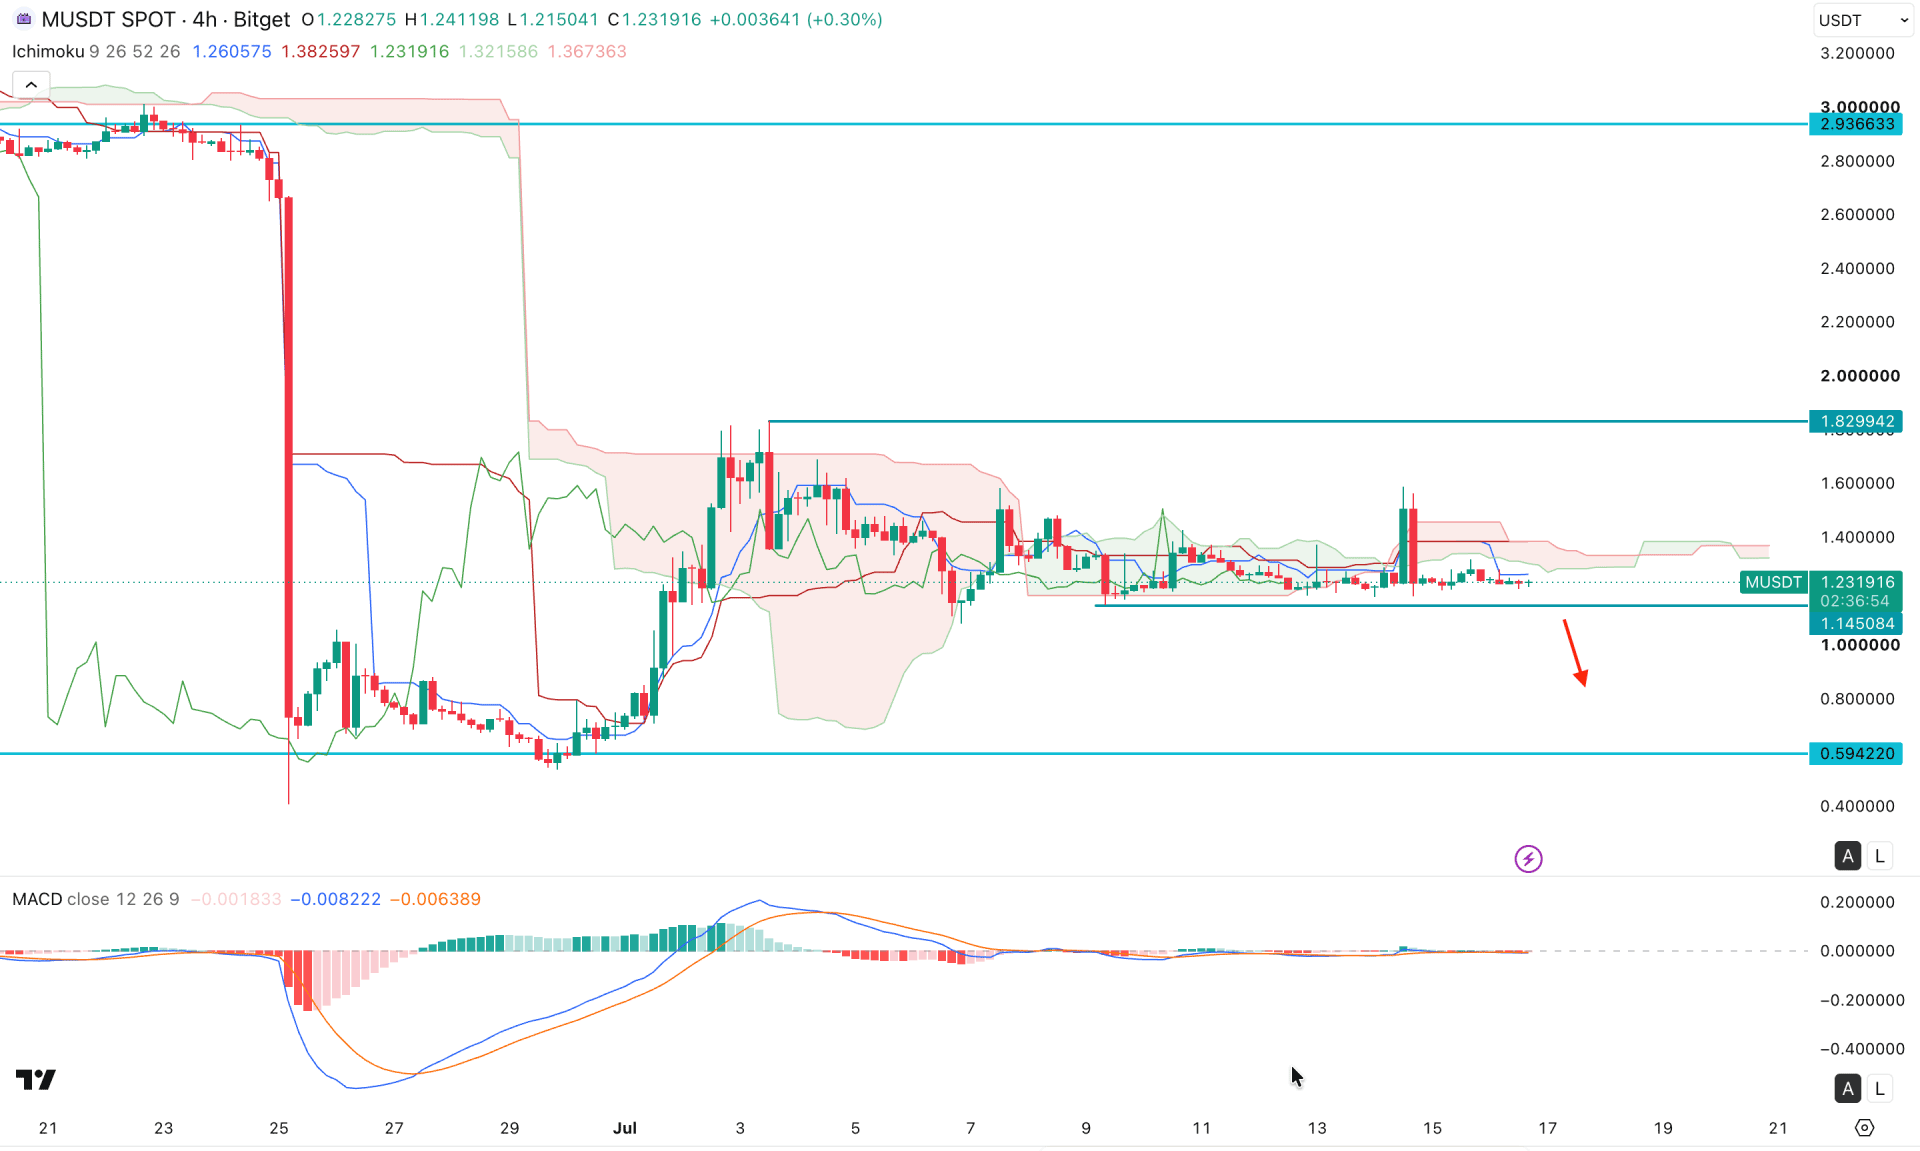
In the four-hour timeframe, the recent price remains flat for a considerable time, signalling an extended correction. Moreover, the Ichimoku cloud remains flat in line with the current price, which is an additional sign of a corrective market phase.
Looking at the price action, a range-bound market is visible, as the most recent price is below the dynamic resistance. Although the crucial support of 1.1450 is protected and the MACD histogram has rebounded to the neutral area from the major low, it is a sign of a minor bullish correction in the market.
Primarily, as long as the price remains above the 1.1450 support level, it is likely to rebound higher and test the 1.4000 key psychological level.
On the other hand, minor bullish pressure with a bearish rebound from the 1.3156 swing high could increase the possibility of extending the pressure and creating a new swing low below the 1.1450 level.
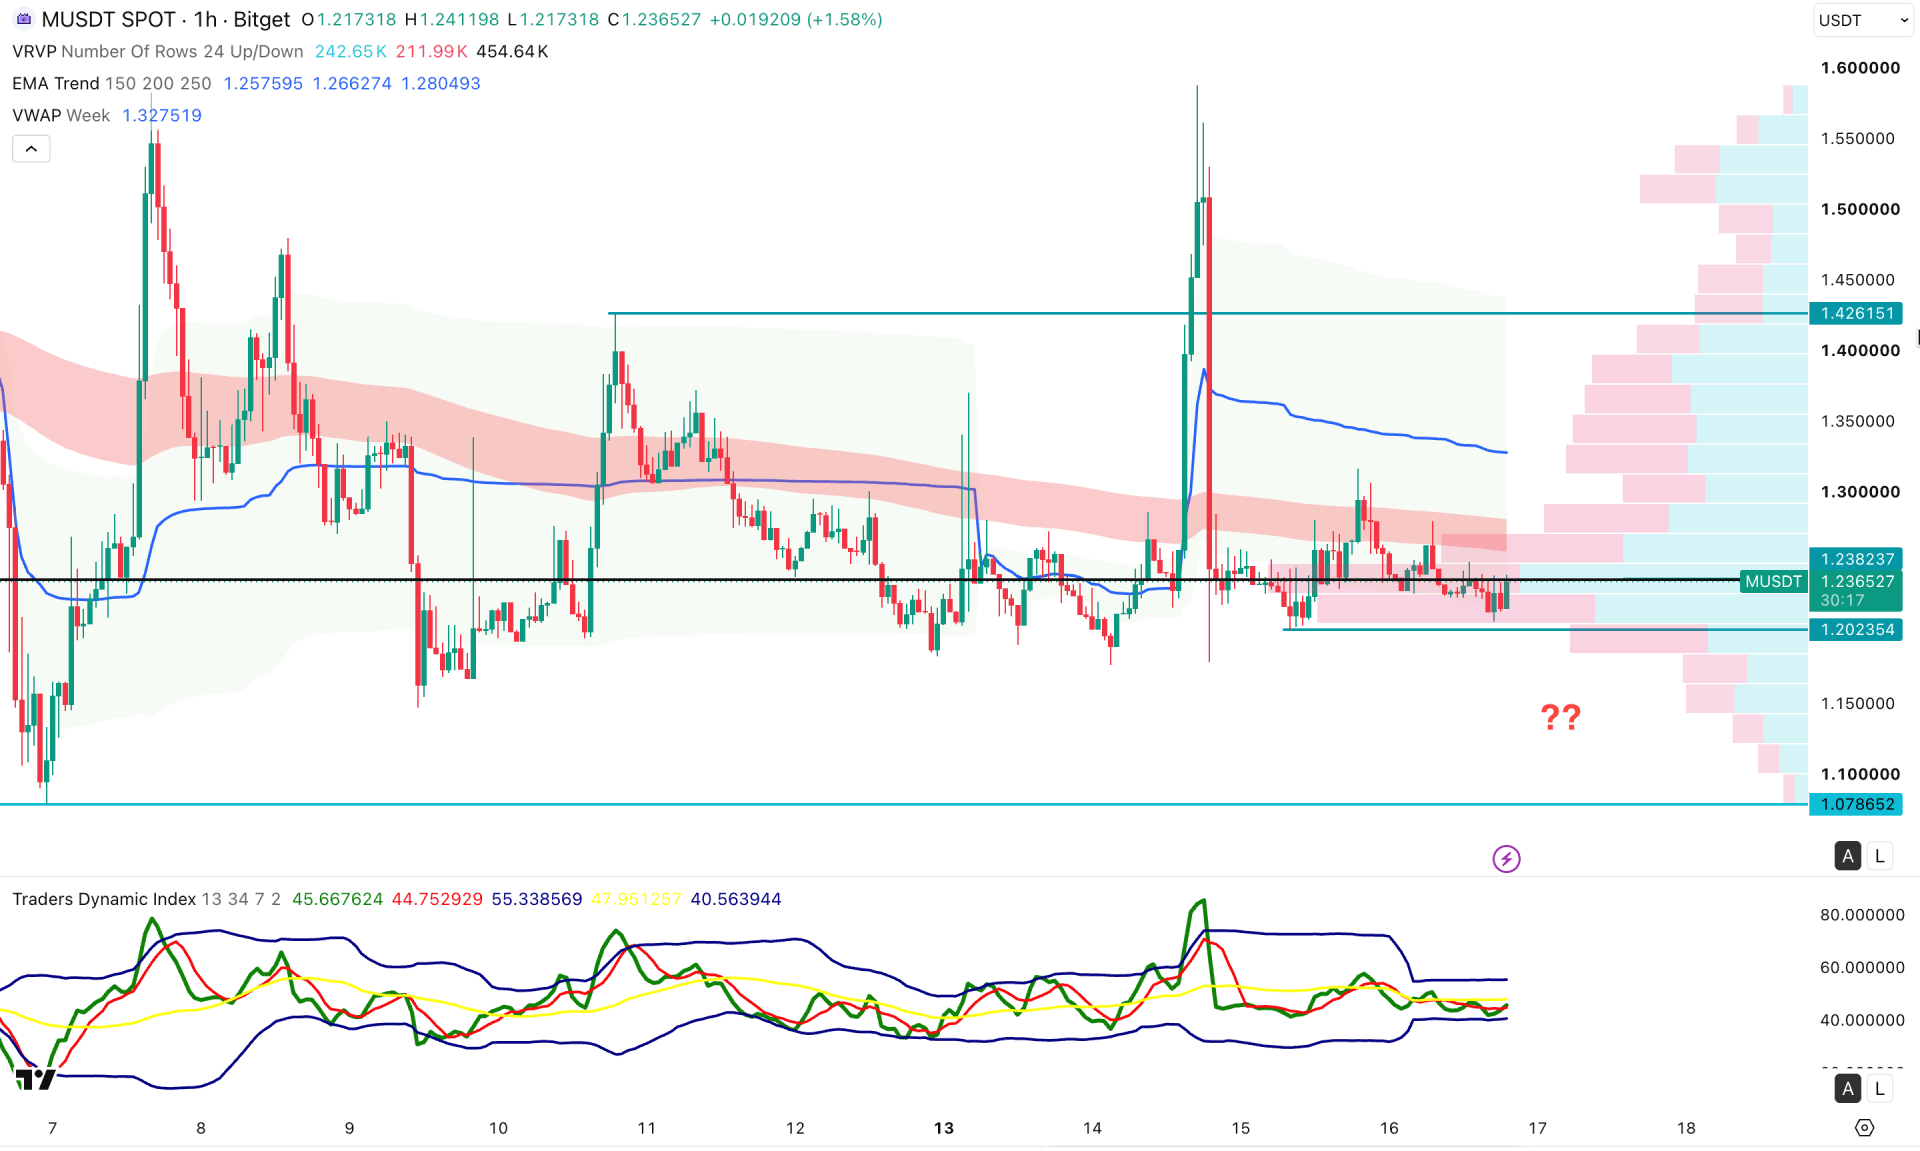
On the hourly timeframe, M/USDT shows intraday volatility. Although the current price is in line with the high-volume level at 1.2382, the recent pump and dump signals an early bearish break opportunity.
The weekly VWAP level is above the current price and is working as resistance in line with the EMA wave. It is a sign of active selling pressure in the market that can lead to a very strong continuation at any time.
On the other hand, the Traders Dynamic Index signals sideways momentum, with the current line at the 50.00 level and upper and lower bands flat.
Based on this structure, investors should monitor how the price reacts at the 1.2023 support level, as a failure to hold this level could resume the bearish trend towards the 1.1500 area. On the other hand, the gap between the weekly VWAP line and the current price can create a minor bullish correction possibility, where the immediate target is to test the 1.3172 support-resistance level.
However, immediate buying pressure with recovery above the 1.4261 resistance line could invalidate the current structure and increase long opportunities.
Based on the overall market structure, M/USDT is trading within a bearish trend, where the current price is sideways after creating a significant low. As no sign of strong buying pressure is visible, the price is more likely to extend downside pressure after forming a valid range breakout.


