
Published: February 1st, 2022
McDonald’s showed a double-digit revenue gain in its latest Q4 earnings report that showed a strength of the company in McDonald’s investment and digital capabilities. In the fourth quarterly report, McDonald’s showed a 13% revenue growth, which excludes the effect from restaurant close of 12 months. According to McDonald's, technology and digital paid the company to continue the seamless business growth where the digital sales have seen to provide a 60% gain over 2020.
The big part of the company is the third-party food delivery aggregators like Uber and DoorDash that created a robust channel to have McDonald’s items by consumers. Currently, digital delivery is available in 33K McDonald’s restaurants in over 100 countries, pushing the company to have such revenue growth.
The surge in digital sales can go beyond the pandemic’s effect, but investors should remain concerned about the labor shortage that pushed the company to raise wages. However, digital sales can provide relief to staff pressures where consumers order online through the app that does not need any additional employee’s attention. With the recent surge in digital sales, McDonald’s reported the biggest yearly earnings growth of $10.04 a share in the last decade.
Let’s see the upcoming price direction from the McDonald's Stock (MCD) technical analysis:
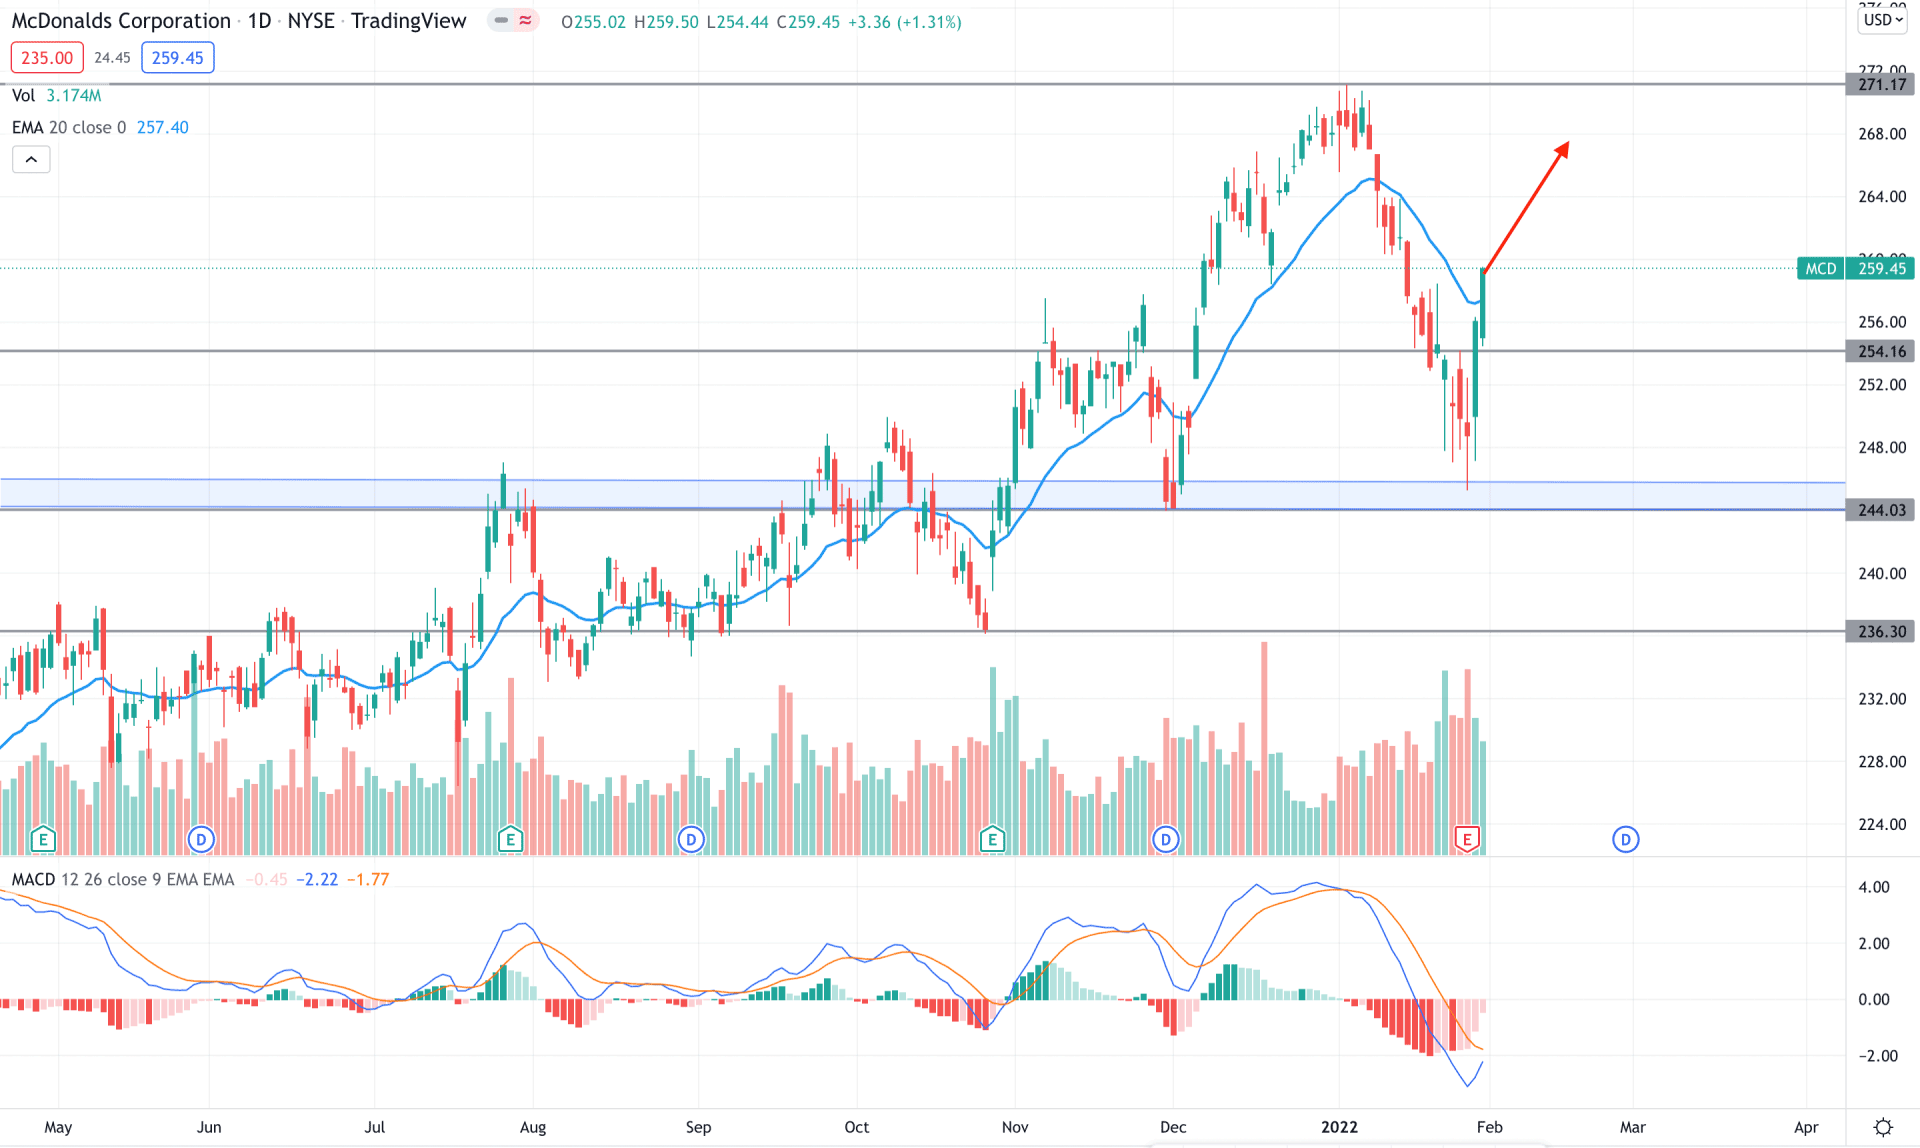
In the daily chart, McDonald’s stock is trading within a bullish trend where buying from the dip would provide the best trading opportunity. The bullish trend extended in December 2021 as soon as the price made a new swing high above the 257.60 double top level. As a result, the price made a bullish break of structure and reached 271.17 level with a new swing high. Therefore, as the recent price showed buyers interest from 244.00 to 246.00 order block we can aim the 271.17 level as the primary target area.
The above image shows how the price tested the bullish order block and moved beyond the dynamic 20 EMA with a bullish daily close. On the other hand, the MACD Histogram eliminated the selling momentum while the volume soared during the upside pressure.
Therefore, based on the daily price structure, investors may find the recent bullish momentum to extend towards the 271.00 level. In that case, any buying opportunity from 254.16 to 260.00 area with lower timeframe confirmations has a higher possibility of taking the price up. On the other hand, a break below the 254.00 level with a bearish daily close may alter the current market structure and lower the price towards the 244.00 level.
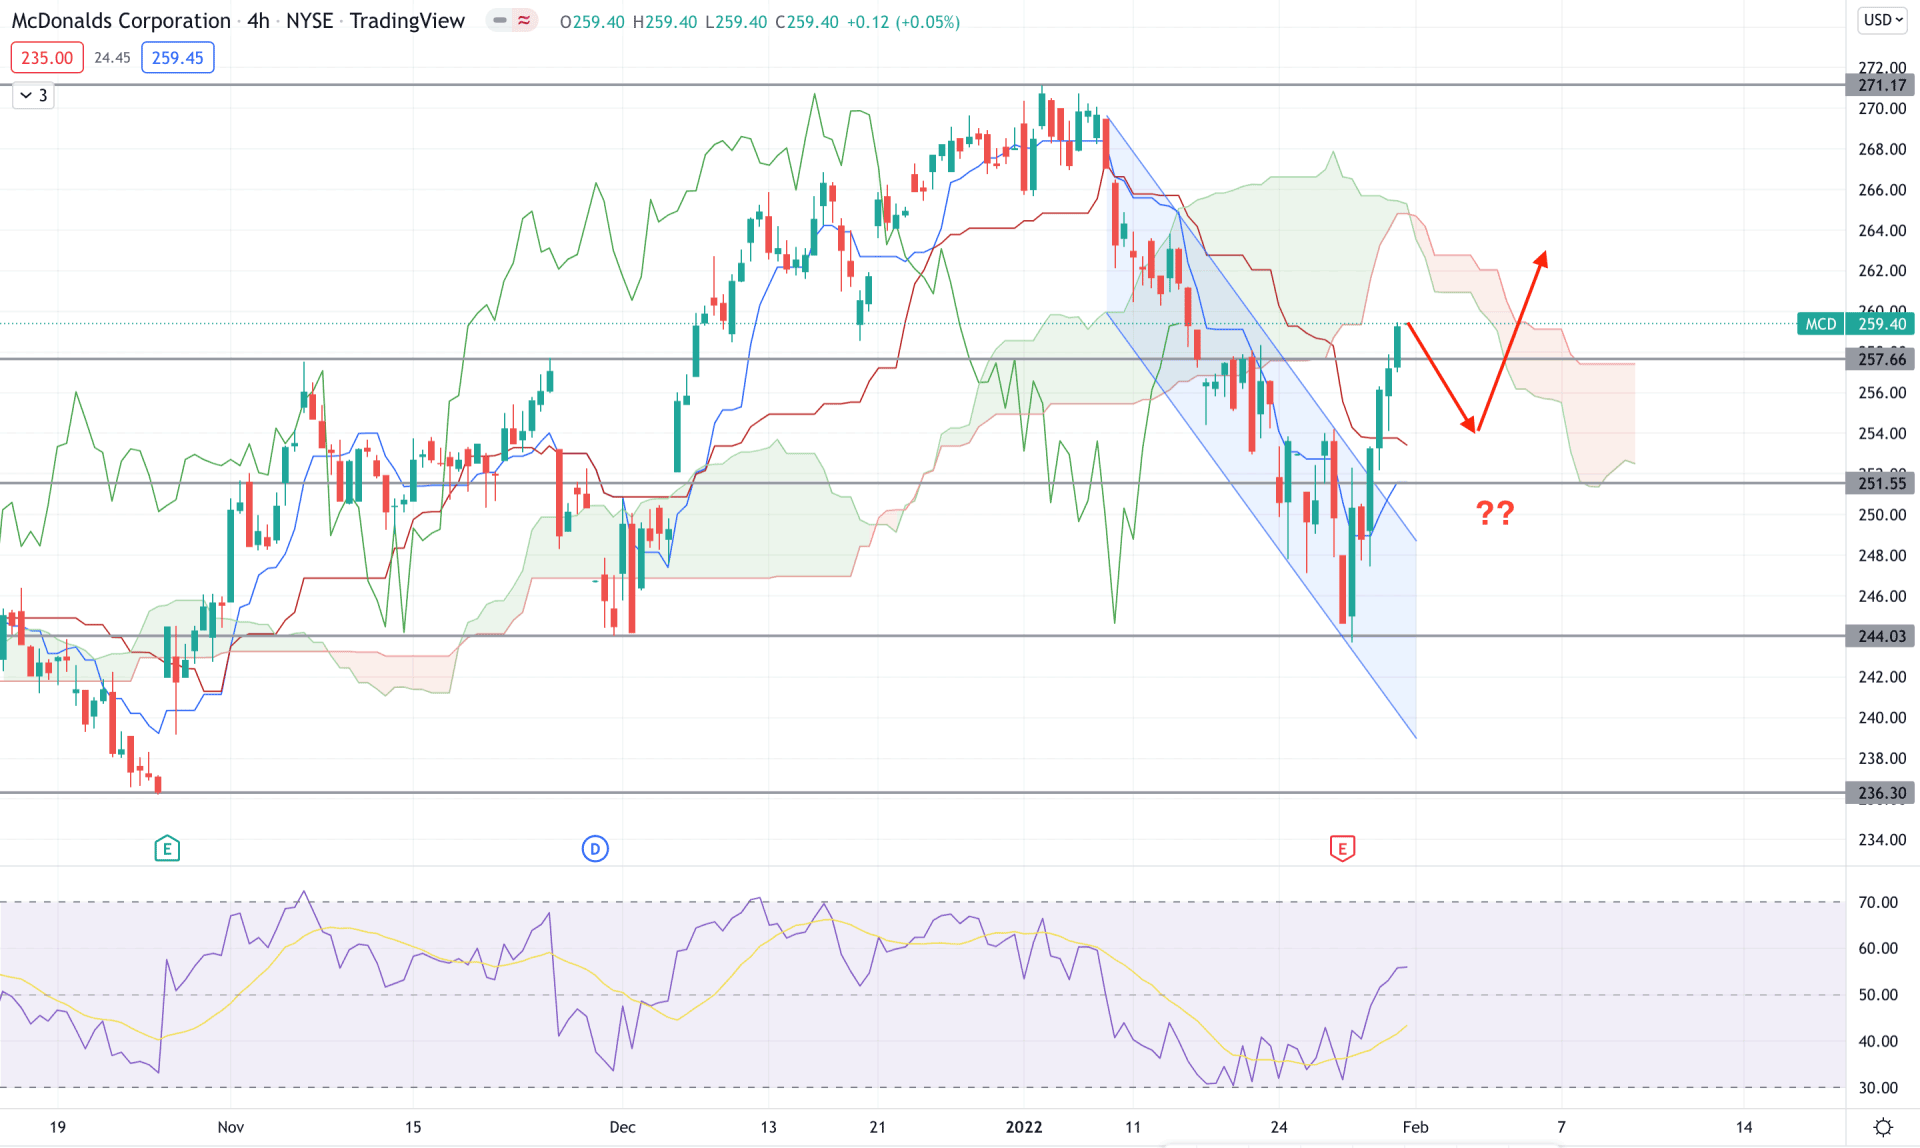
Acording to the Ichimoku Cloud, the H4 structure of MCD needs a clear direction by moving above the Cloud resistance. The price is currently below the Kumo Cloud but above Tenkan Sen and Kijun Sen lines. On the other hand, the future cloud is bearish and lagging span is close to the price.
The above image shows how the price formed a bearish channel breakout that pushed it above dynamic levels. Meanwhile the RSI level is above the 50 area and aimed higher. As the current price is below the Kumo Cloud, investors need a close attention to the price action before taking a trading decision.
Based on the current structure, a bearish correction is pending where any bullish rejection frm dynamic Tenkan Sen or Kijun Sen might initiate the cloud breakout. On the other hand, a break below the 251.55 support level with a bearish H4 close has a higher possibility of taking the price lower in the coming days.
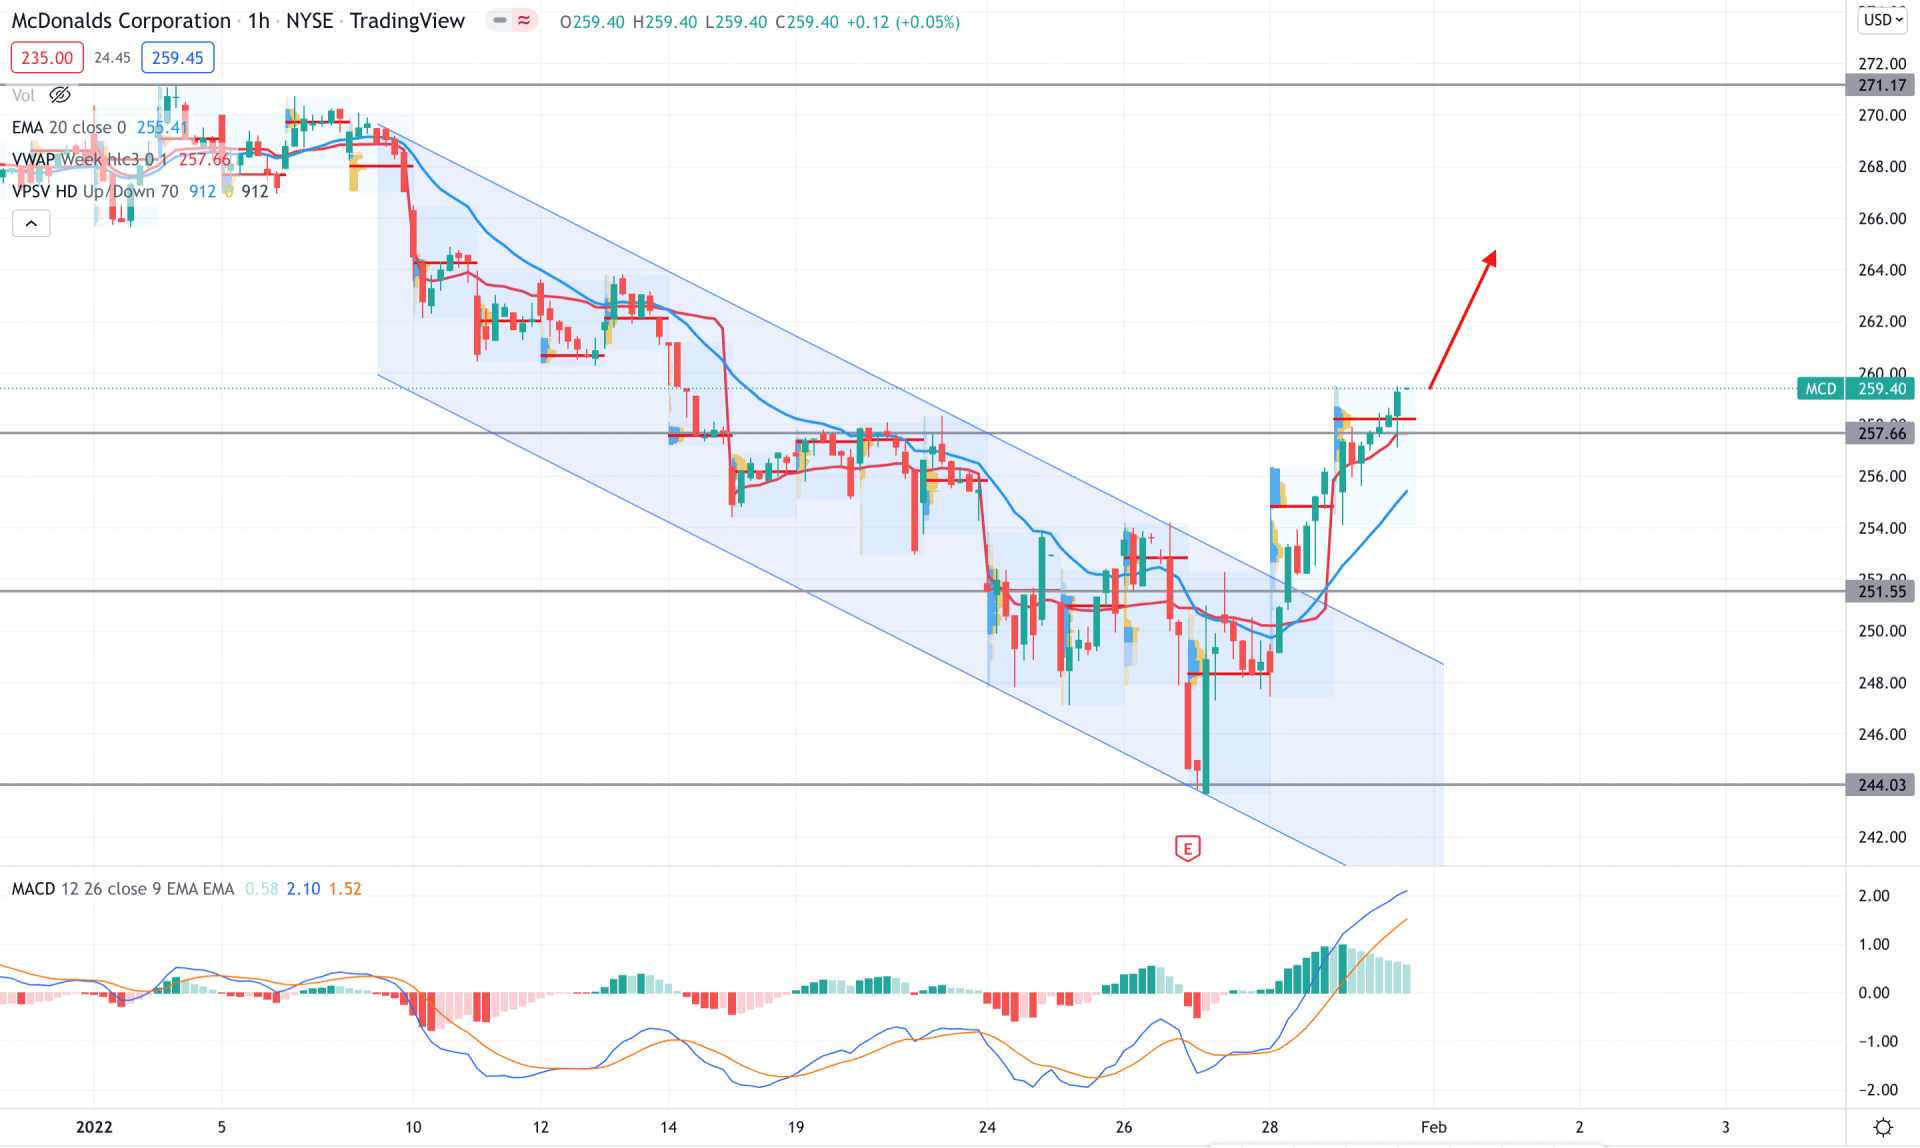
In the H1 chart, McDonald’s stock showed a strong bullish breakout from the bearish channel that pushed the price upo above the 251.55 support level. Moreover, intraday high volume levels were up while dynamic levels acted as support.
The above image shows how the price trade above dynamic weekly VWAP while the MACD Histogram remained bullish. Moreover, there are higher highs in intraday high volume level, which is a sign of a strong buyers interest in the price.
Therefore, based on the current structure, investors may expect the price to grow towards 271.71 level in the coming days. The buying sentiment is valid as long as the price trades above the dynamic 20 EMA in the hourly chart. A break below the 251.51 may alter the current market structure and initiate a broader correction.
As per the current market context, MCD has a higher possibility of reaching the current swing high of 271.71 level in the coming days. In that case, any buying opportunity from lower timeframe has a higher possibility of taking the price up.


