
Published: May 3rd, 2022
In Q1, McDonald’s revenue came lower than the previous report by 5.72% to $5.67 billion. Moreover, the gross revenue moved lower by 6.84%, while the diluted earnings per share moved down by 32.25% to 1.48 a share. However, the company still has potential for long-term investors as its recent yearly financial report indicates a stable position in profit and assets.
One of the key price drivers for this company is its massive adoption of online food delivery services through the online app. In 2021, the company's total revenue was $23.3 billion, where 25% of the sales come from digital. Therefore, it already showed that many people are interested in taking food from their online service. On the other hand, the company's financial structure remained strong where the current liquidity, price to earnings ratio, and return on assets are potential for bulls.
Although the long-term outlook is bullish, a minor bearish correction is pending that we can define from the McDonald’s stock technical analysis.
In the weekly chart, McDonald’s stock has a long history of providing profits where the current difference between the pandemic-driven collapse to an all-time high is a 119% price change. However, in the most recent chart, the bearish break of structure below the 245.35 swing low opened the possibility of swinging a deeper correction before extending the existing uptrend.
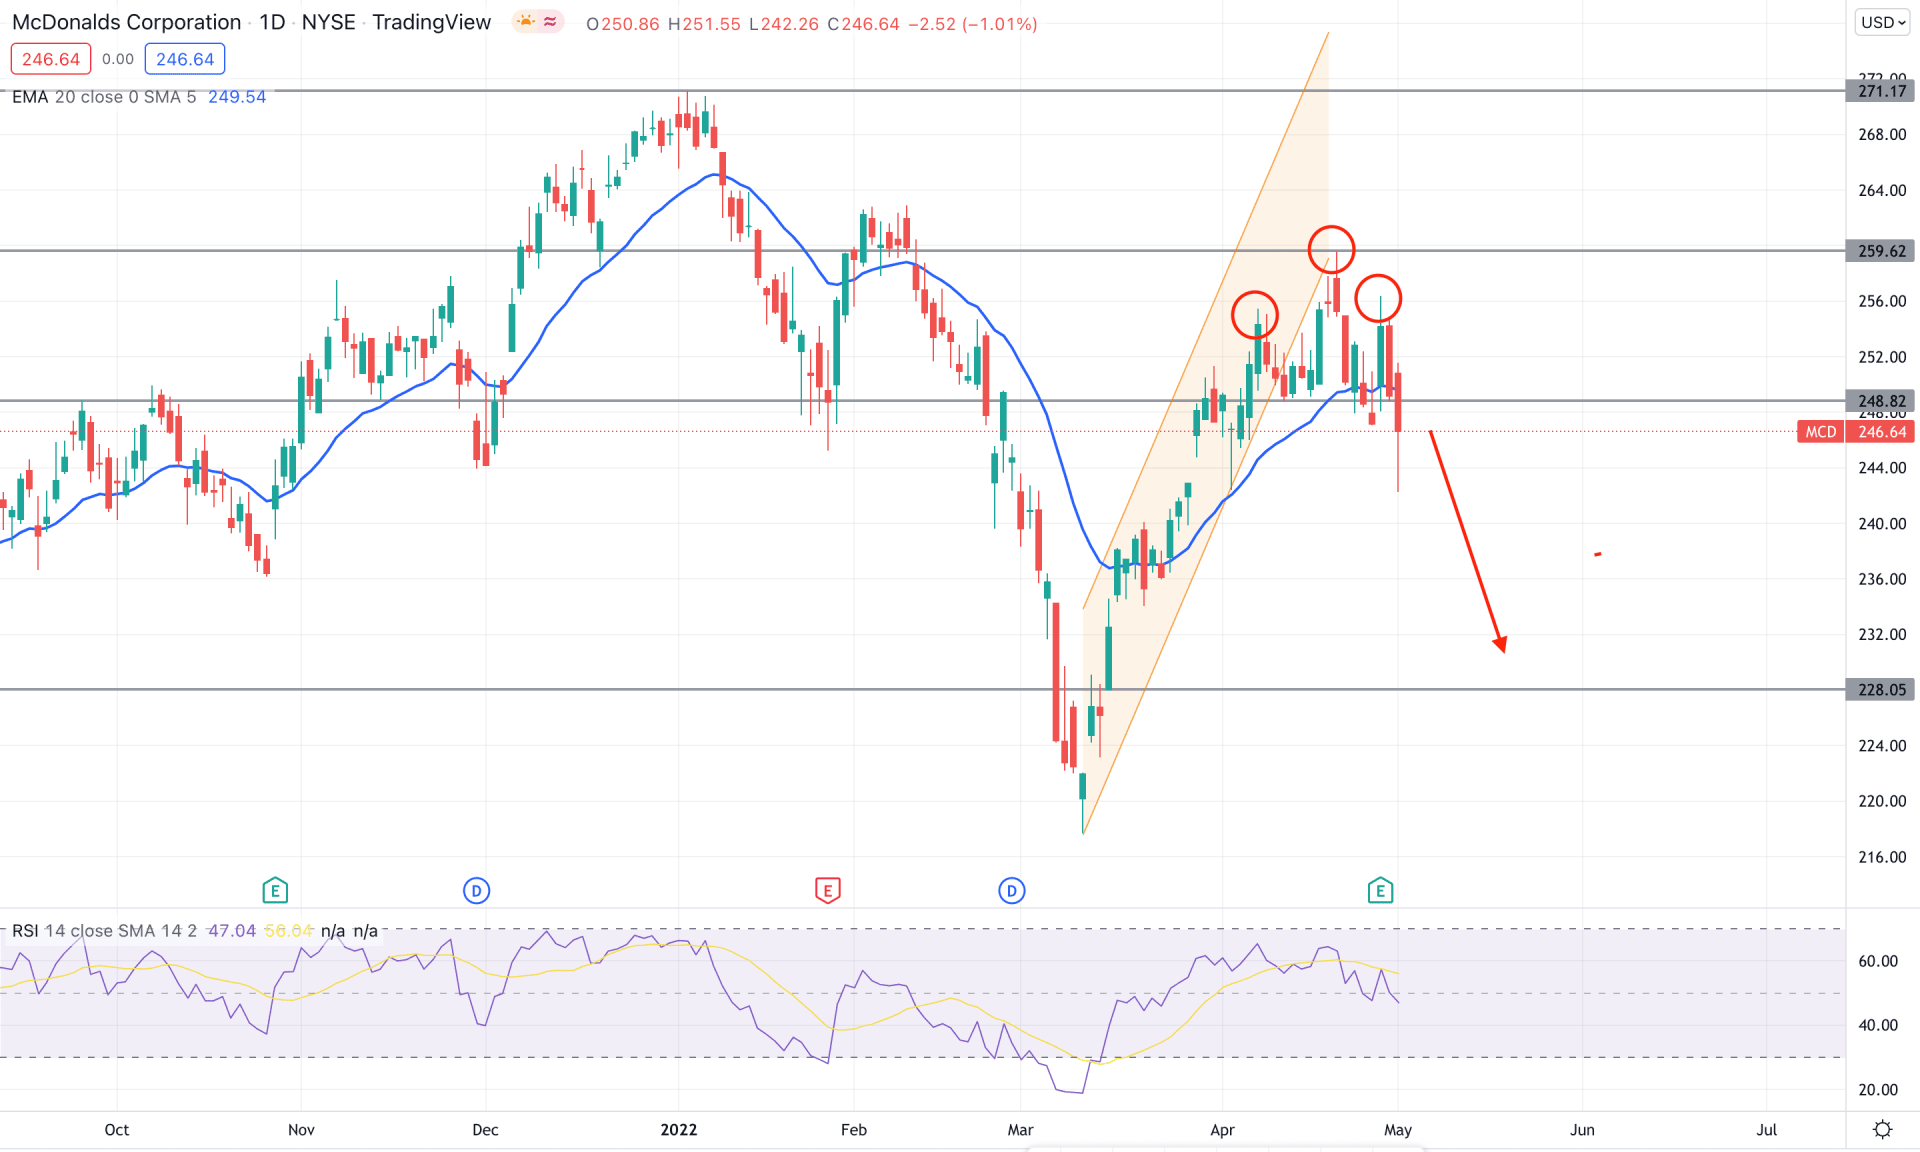
The above image shows how the price crashed lower by 19% from the 271.17 all-time high before approaching the 259.62 resistance level. Moreover, the price formed a head and shoulder pattern where the neckline is at 128.82 level. After the Q1 earnings report, bears pushed the price down with an impulsive selling pressure that made a breakout from the neckline. Meanwhile, the selling pressure pushed the price down below the dynamic 20 EMA, indicating strong seller activity in the price. In the indicator window, the RSI moved below the 50 level, possibly moving further down to the oversold 30 level.
Investors should closely monitor how the intraday price trades below the 128.82 necklines based on the daily price structure. As long as bears hold the price below the 252.00 psychological number, the price may extend the selling pressure towards the 228.05 level in the coming days.
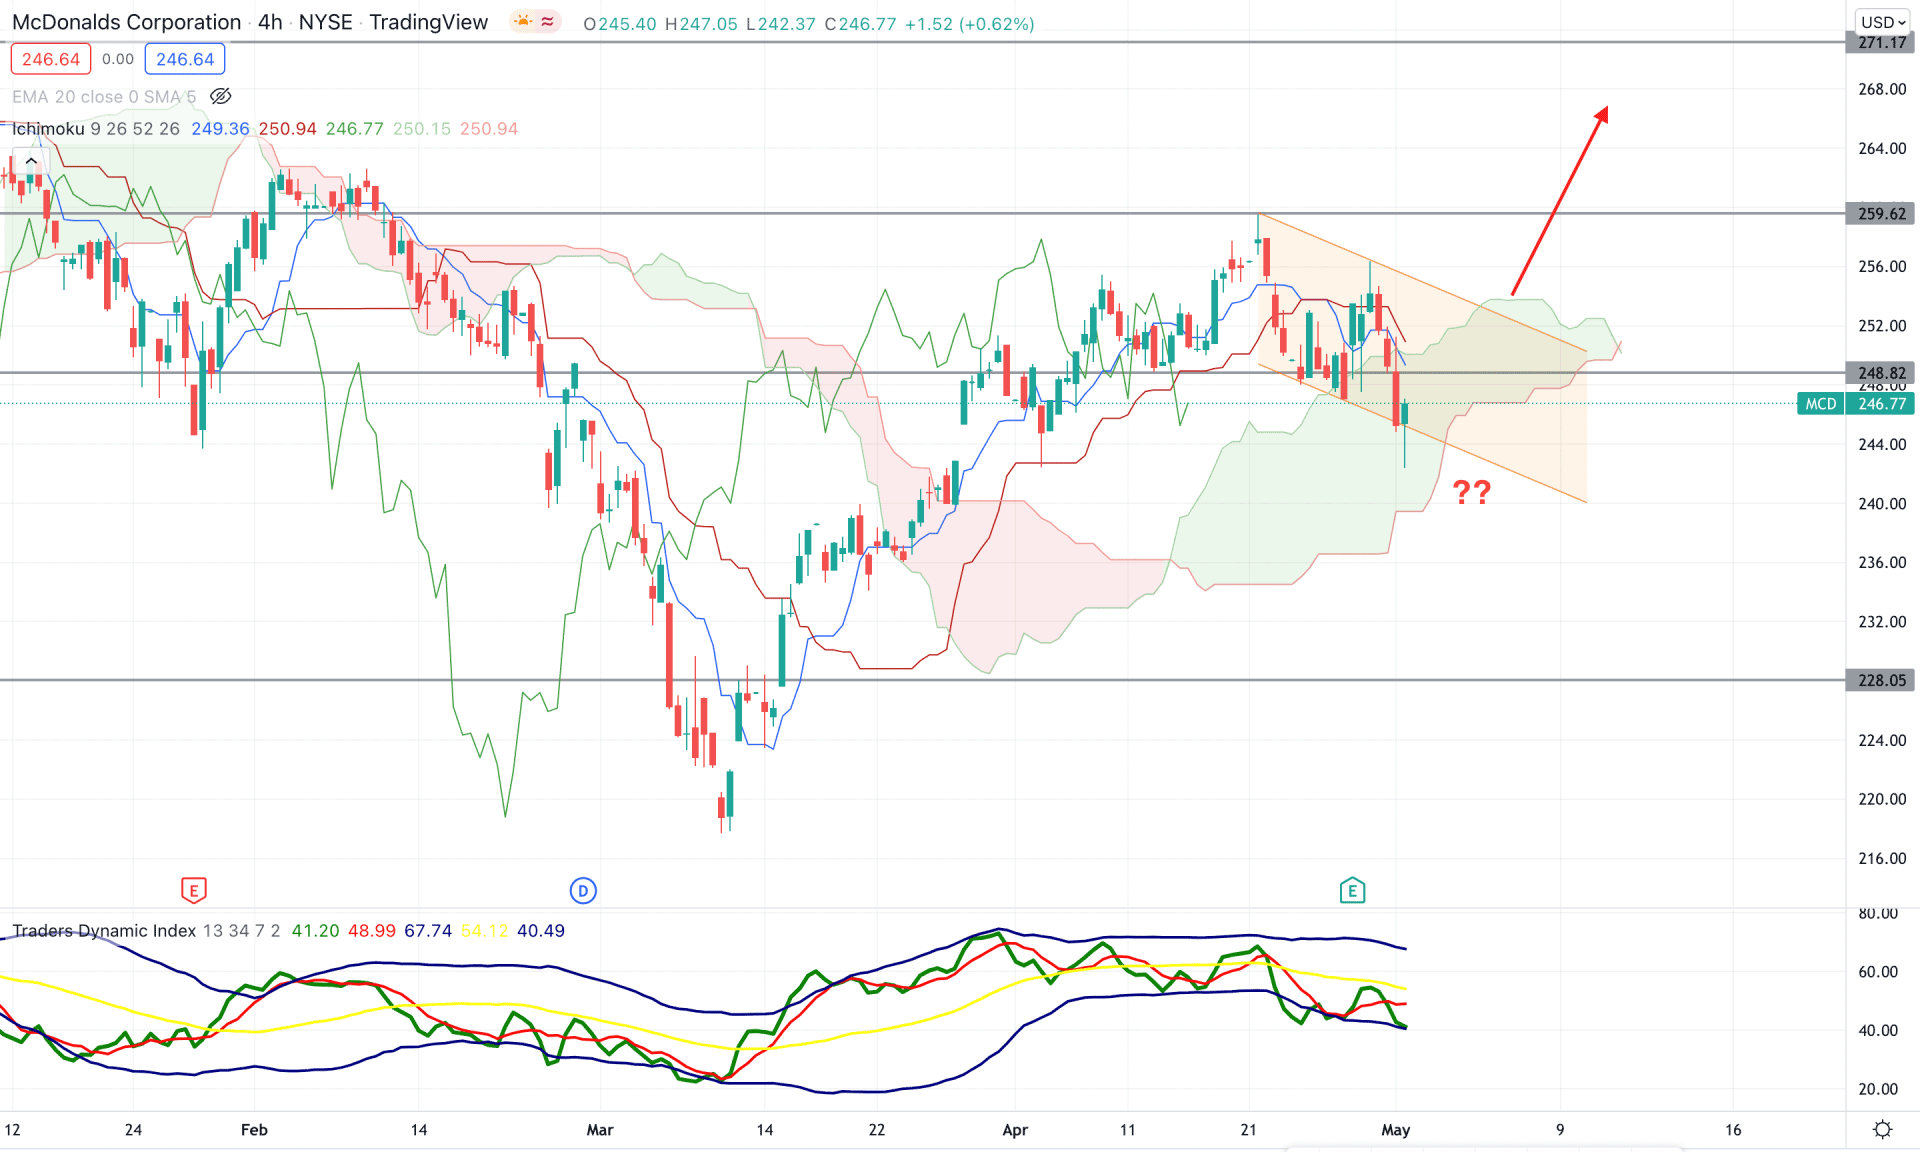
According to the Ichimoku Cloud analysis, the MCD intraday trend is still bullish and needs to move below the cloud support to match the daily chart’s selling possibility. The current price trades within a bearish channel where the false break below the channel support raises the question regarding its selling possibility. In the future cloud, the Senkou Span A and Senkou Span B are closer together, indicating that a strong breakout may set a stable trend in the H4 chart.
The above image shows the H4 chart where the Traders Dynamic Index is still bearish, indicating that bears control the price. Moreover, the dynamic Tenkan Sen and Kijun Sen are still above the price that may work as minor resistance.
Based on the H4 structure, any bearish rejection from dynamic Kijun Sen with an H4 close below the Cloud level would be a bearish opportunity towards the 228.05 level. On the other hand, any rebound and a bullish H4 candle above the bearish channel would be an alarming sign for bears that may raise the price towards the 271.17 level.
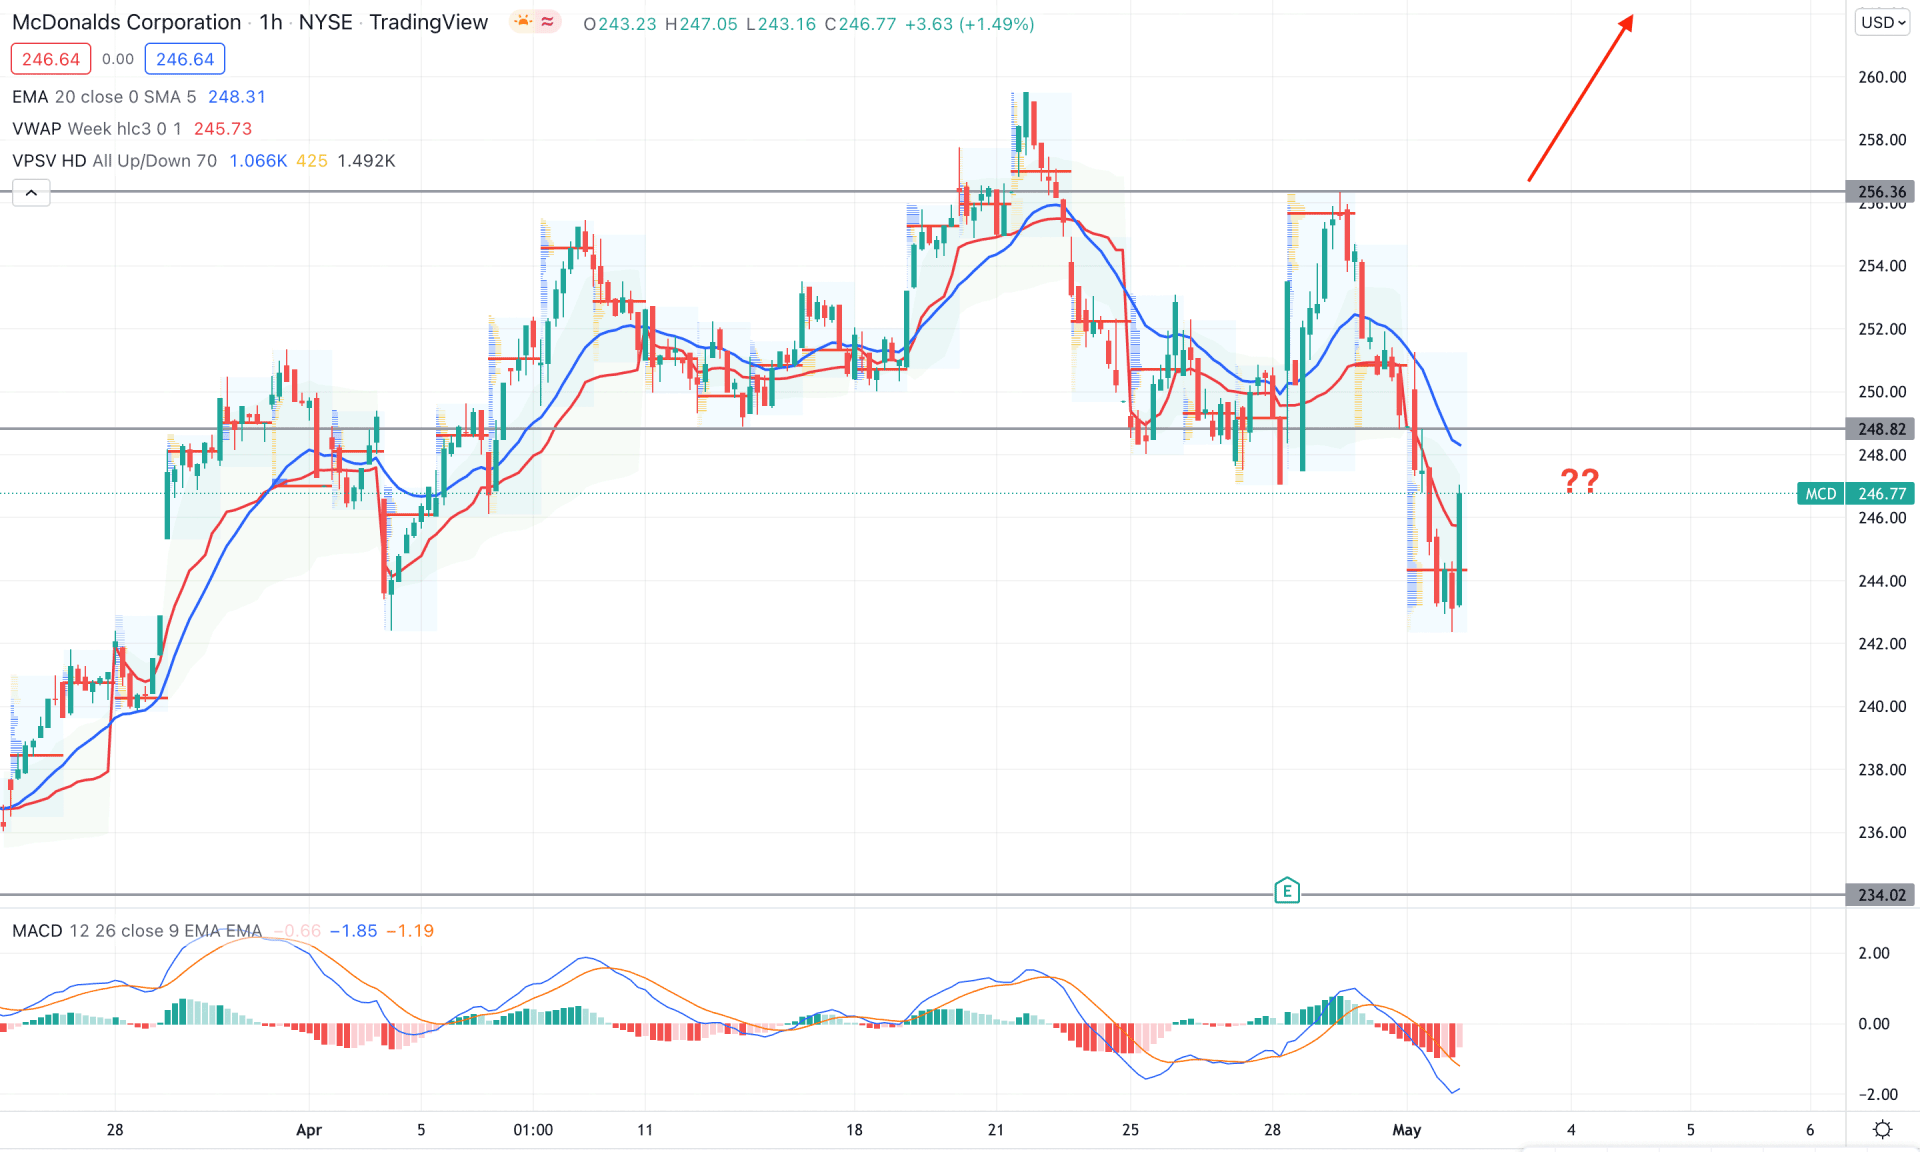
According to the intraday chart of McDonald’s stock, the current price is facing bearish pressure from the neckline breakout of the head and shoulder pattern. Moreover, the dynamic 20 EMA is still above the price that may provide a confluence resistance besides the 248.82 static level. However, the last bullish candle that eliminated the previous 4 candles' bodies came with a strong volume which is the major barrier for sellers.
The above image shows how the MACD Histogram turned bearish, followed by the H/S neckline breakout. However, the immediate rebound from the 242.37 swing low with a candle close above the dynamic weekly VWAP might violate the Head and Shoulder breakout at any time.
In that case, investors should closely monitor the intraday price action at the 248.00 to 257.00 area from where a trend-changing event may occur. Any bearish rejection with a candle close below the 248.00 level would be a bearish opportunity for this instrument. On the other hand, an impulsive bullish breakout above the 257.00 would extend the current long-term bullish trend.
As per the current market context, MCD is more likely to move down as it showed a Head and Shoulder neckline breakout. However, the long-term price direction is still bullish, where the violation of the H/S pattern would be a profitable bullish opportunity.