
Published: June 16th, 2021
Mastercard started 2021 with a bullish volatile structure that brought investors the taste of $400.00 per share for the first time. Moreover, the stable growth in earnings with a strong position in cash flow and liquidity may consider it a reliable investment opportunity.
Mastercard stock has a history of providing more than 29% annual return in the last ten years with stable growth of earnings per share of 16%. However, during the COVID-19 pandemic, the company faced a hard time.
In 2020, the revenue got hurt by the economic downturn due to the travel ban and imposed lockdown. However, Mastercard stock gained 20% profit last year where the major benefit came from contactless payments. Moreover, Gross payment volume increased and was reported at $1.7 trillion in Q1, 8% above last year’s result.
Another strength of the company is that it generates money from fees paid for every transaction. Therefore, the company receives the payment immediately and does not require to wait a long time, which reduces the credit risk. Moreover, the immediate receipt of payments allow the company to have a strong liquidity position. In 2020, the company generated $6.3 billion free cash flow with a 109% return on equity.
The stable growth in earnings, strong cash flow, and the post-Covid recovery are signs that Mastercard stock can make a new all-time high above the $400.00 level.
Let’s see the future price direction from the Mastercard Stock technical analysis:
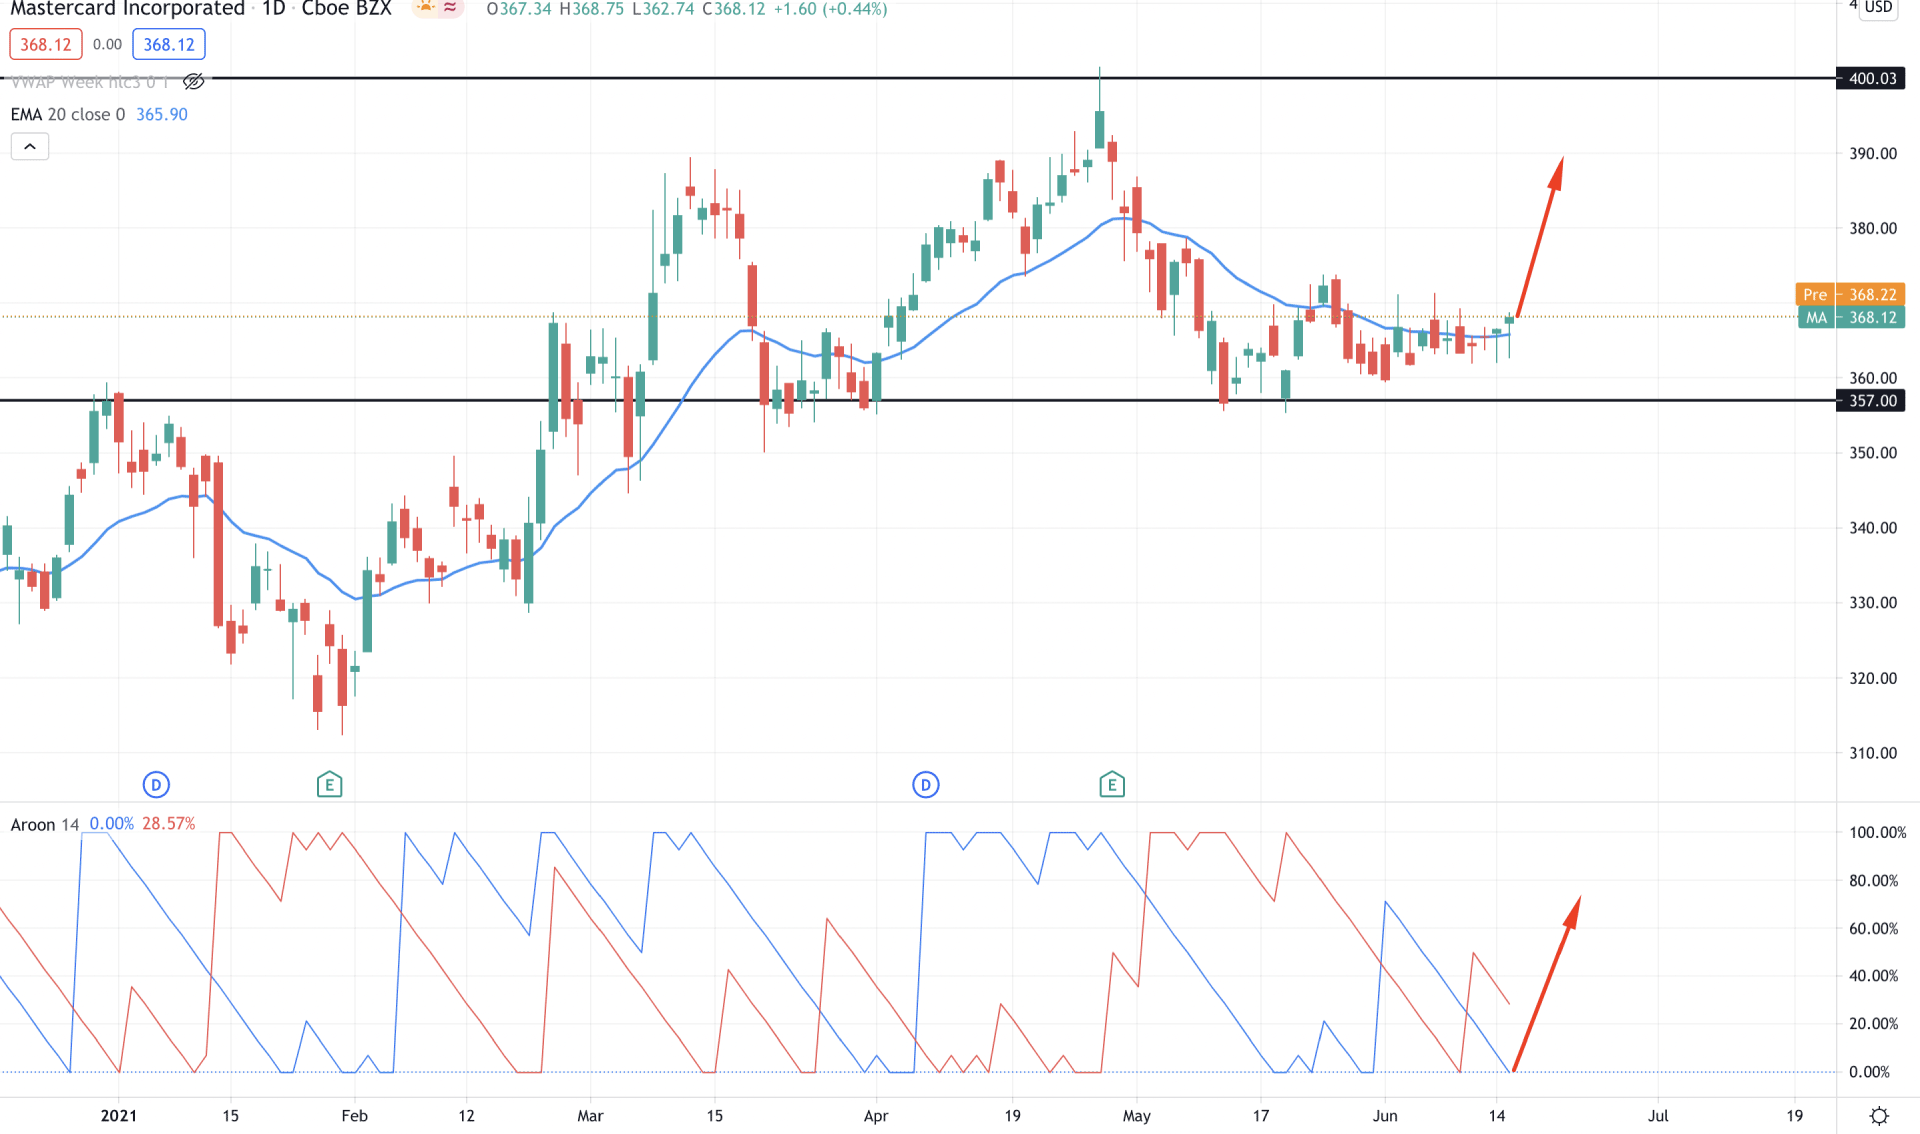
Mastercard bulls remain active in the price since February 2021 and took the price towards as high as $390.00. Later on, the price corrected lower and got supported from the 357.00 event-level before testing the all-time high at the 401.37 level. The most recent price is very corrective above the 357.00 event level. Therefore, as long as buyers hold the price above this level, it may reach the 400.00 level again in the coming days.
In the above image, we can see the daily chart of Mastercard stock where the price is very corrective and trading at the dynamic 20 EMA area. On the other hand, in the indicator window, Aroon Up (blue line) is at zero levels. If the Aroon Up crosses over the Aroon Down (red line), the price may continue the bullish movement towards the 400.00 level.
Therefore, investors should closely monitor the current price action of the Mastercard stock where any strong bullish daily close above the dynamic level of 20 EMA may initiate a bullish trend.
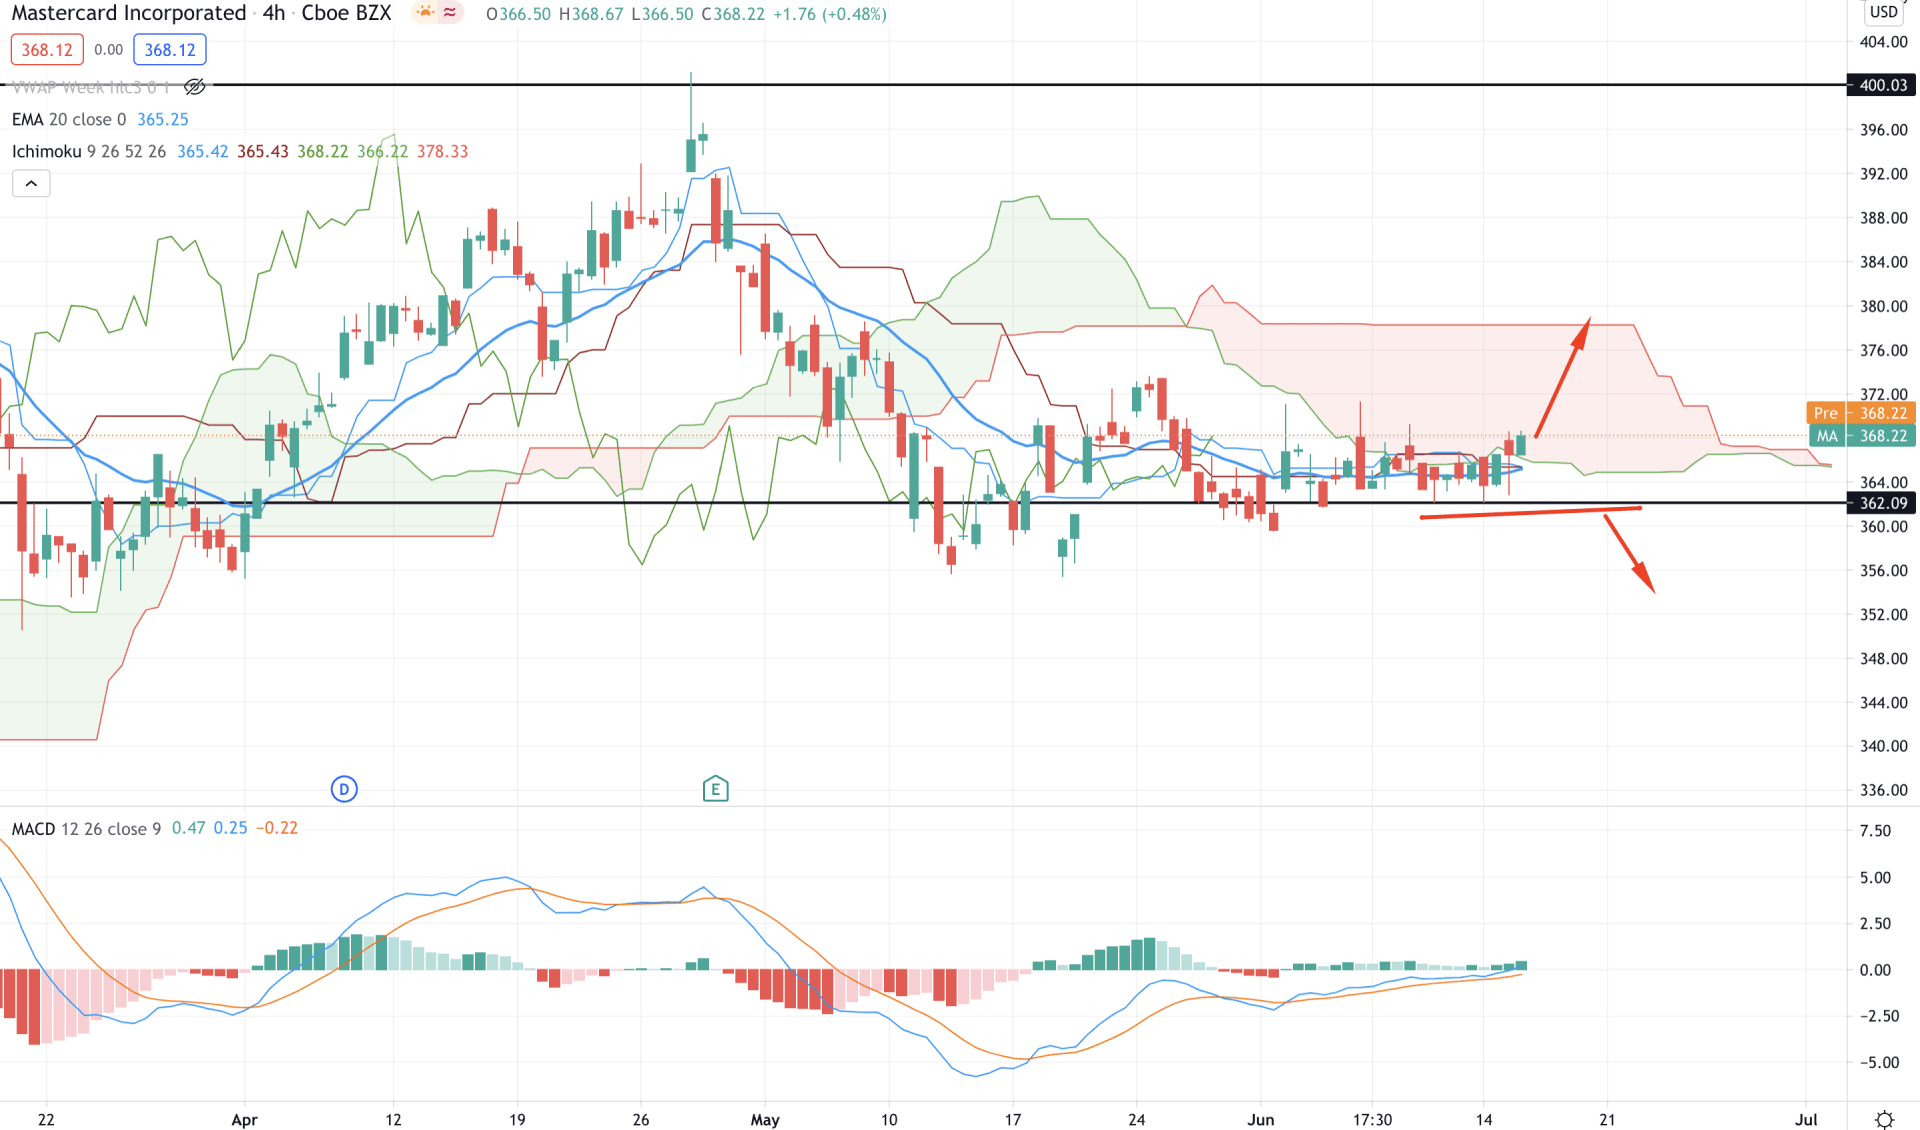
If we plot the Ichimoku Kinko Hyo in the Mastercard Stock H4 chart, we would see that the price is still trading on bears’ territory. There is a shift in the trend that is progressing in the future cloud, indicating that buyers need to wait and see more confirmations in the price.
In the above image, we can see that the dynamic Tenkan Sen and Kijun Sen are flat and close to the price, indicating that the price is going through a correction. Here the most immediate support is at the 362.09 level, where any strong bearish H4 close below this level may initiate a bearish pressure to the price towards 340.00 level.
On the other hand, MACD Histogram is still bullish and making new highs. Therefore, any new high in the price above the 370.00 level may create a short-term bullish pressure towards the 384.00 level.
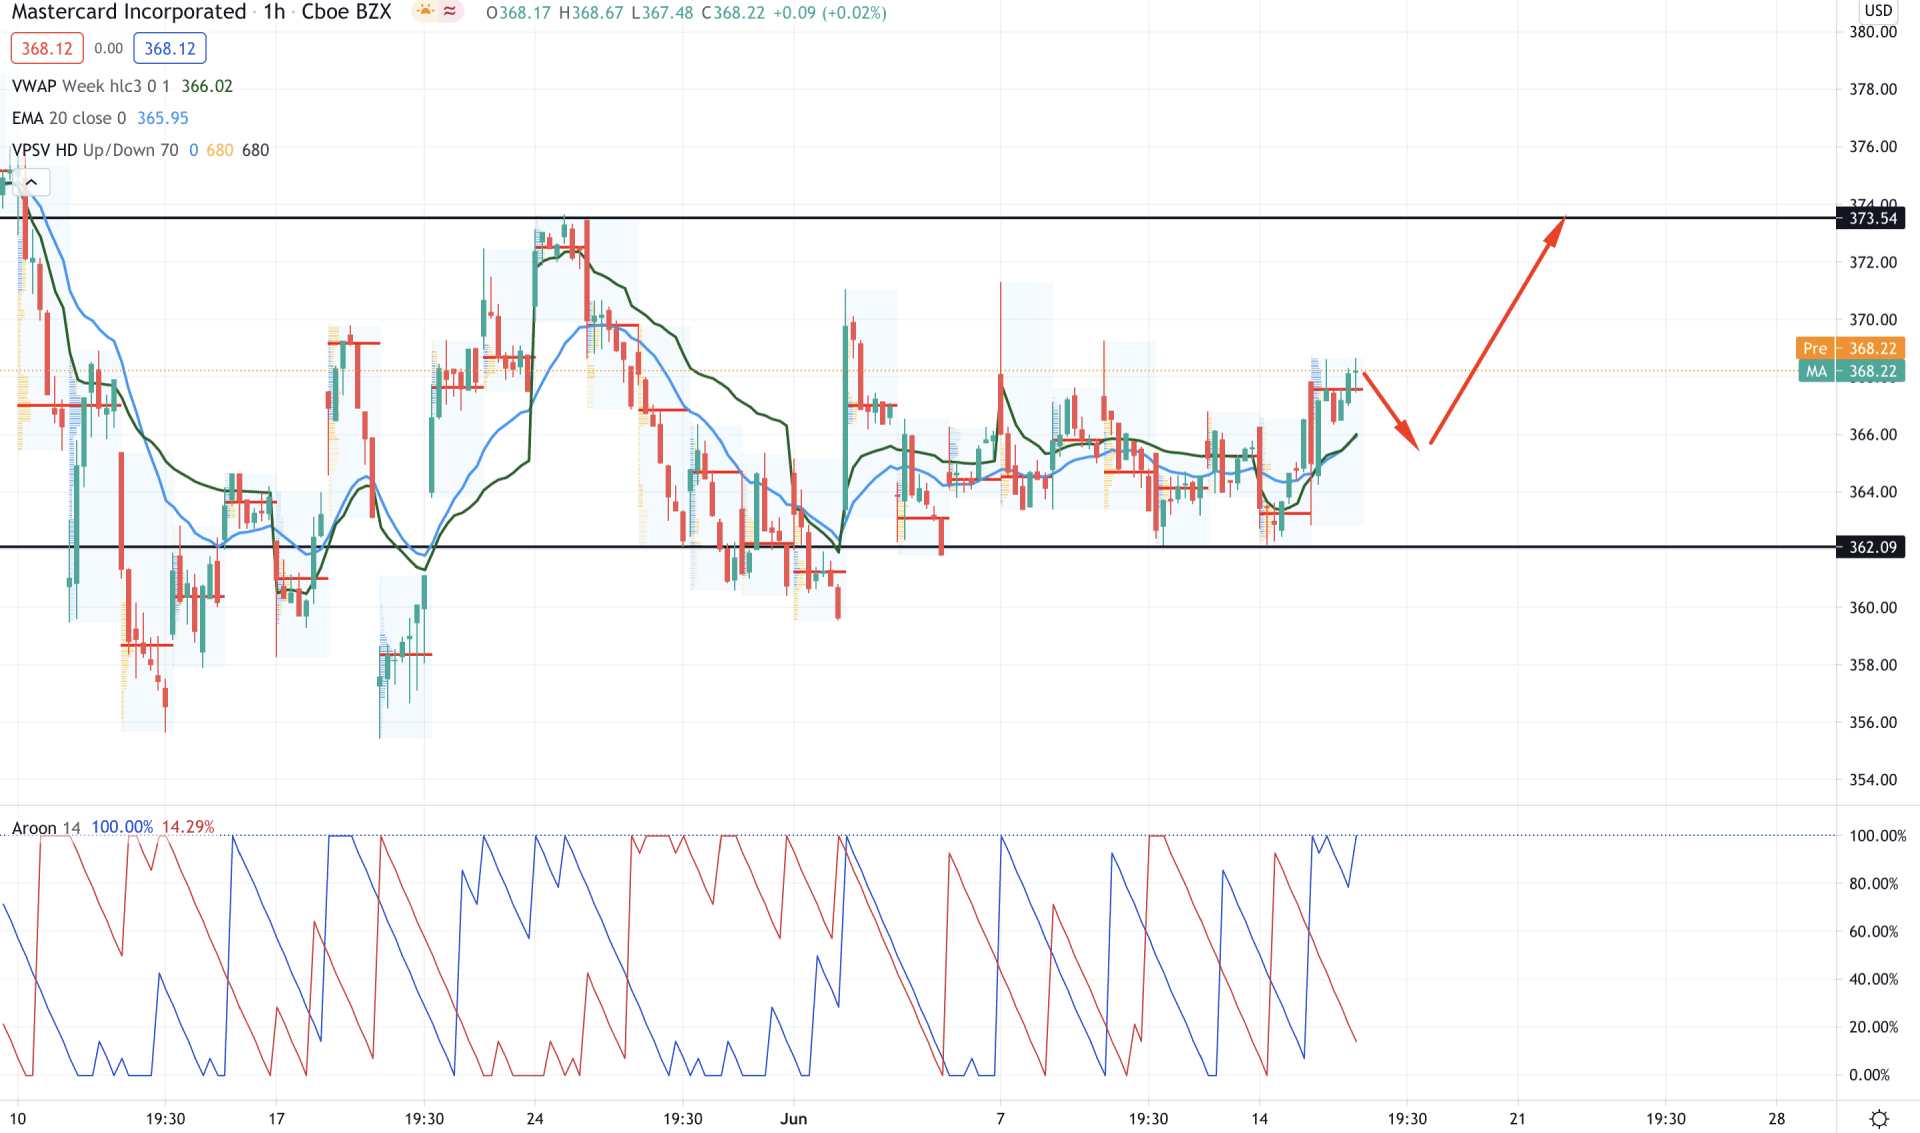
In the intraday chart, Mastercard stock is trading above the intraday support of 362.00 level. However, the sessional high volume levels showed that the price moves within volatility as there is no significant movement from the recent high volume levels.
In the above image, we can see the H1 chart of Mastercard stock where the most recent price is trading above the dynamic 20 EMA and vwap. Therefore, as long as the price is trading above this level, it has a higher possibility of testing the near-term resistance of 373.54 level.
Aroon Up is above the Aroon Down and reached 100 levels in the indicator window, indicating that the short-term bullish trend is strong in the price. However, a strong bearish H1 close below the dynamic vwap may alter the current market structure and create volatility in the price. In that case, traders should wait for selling signals in the H4 chart.
As of the above discussion, we can say that the Mastercard stock has a higher possibility of moving higher following its strong fundamental outlook and bullish trend. The primary target of the bullish pressure will be 400.00 level, and above this level, the next target would be 450.00 level.
Conversely, the price is still unstable and trading near the Kumo Support level. Therefore any strong bearish H4 close below the 362.09 support level would be a selling opportunity for traders with the target of 340.00 level.


