

Published: August 12th, 2026
Mantle's token price isn't keeping pace with the ecosystem's rapid growth. The network itself is quietly solidifying its position in the tokenised real-world asset space, even as MNT continues to bleed on the charts. It serves as yet another reminder that coin efficiency and infrastructure growth are not always correlated.
Mantle is now the biggest Layer-2 in the category and the fourth-biggest network by Tokenised Active Strategies, according to a recent report.
By the end of the most recent quarter, Mantle held more than $1 billion in DeFi TVL and had a stablecoin market capitalisation of $955 million. Active strategies, as opposed to passive tokenised exposure, show capital that is actively used through platforms, tools, and investment managers.
Mantle wants to do more than just host tokenised assets. Developing the trading infrastructure around them is becoming more and more important to their application stack.
Let's see the full outlook from the MNT/USDT price analysis:
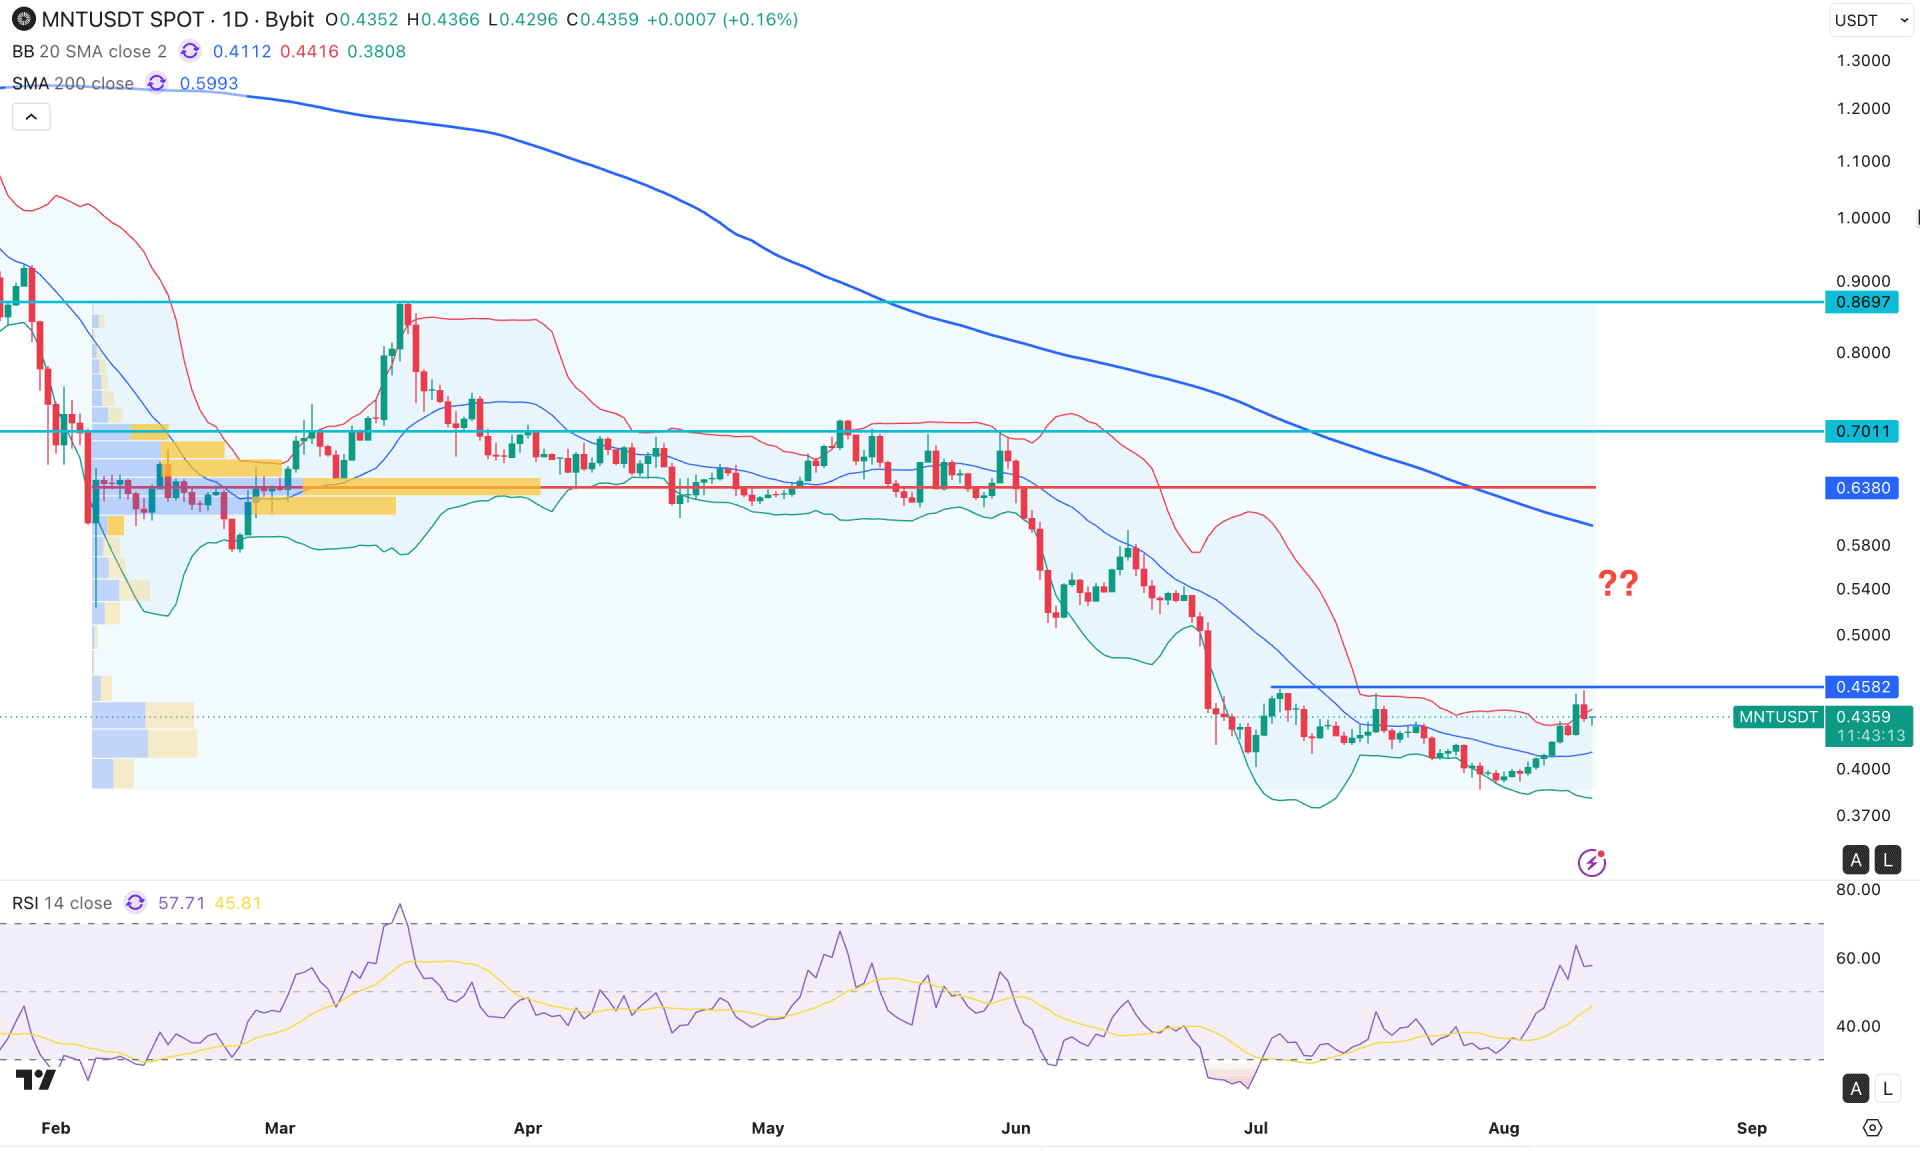
On the daily chart of MNT/USDT, the market momentum is bearish, as the price continues to decline, forming consecutive lower lows. Moreover, the price broke below the July 2025 low and showed no significant bullish rebound. As a result, the ongoing selling pressure is still active and can extend in the coming days.
In the monthly timeframe, a bullish recovery is visible as the existing monthly candle has formed an inverted hammer at the bottom. Moreover, the ongoing price action is bullish, as no significant low is visible below the inverted hammer low.
The weekly timeframe represents extreme sideways momentum, which is backed by a bearish impulsive wave. In that case, a bullish recovery might need proper validation through a breakout above the hammer high before considering a trend change.
In terms of volume, sellers are still dominating the price. The most active level is the February 2026 session at the 0.56380 level, which is well above the current price.
In the most recent price action, a failure to hold below the lower Bollinger Band is visible, with multiple attempts to recover. As a result, the price rebounded and closed near the upper Bollinger Band level. The 200 SMA is above the current price and has a bearish slope, signalling an overall bearish trend.
In the secondary indicator, the Relative Strength Index is near the 70 area, signalling buying pressure in the market with no sign of divergence.
Based on the overall market structure, the price is trading at a resistance area. A break above the 0.4582 level could validate a long opportunity, targeting the 0.6380 high-volume level.
On the other hand, sufficient buy-side liquidity is present above the 0.4582 level. In the case of a bullish break followed by an immediate rebound below the upper Bollinger Band line, the existing bearish market trend may resume. In that case, the primary aim would be to test the 0.3871 swing low before moving below the 0.3000 area.
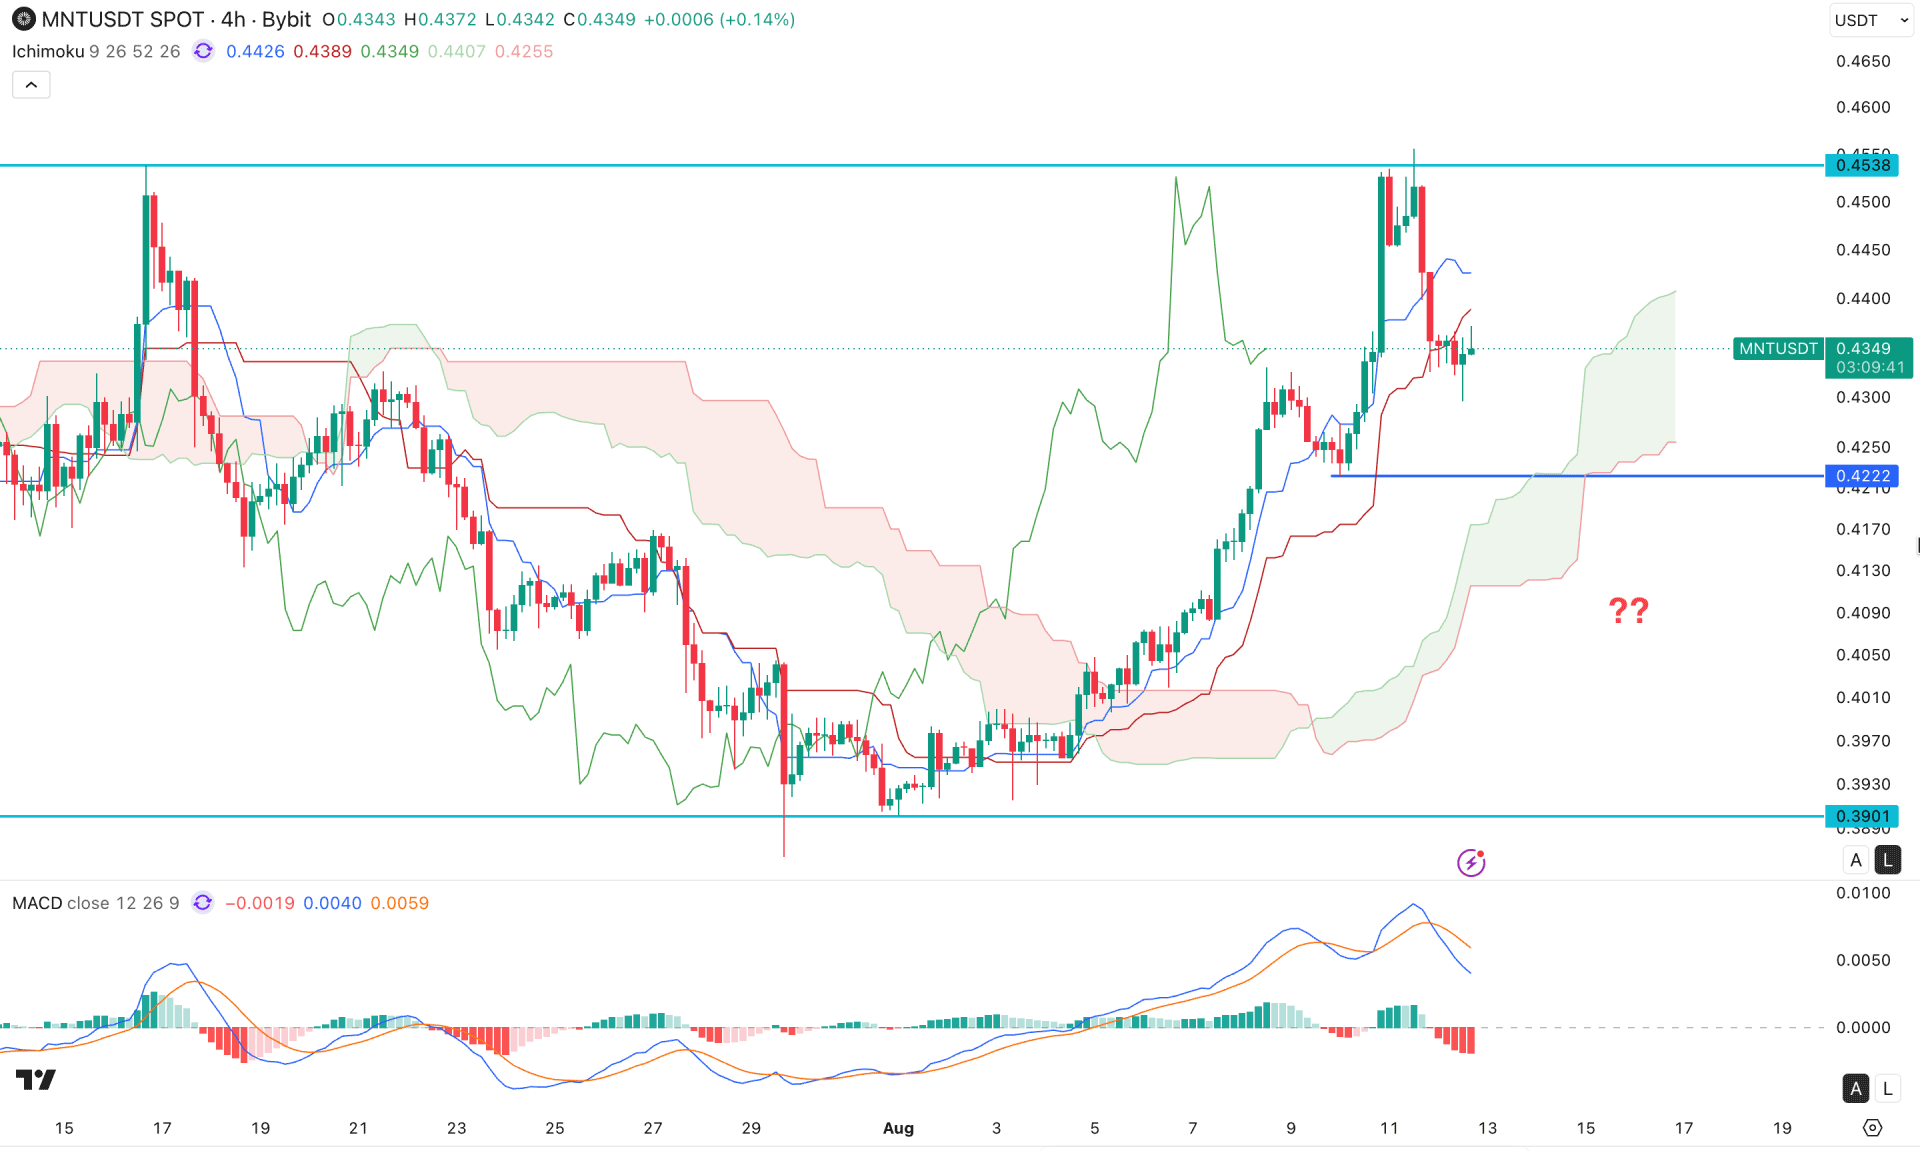
In the four-hour timeframe, MNT/USDT is expanding buying pressure from a valid bullish Kumo Cloud breakout. As a result, the price made consecutive higher highs but failed to hold the momentum after visiting the July 2026 high.
In the future cloud, both lines are moving upward, suggesting bullish continuation. However, dynamic levels are closer to the current price, but sufficient buying pressure is not visible.
In the secondary indicator window, the MACD histogram maintains downside pressure by forming consecutive lower lows below the neutral line. Moreover, the signal line is at the bullish peak area, from where a bearish crossover is visible.
Based on this market outlook, the overall structure remains bullish, even if a buy-side liquidity grab is evident from the 0.4538 resistance level. As long as the price remains above the Kumo Cloud area, a bullish rebound with a four-hour close above the Kijun-sen level could resume the existing trend at any time.
On the bearish side, the immediate support to look at is the 0.4222 level, which needs to be breached before heading towards the 0.3901 level.
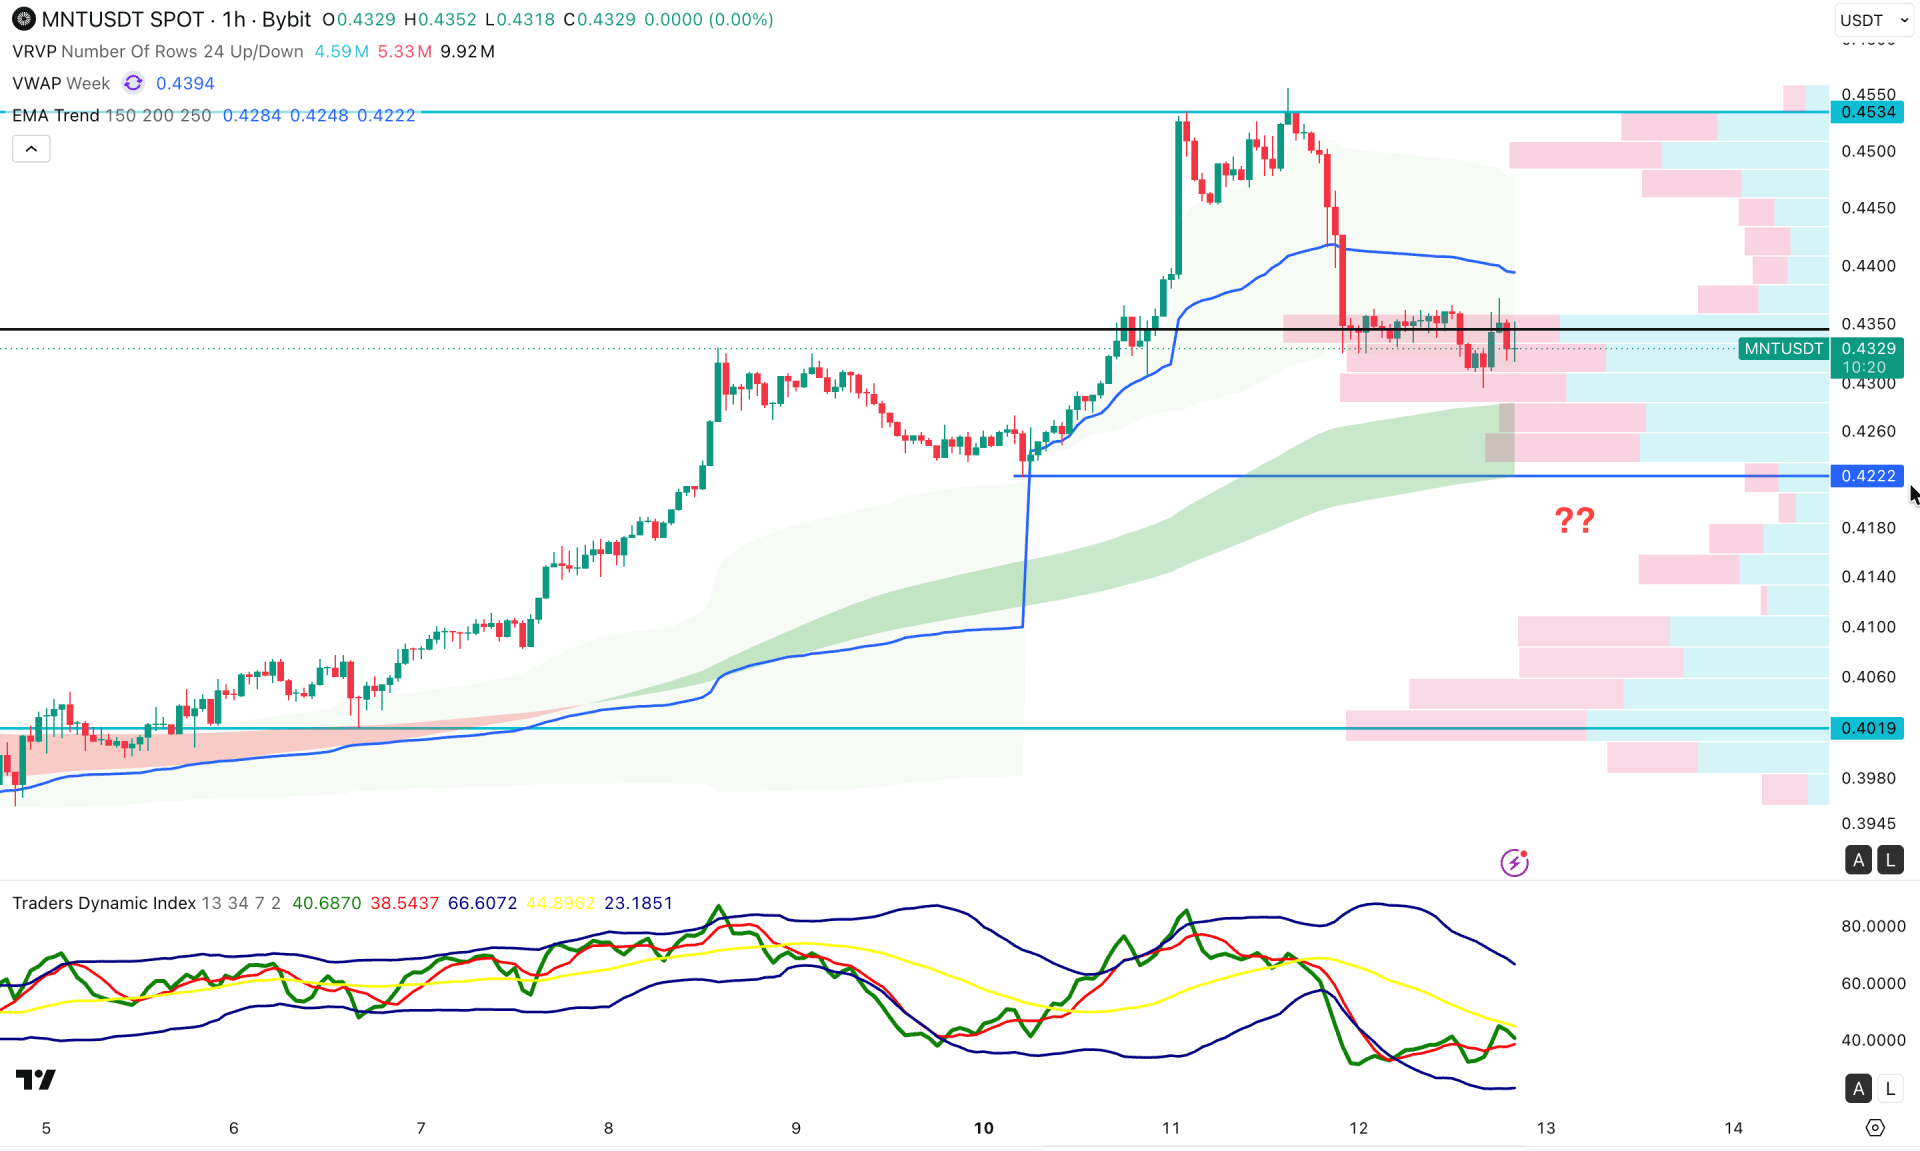
In the hourly timeframe, MNT/USDT is trading within an EMA wave, while the current price is sideways after creating a new swing high above the 0.4534 level. As the most recent price action is sideways, with the Ichimoku cloud line closer to the current price, a valid breakout is needed from the ranging market before getting a new impulsive wave.
In the secondary indicator window, the Traders Dynamic Index is moving below the 50.00 neutral level, suggesting active selling pressure in the market. Moreover, the weekly VWAP is pushing the price towards the seller side by remaining above the current price, while the EMA wave is a barrier to watch.
Based on the overall market outlook, the near-term support level to look at is the 0.4200 level, which is a crucial barrier for sellers. A break below this line could open room for testing the 0.4019 level.
On the other hand, ongoing buying pressure with bullish continuation is possible. A recovery above the weekly VWAP level could open room for moving beyond the 0.4600 level.
Based on the market structure, MNT/USDT is testing double-top resistance, from where a bearish daily candle is visible. As the recent bullish recovery is insignificant to consider a trend reversal, investors should look for a valid bullish breakout before anticipating further continuation. As long as the short-term resistance level is protected, the primary anticipation would be to look for short trades only.


