
Published: February 22nd, 2024
Maker (MKR) functions as the governance token for MakerDAO and the Maker Protocol, operating as a decentralized organization and software platform built on Ethereum, respectively. These platforms enable the issuance and management of the DAI stablecoin.
Established in 2015 and fully operational since December 2017, MKR tokens confer voting rights within the organization, allowing stakeholders to influence Maker Protocol's evolution. Despite lacking dividend payouts, MKR tokens are expected to appreciate alongside DAI's success.
Maker stands as a leading force in decentralized finance (DeFi), pioneering the development of decentralized financial products on smart-contract-enabled blockchains such as Ethereum. Recent market trends show MKR experiencing a significant uptrend attributed to successful buybacks and increased DAI utilization, while discussions revolve around potential Solana integration and the ongoing need for improved Oracle solutions in DeFi.
Additionally, Maker remains vigilant amidst regulatory developments and global technological expansions. It might poise to seize opportunities for growth and innovation in the evolving landscape of decentralized finance.
Let's see the upcoming price direction of this coin from the MKR/USDT technical analysis:
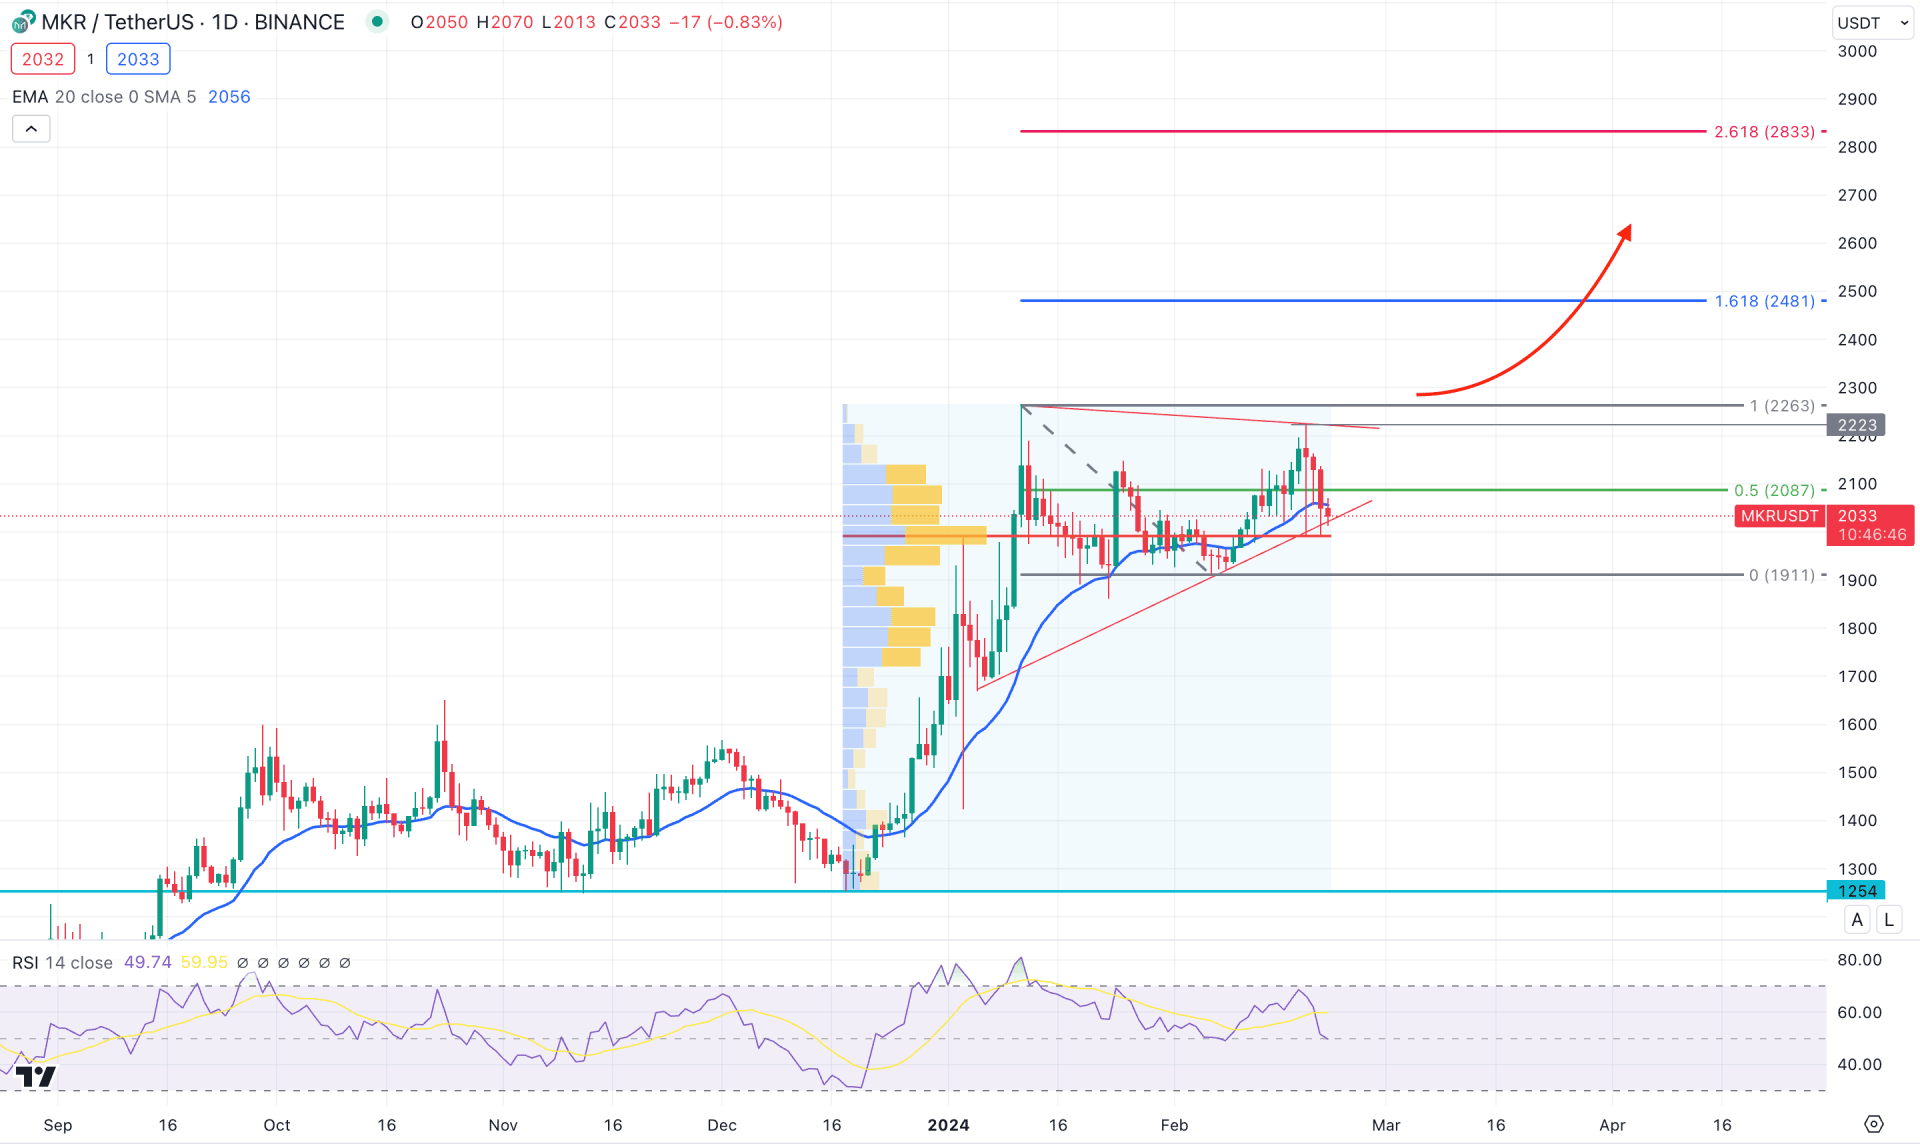
In the daily chart of MKR/USDT, an ongoing bullish momentum is valid where a possible top is set at the 2263.00 level. As the recent price hovers below the crucial top, investors should monitor how the price reacts in the coming days.
In the higher timeframe, a strong bullish continuation, followed by a re-accumulation is visible in the monthly chart, with a clearer view in the weekly timeframe. However, the recent weekly price shows a bearish two-bar reversal pattern even if the long-term trend is bullish. A valid bearish closed as an engulfing pattern could offer a decent downside possibility for the coming weeks.
Following the weekly price action, an ongoing bullish re-accumulation could eliminate the downside possibility at any time, as suggested by the new high volume level formation. According to the Fixed range high volume level indicator, the most active level since 18 December 2023 is at the 1990.00 level, which is just below the current price. As the current price holds the buying pressure above the high volume level, a potential bullish continuation is possible, depending on the price action.
In the daily chart, technical indicators are indecisive, where the 14-day RSI remained neutral at the 50.00 point. The Average Directional Index (ADX) represents a corrective pressure by moving below the 20.00 level, while the Momemtun reached the negative zone.
Based on the current daily outlook, the high volume level and dynamic 20-day EMA would work as confluence bullish factors for this pair. Moreover, the ongoing order building within the bullish pennant pattern might result in a bullish continuation opportunity. In that case, a valid daily close above the 2223.00 resistance could activate a pennant breakout and extend the buying pressure at the 2481.00 Fibonacci Extension level. Above this line, the next resistance is at the 2833.00 level.
On the bearish side, the volatility at the top needs a proper bearish breakout before signaling a pump and dump. A valid bearish exhaustion at the 2100.00 level with a daily close below the 1911.00 level might open a short opportunity, targeting the 1400.00 level.
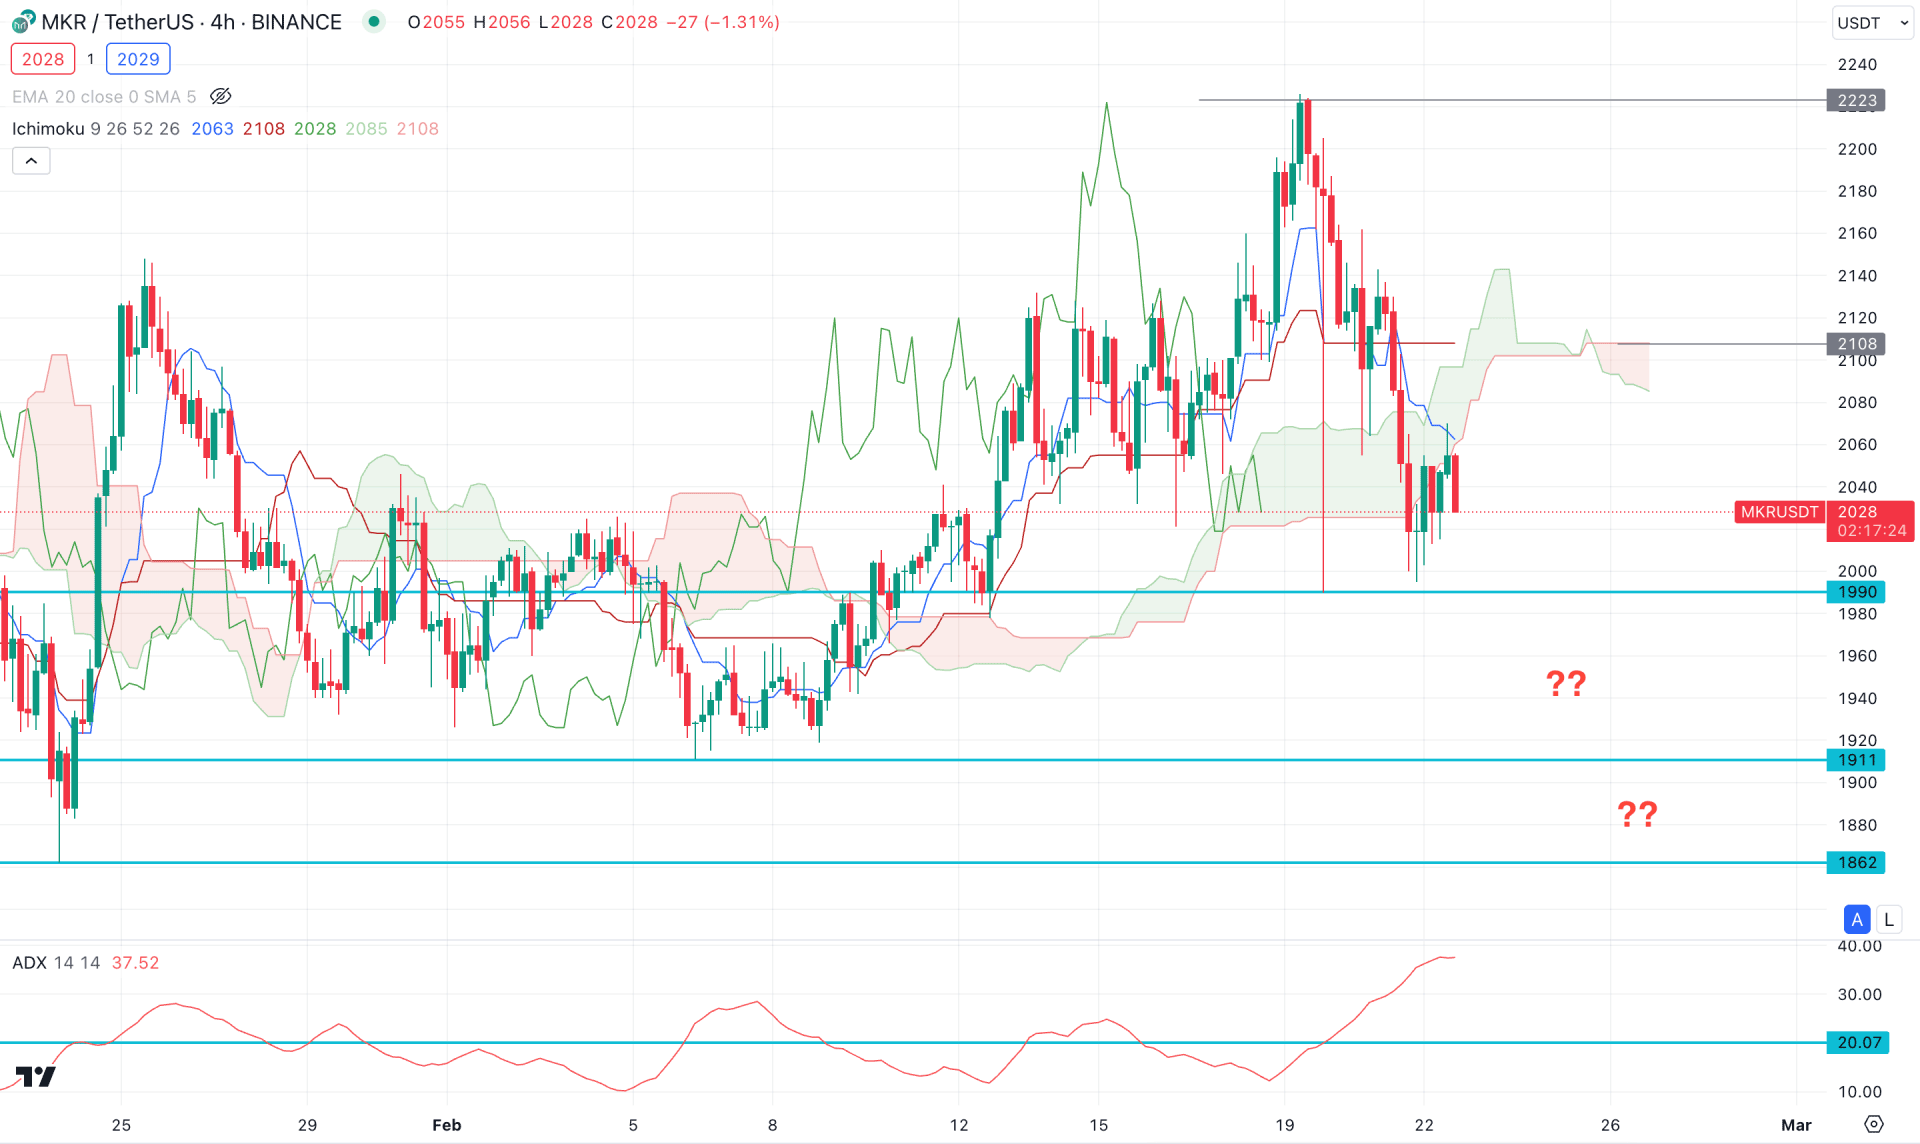
In the H4 timeframe, the recent price struggles to hold the selling pressure below the dynamic Ichimoku Cloud area. Moreover, the recent static support of 1990.00 is still protected.
In the future cloud, the Senkou Span B remained flat with the dynamic Kijun Sen level, while a bearish crossover is visible among dynamic lines.
Based on this outlook, an immediate downside pressure with a liquidity sweep from the 1990.00 to 1900.00 area could be a valid long opportunity in this pair. In that case, the conservative long approach would be to seek a stable market above the Kijun Sen level after the sweep.
On the bearish side, a stable downside pressure with a daily close below 1900.00 could signal more downside possibilities, targeting the 1800.00 area.
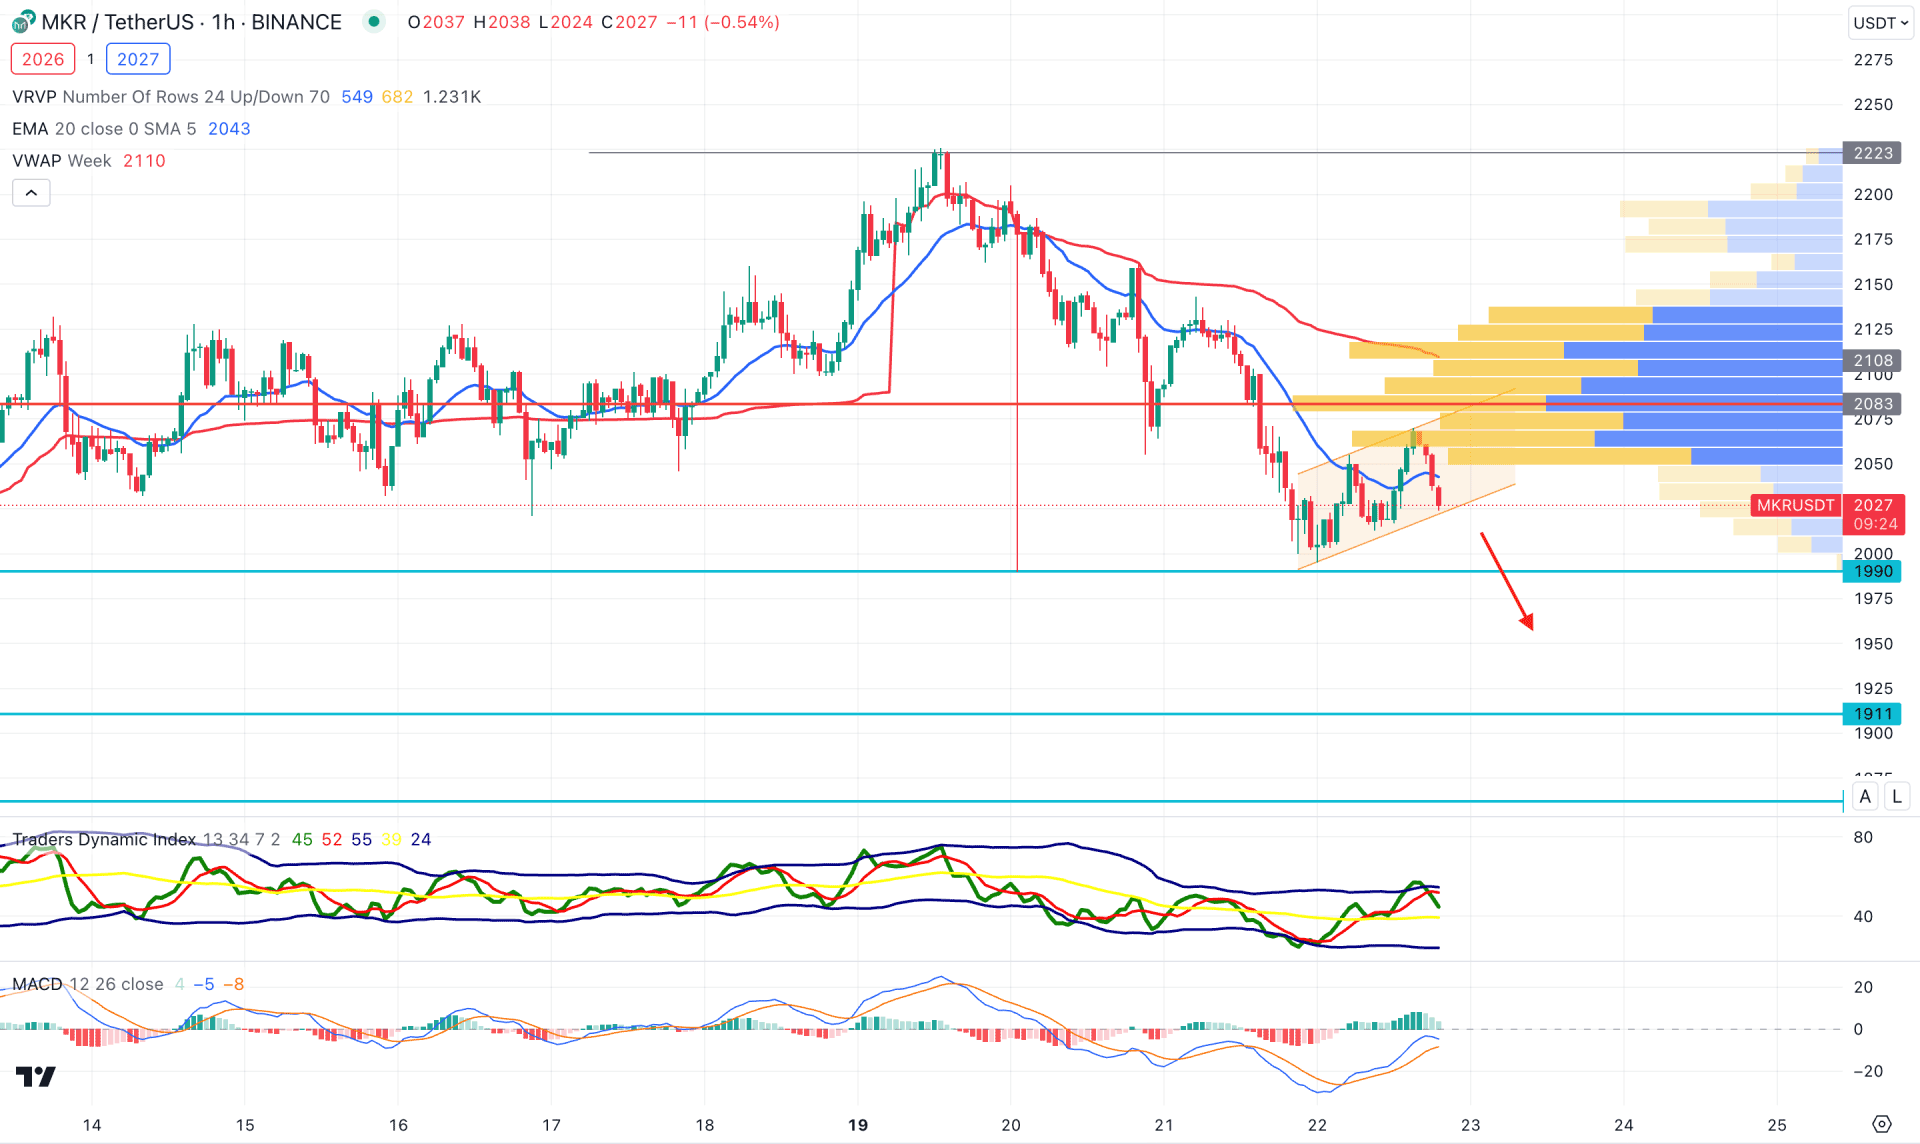
In the hourly chart, the recent price trades within an ascending channel, while the dynamic weekly VWAP is a critical resistance. Moreover, the visible range high volume level is above the current price, working as a resistance.
In the indicator window, the Traders Dynamic Index (TDI) rebounded from the overbought level, while the MACD Histogram was at the neutral point.
Based on this outlook, a daily candle below the 1990.00 static level could be a short opportunity, targeting the 1900.00 area.
A bullish recovery is also possible, but it needs a solid breakout above the VWAP resistance with a stable market before aiming for the 2300.00 level.
Based on the current multi-timeframe analysis, MKR/USDT might extend the momentum after having a solid trendline breakout. As the intraday chart suggests a selling pressure, a solid buyer's attempt with a bullish rejection from the near-term support area could be an early long opportunity.


