
Published: October 13th, 2022
Around the POC (Point of Control), the LUNC price shows a tight consolidation, which indicates a lack of volatility. However, the upcoming scheduled Binance’s LUNA burn announcement at 00:00 UTC, 10 Oct, can reason that things could spice up.
On Sep 26, after the primary announcement from Binance, the altcoin experienced a jump of 66%, which seems to be coming unaccomplished. This development is partly an underwhelming LUNC token amount being burned. Still, a significant part can be attributed to the lack of slow-paced decision-making by the Luna Foundation Group (LFG) in the smallholders compensating after the implosion of the Terra ecosystem.
It is projected that roughly 5.6 billion tokens will be burned in the first week, while the circulating supply amount is 6.1 trillion. The classic LUNA price declined by 24% between 2-6 Oct due to this amount of underwhelming.
There is almost 6,151.07B LUNC in circulation, where any news of LUNC burning could be a bullish signal for the token.
Let’s see the future price of Luna Classic (LUNC) from the LUNC/USDT technical analysis:
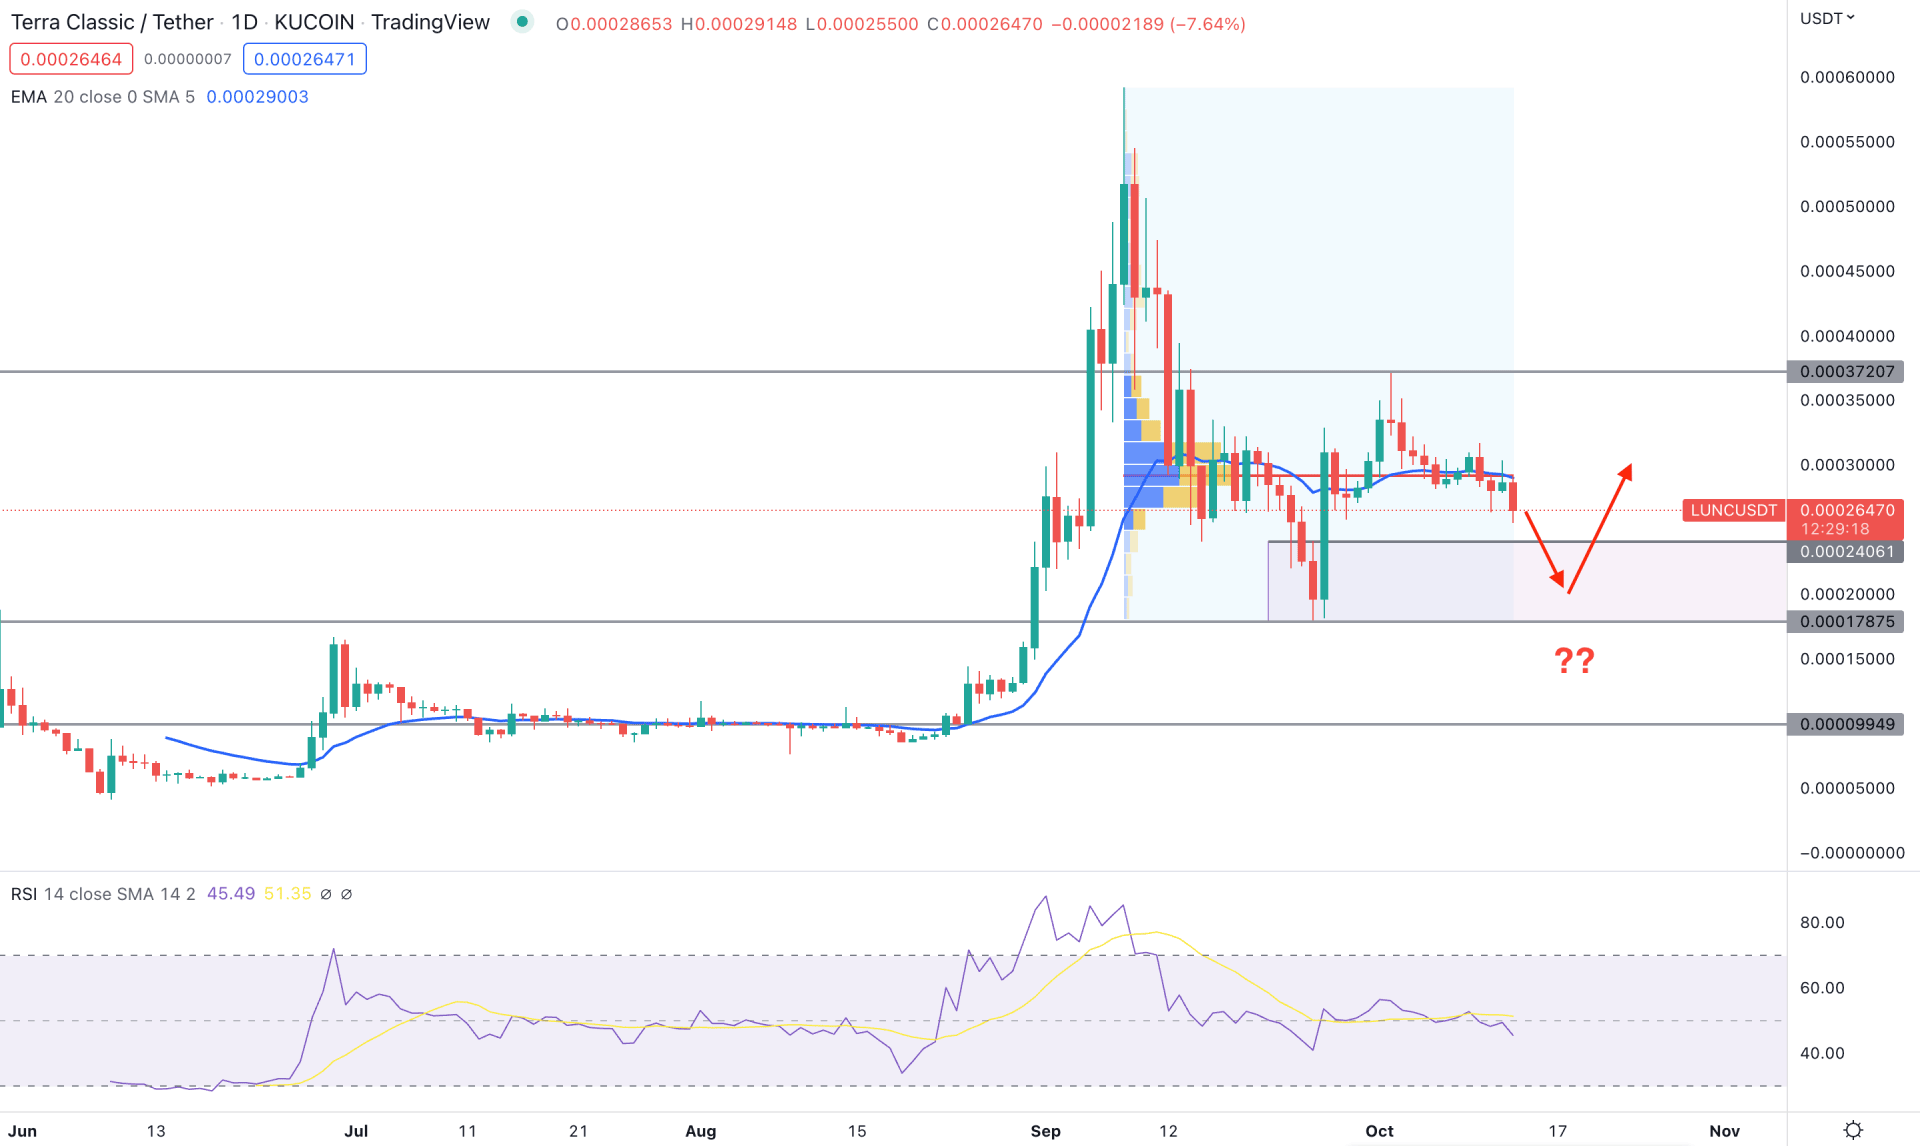
LUNC/USDT showed massive buying pressure in recent trading days, where the August 2022 low to September 2022 high came with a 600% price gain to bulls. However, the price corrected lower after finding the peak, but there is no sign of further losses.
In the most recent chart, the buying pressure came with a sell-side liquidity grab below the 0.0002406 level, which came with a solid demand zone. In that case, if the selling pressure comes within the 0.0002406 to 0.0001787 area, we may expect bulls to regain momentum.
Based on the fixed range high volume range indicator, the strongest volume level from the August 2022 low to September 2022 high is at 0.0002905 level. The 20-day exponential moving average is also above the current price and provides a confluence resistance to the high volume level.
In the indicator window, the RSI reached the 50% zone, where an attempt to reach the oversold 30% area could work as a bearish signal for LUNC.
Based on the LUNC/USDT daily price prediction, the primary idea is to find a bearish opportunity as the current price is below the 0.0002905 high volume level. In that case, the selling pressure could extend to the 0.0002406 to 0.0001787 area from where bulls may appear. However, breaking below the 0.0001700 level with a daily close could extend the loss towards the 0.0000994 support level.
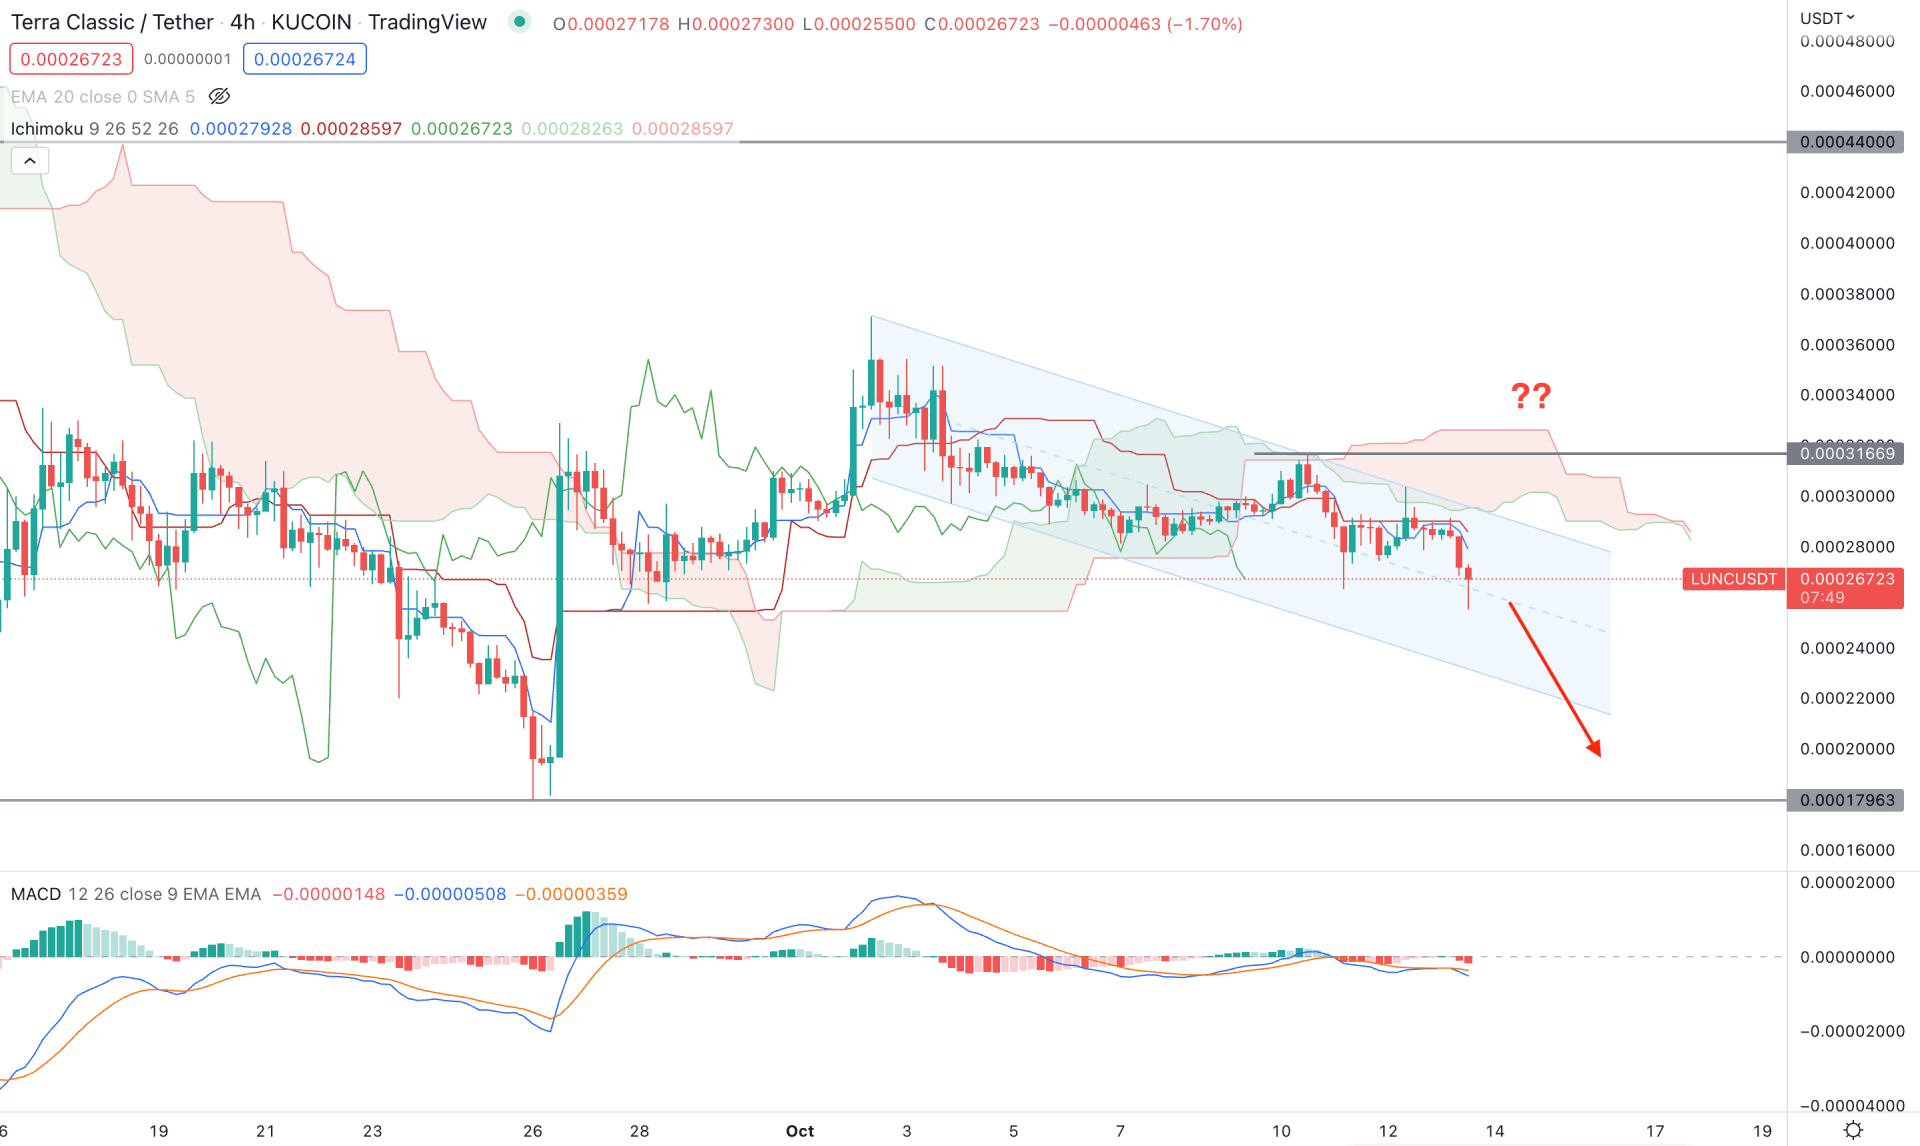
In the H4 chart, the broader market trend is bearish, but the speed of the selling pressure is not solid. The price has been below the Kumo Cloud for a considerable time, but it is moving corrective within a descending channel.
Based on the Cloud location and price action, a solid buying opportunity is valid if bulls appear with a strong breakout above the channel and hold the ground above the Senkou Span B level. However, the current future cloud’s thickness is solid for a bullish breakout, while the Lagging Span is below the price.
The indicator window shows sellers' activity in the market as the Histogram is below the neutral line. The dynamic Tenkan Sen and Kijun Sen also show a bearish signal by remaining above the near-term high.
Based on the H4 chart, sellers could regain momentum at any time as long as the price trades below the dynamic Kijun Sen line. In that case, the bearish momentum could extend towards the 0.0001796 support level.
The alternative approach is to find a bullish breakout and an H4 close above the 0.0003166 static level, which could open a long opportunity, targeting the 0.000400 key level.
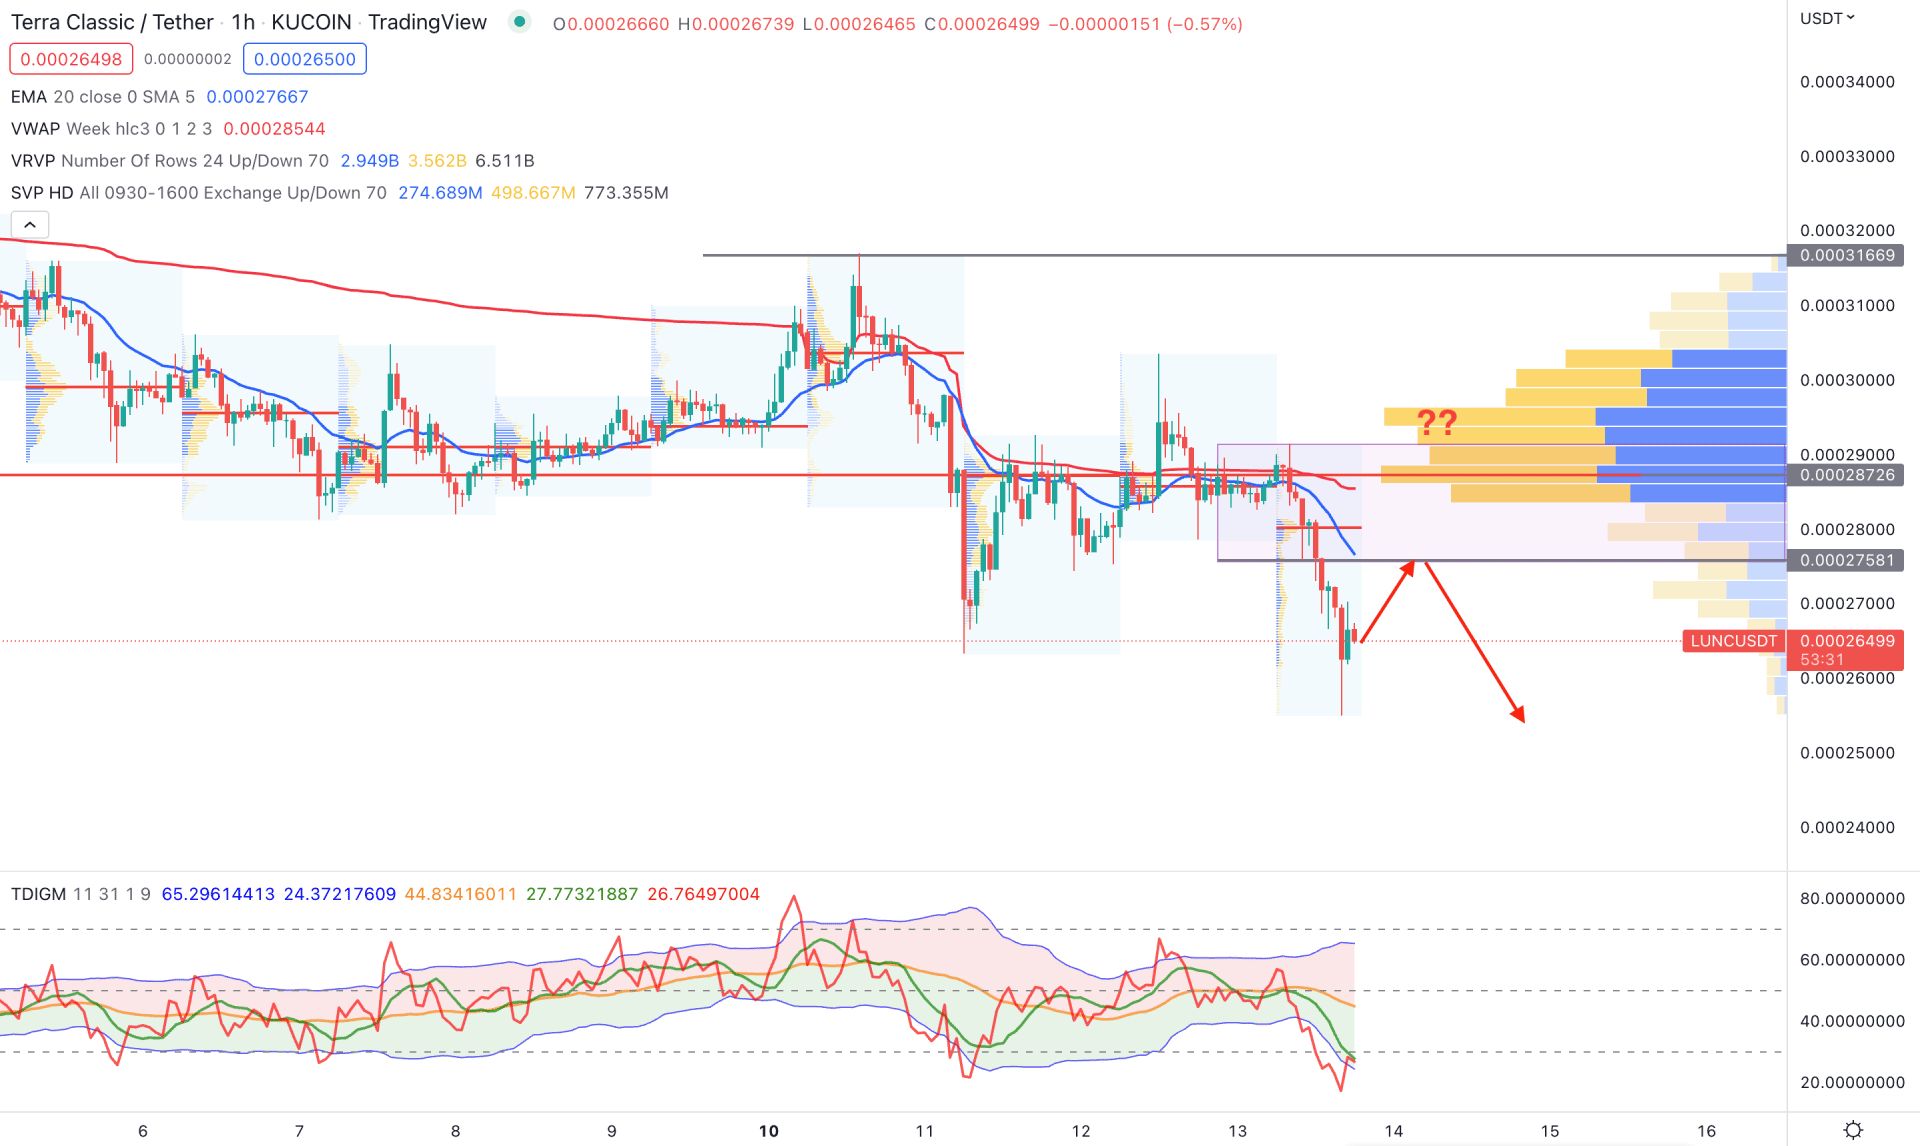
The hourly chart shows a bearish possibility as the visible range high volume level is above the price. Moreover, the dynamic 20 EMA and weekly VWAP are sloping down and working as an immediate resistance level. Therefore, as long as the price trades below the dynamic 20 EMA, we may expect the bearish pressure to extend in the coming hours.
The indicator window shows a different story as the TDI level is below the 50% area and aimed higher. Therefore, if the TDI level moves above the 50% with a bullish signal in the chart, we may expect a buying possibility in the coming hours.
Based on the current multi-timeframe analysis, LUNC/USDT has more room downside to complete the bearish correction. However, investors should monitor how the price trades at the 0.0002406 to 0.0001787 area, from where a bullish rejection could offer a long opportunity.


