Published: December 4th, 2024
In the upcoming earnings release, Wall Street analysts predict that Lululemon (LULU) will report quarterly revenues of $2.69 per share, representing a 6.3% increase yearly. Revenues are projected to reach $2.35 billion, representing a 6.8% increase over the same quarter last year.
It is crucial to account for any modifications made to the earnings estimates before a company releases its earnings. These changes are a crucial indicator for forecasting future stock-related investor behaviour. According to empirical research, trends in earnings predict revisions and a stock's short-term price growth is strongly correlated.
A deeper understanding of the business's performance during the quarter can often be obtained by looking at forecasts from analysts. As per the recent data, Evercore ISI Group raised the price target of this stock to $355. The same outlook is found from TD Cowen, forecasting the price to $382 to $382 zone.
Let's see the possible price momentum for Lululemon stock from the LULU technical analysis:

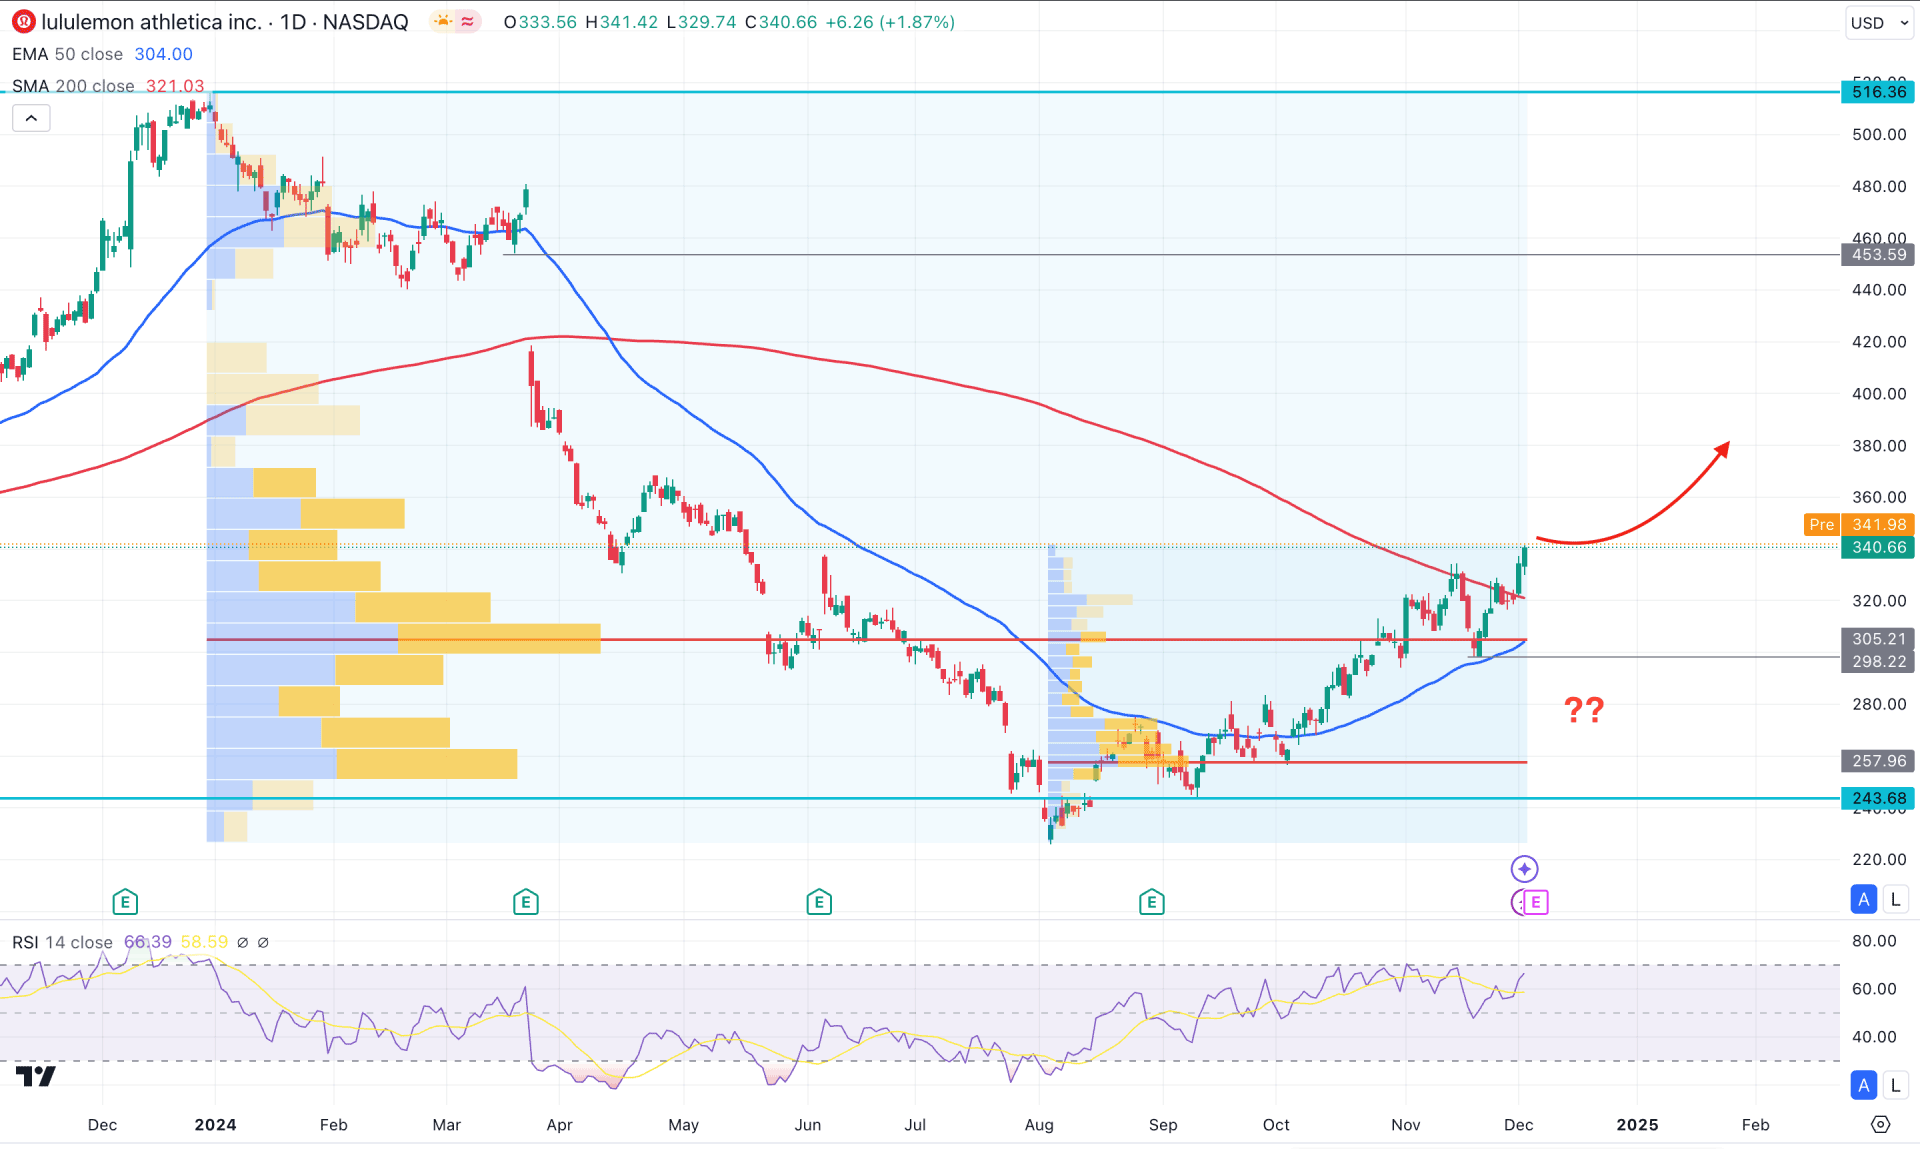
The ongoing market momentum is bullish in the daily chart of LULU, as crucial dynamic lines are below the current price with a bullish slope. However, investors should monitor how the price holds the momentum above these lines before anticipating a secondary wave.
In the higher timeframe, the price increased for five consecutive months after setting a bottom at the 226.56 level. However, the recovery was insufficient, as the bottom was formed after a massive 55.29% crash. As the current price is still hovering below the 50% Fibonacci Retracement level of the bearish swing, investors might expect an upward continuation soon.
The ongoing bullish momentum is also visible from the high volume line, where the first high volume line since January 2024 is at the 305.21 level, which is below the current price. Another high volume line from August 2024 is at the 257.96 level, below the current price. As long as these high volume lines remain below the current price, we may consider institutional buyers' presence in the market.
Looking at the main chart, the price aimed higher above the 200-day Simple Moving Average, signaling a major bullish pressure. Moreover, the failure to hold the 200-day SMA as resistance with bullish pressure from the 50-day EMA could work as a confluence buying signal for this stock.
Based on this outlook, the recent bullish recovery from the 298.22 support level could signal a potential long opportunity in this stock. On the bullish side, the upper limit of the trading range is at the 516.36 level, which will be the ultimate target. Before that, the 453.59 level would be a crucial price inefficiency level to look at.
However, the bullish possibility is valid as long as the dynamic 50-day EMA is protected. Valid selling pressure with a daily close below the 257.96 level could eliminate the bullish possibility and lower the price toward the 225.00 area.

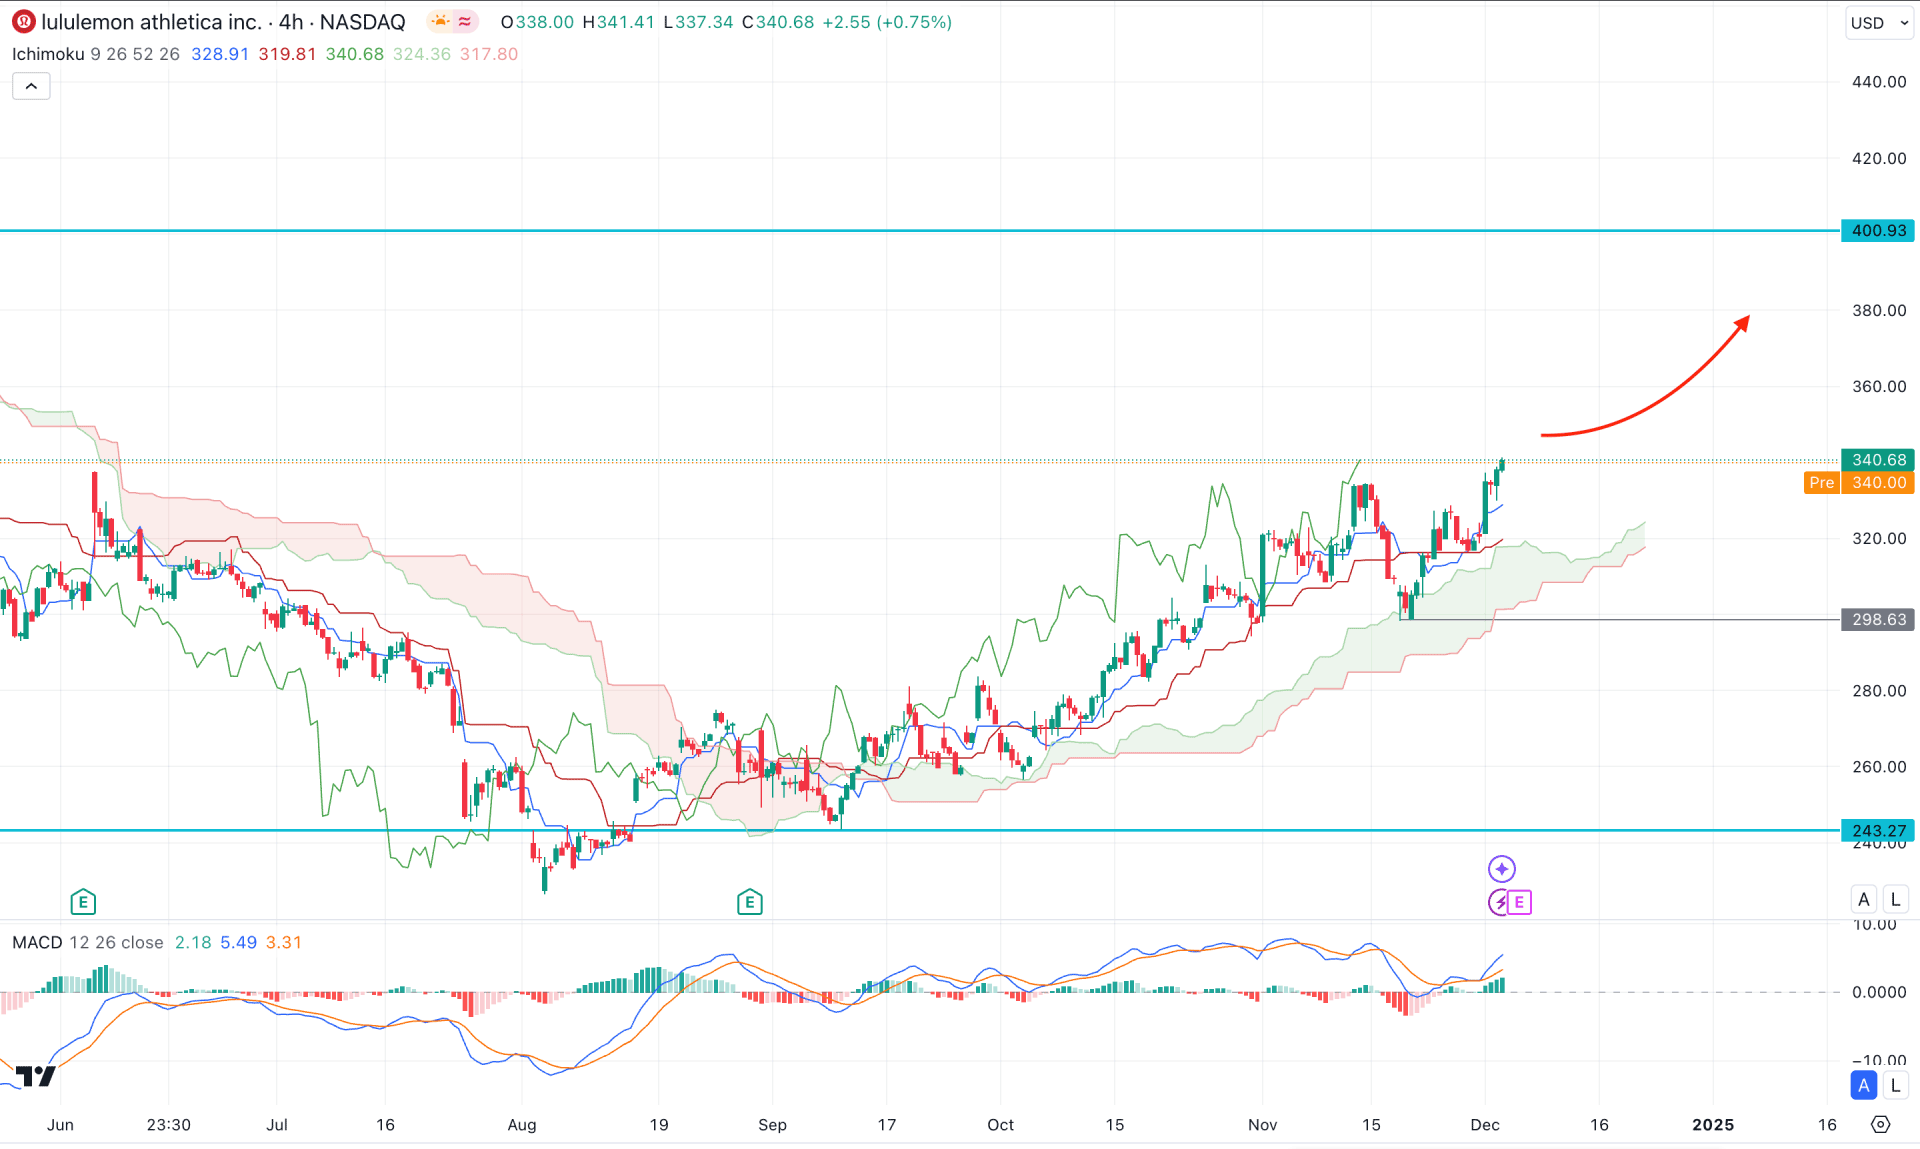
In the H4 timeframe, LULU is trading within a bullish continuation pattern, where a stable upward pressure is visible above the dynamic Ichimoku Cloud. Moreover, the most recent bullish V-shape recovery from cloud support could work as a confluence of bullish pressure on this stock.
In the Futures Cloud, the dynamic Senkou Span A and Senkou Span B aimed higher, where the Senkou Span A remained above the Senkou Span B.
In the indicator window, a strong bullish recovery is seen from the MACD Signal lines as the current level showed a recovery. Moreover, the MACD Histogram became positive as the current vertical line aimed higher above the neutral line.
Based on the current market structure, the LULU has a higher possibility of moving higher as a trend continuation. The bullish crossover in the dynamic lines signals a confluence of bullish pressure.
On the other hand, an extended selling pressure with an H4 candle below the 298.63 level could lower the price toward the 243.27 level.

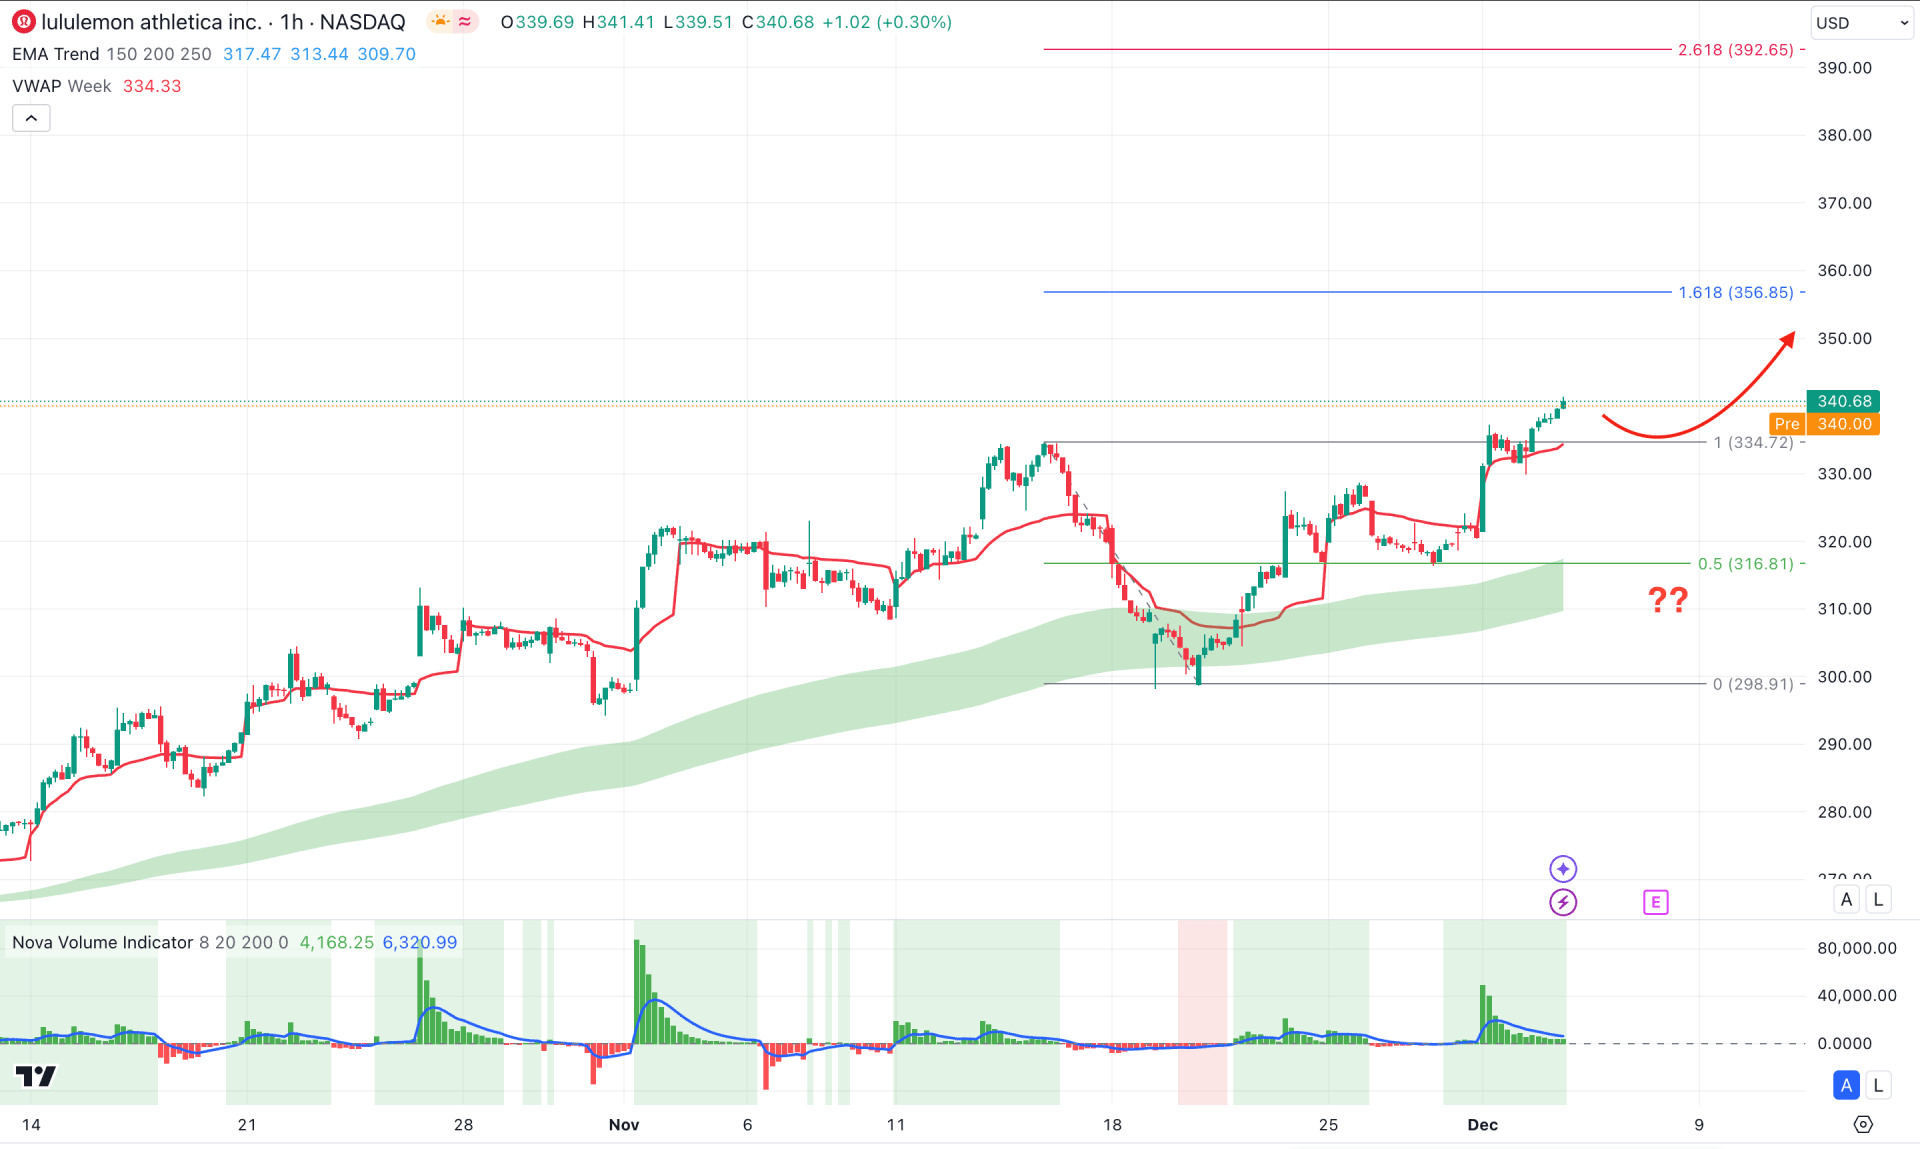
In the hourly chart, the LULU stock is trading within a strong bullish trend, backed by an upward MA wave. Moreover, the weekly VWAP is below the current price, working as an additional bullish signal.
The Volume Histogram shows consecutive green lines in the indicator window, signalling an ongoing bullish volume injection.
Based on the hourly outlook, the price is likely to extend the buying pressure and find a resistance from the 356.86 Fibonacci Extension level. However, a bearish correction is possible towards the 316.81 support level before forming another long opportunity.
Any immediate selling pressure below the dynamic VWAP line could increase the bearish opportunity, aiming for the 300.00 psychological line.
Based on the current market momentum, LULU is more likely to extend the buying pressure as a major market shift is visible above the 200-day SMA line. Investors should keep a close eye on the upcoming earnings report as any upbeat result with a hawkish management outlook could boost the buying pressure.