
Published: March 26th, 2025
It is anticipated that Lululemon will maintain its operations momentum in the final quarter of fiscal year 2024, exhibiting expansion in a number of product categories, regions, and channels. Strong online performance, more in-store visitation, and favorable customer reactions to its items probably drove this rise.
The company's latest favorable business update reflects stronger-than-expected demand throughout the holiday season. Positive consumer reaction to the brand's product offers helped the holiday selling season. Consequently, the business increased its fourth-quarter fiscal 2024 guidance.
LULU anticipates that its fiscal fourth quarter revenues will reach $3.56–$3.58 billion, an 11–12% year-over-year growth. The updated guidance represents an increase over the projection for $3.48–$3.51 billion. For the fourth quarter of fiscal 2024, the business anticipates growth in organic revenue of 6-7% after accounting for the extra 53rd week.
Management anticipates earnings per share increasing from the previously stated $5.56 to $5.84 to $5.81 to $5.85. In comparison to the final quarter of fiscal 2023, the company expects the gross margin to grow by 30 basis points (bps). Compared to its previous forecast, which predicted a 20–30 basis point decline in the gross margin, this represents a significant improvement.
Due to its strong global customer connection, Lululemon is also well-positioned to capitalize on the robust company growth in its overseas markets, including Mainland China and the remainder of the world. Nevertheless, the inflationary climate and rising interest rates have been hurting Lululemon's company in the Americas by causing lackluster discretionary spending and difficulties in the women's sector.
For high-end retail companies like Lululemon, this has been a significant obstacle, particularly in the US. A downturn in US revenue is the cause of LULU's Americas segment's difficulties.
Let's see the possible price momentum for Lululemon stock from the LULU technical analysis:
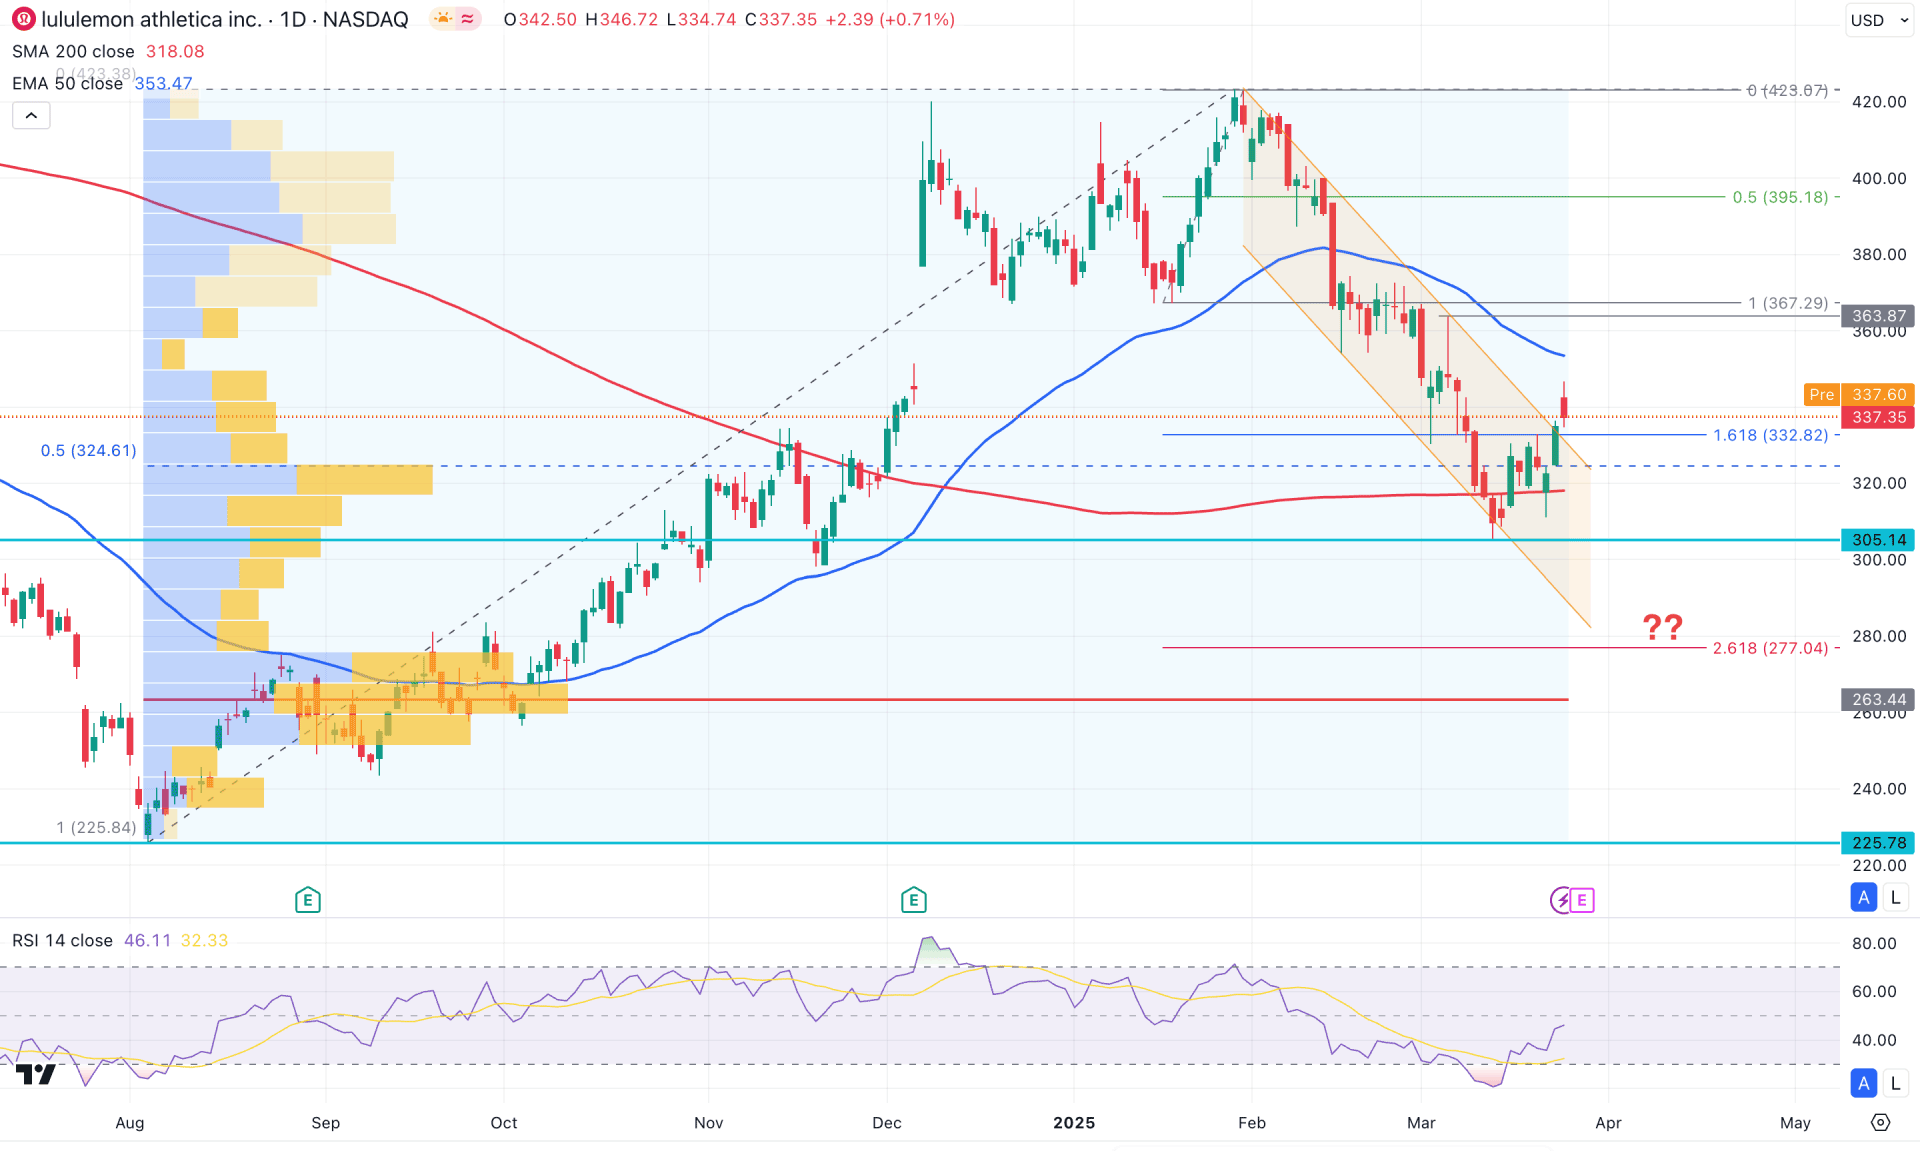
In Lululemon's daily chart, the price shows buying pressure from a discounted zone. Moreover, crucial dynamic lines are below the current price and acting as support. In this case, the primary goal for this stock would be to look for a long position as long as the dynamic lines continue to hold their momentum.
Looking at the higher time frame, we can see ongoing bearish pressure from the January 2025 high, where the price recently rebounded lower and dropped below the December 2020 low. However, there is no significant buying pressure seen in the monthly chart, though minor bullish pressure is visible in the weekly timeframe. The 342.70 level is acting as crucial weekly resistance, and investors should focus on how the price reacts in this area.
The broader volume structure supports bullish moves, even if there is a downside possibility. The largest activity level since August 2024 is at the 263.41 level, which is below the current price. Since the high-volume line is below the current price, any bullish price action could present a strong long opportunity in this stock.
Apart from the volume structure, the price action shows potential bullish continuation, as valid buying pressure is visible from the 200-day SMAe. Although the 50-day EMA is above the current price, the Golden Cross continuation is still possible after overcoming it.
In the indicator window, a bullish rebound is feasible based on the Relative Strength Index (RSI). The RSI line has rebounded after reaching the 30.00 oversold level and is hovering near the 50.00 line.
Based on the current market outlook, investors should monitor how the price reacts around the 50-day EMA area. The primary expectation is to wait for a bullish break, with a stable market above the 363.87 level, which could open the way for reaching the 423.07 high.
On the other hand, if a sufficient downside correction occurs after the current descending channel breakout, minor downward pressure is expected before a bullish buy signal is found above the 50-day EMA line.
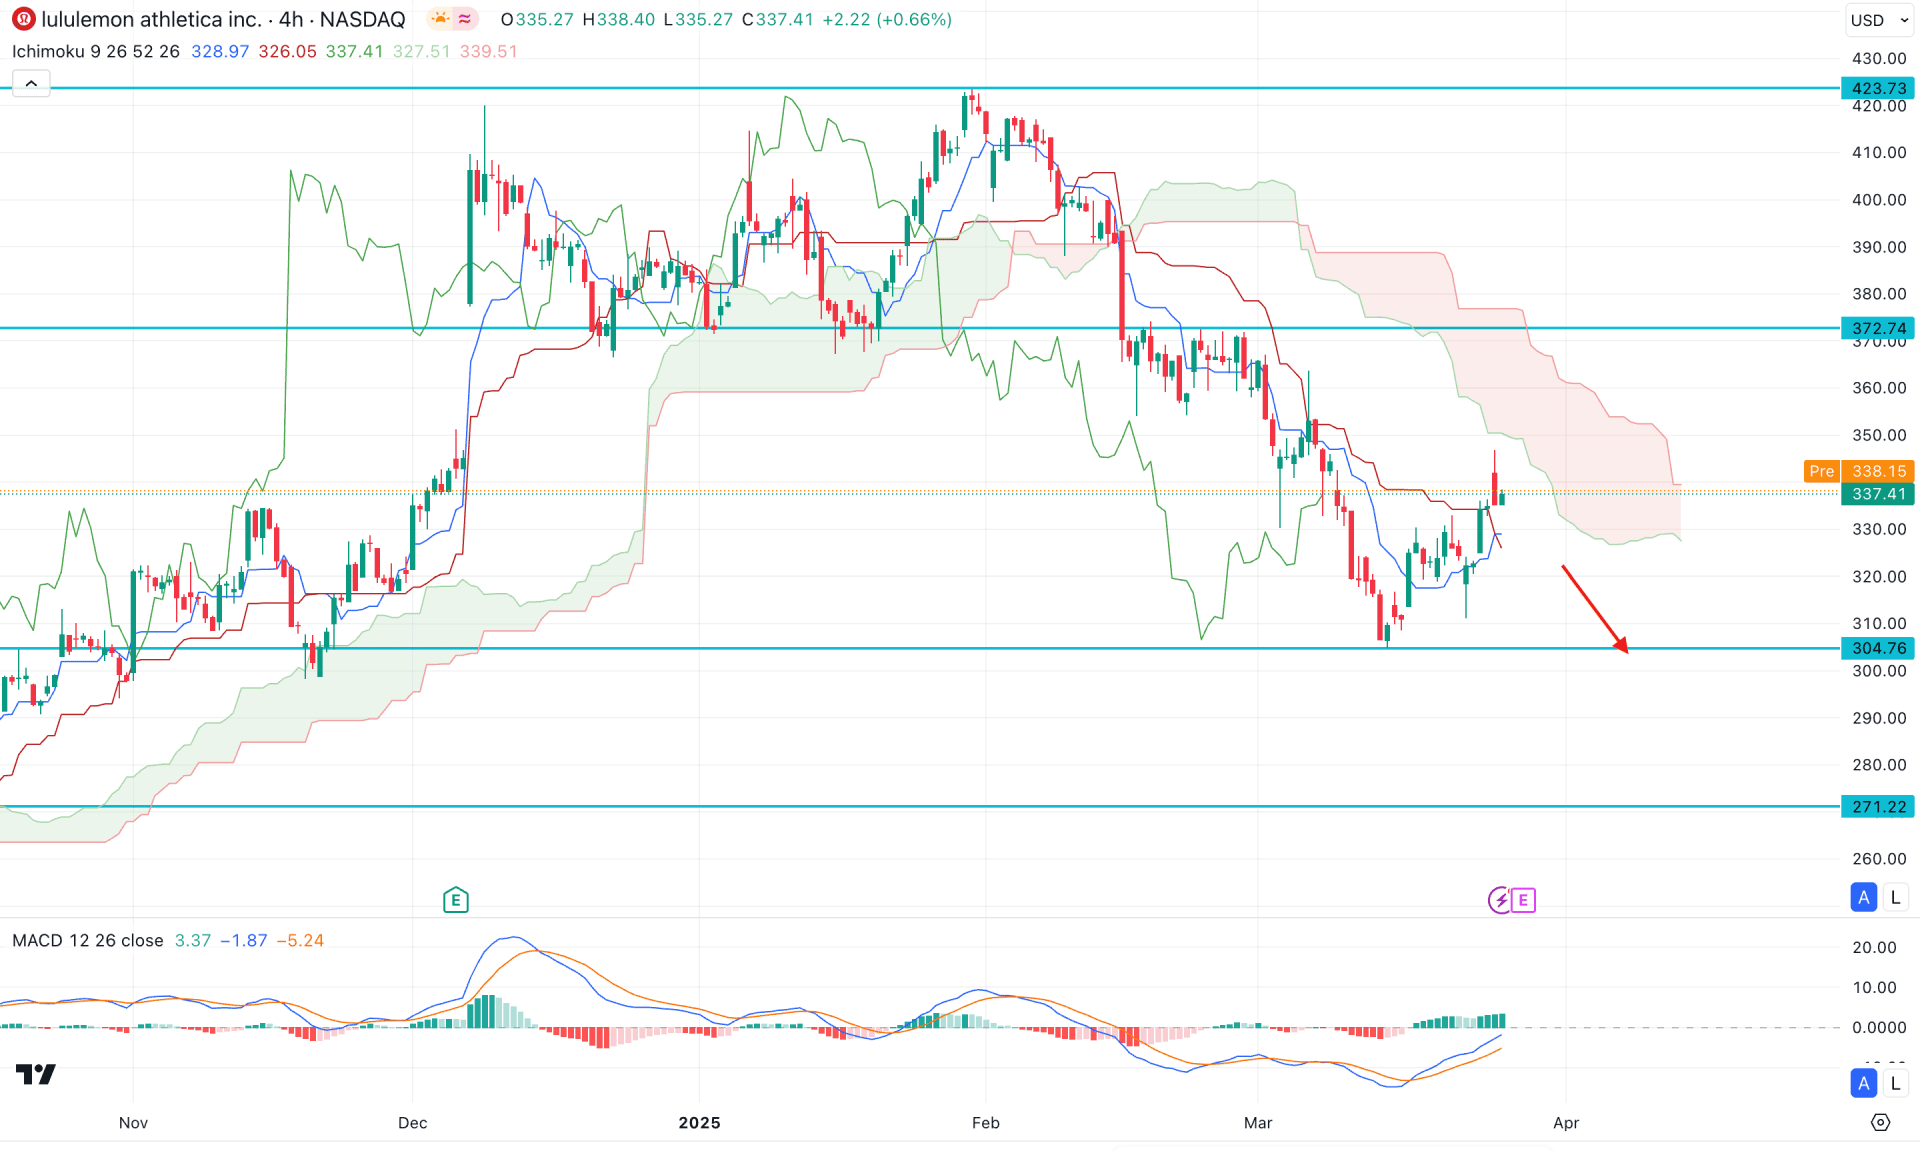
In the four-hour timeframe, the downside pressure continues after breaking below the cloud area. Moreover, both future cloud lines are heading lower, suggesting a potential bearish continuation.
In the MACD window, the signal line from the bullish crossover has risen to the neutral point. Additionally, the histogram has maintained buying pressure by remaining bullish for more than a week.
Based on this outlook, the classic Ichimoku Cloud trading approach suggests looking for a reversal with a four-hour candle below the key support zone. In this case, the price is likely to find a new swing low below the 304.76 level.
On the other hand, bullish counter-impulsive pressure with valid consolidation above the 372.74 level would invalidate the bearish structure. In that case, the price is likely to extend the buying pressure and find a new swing high above the 423.73 level.
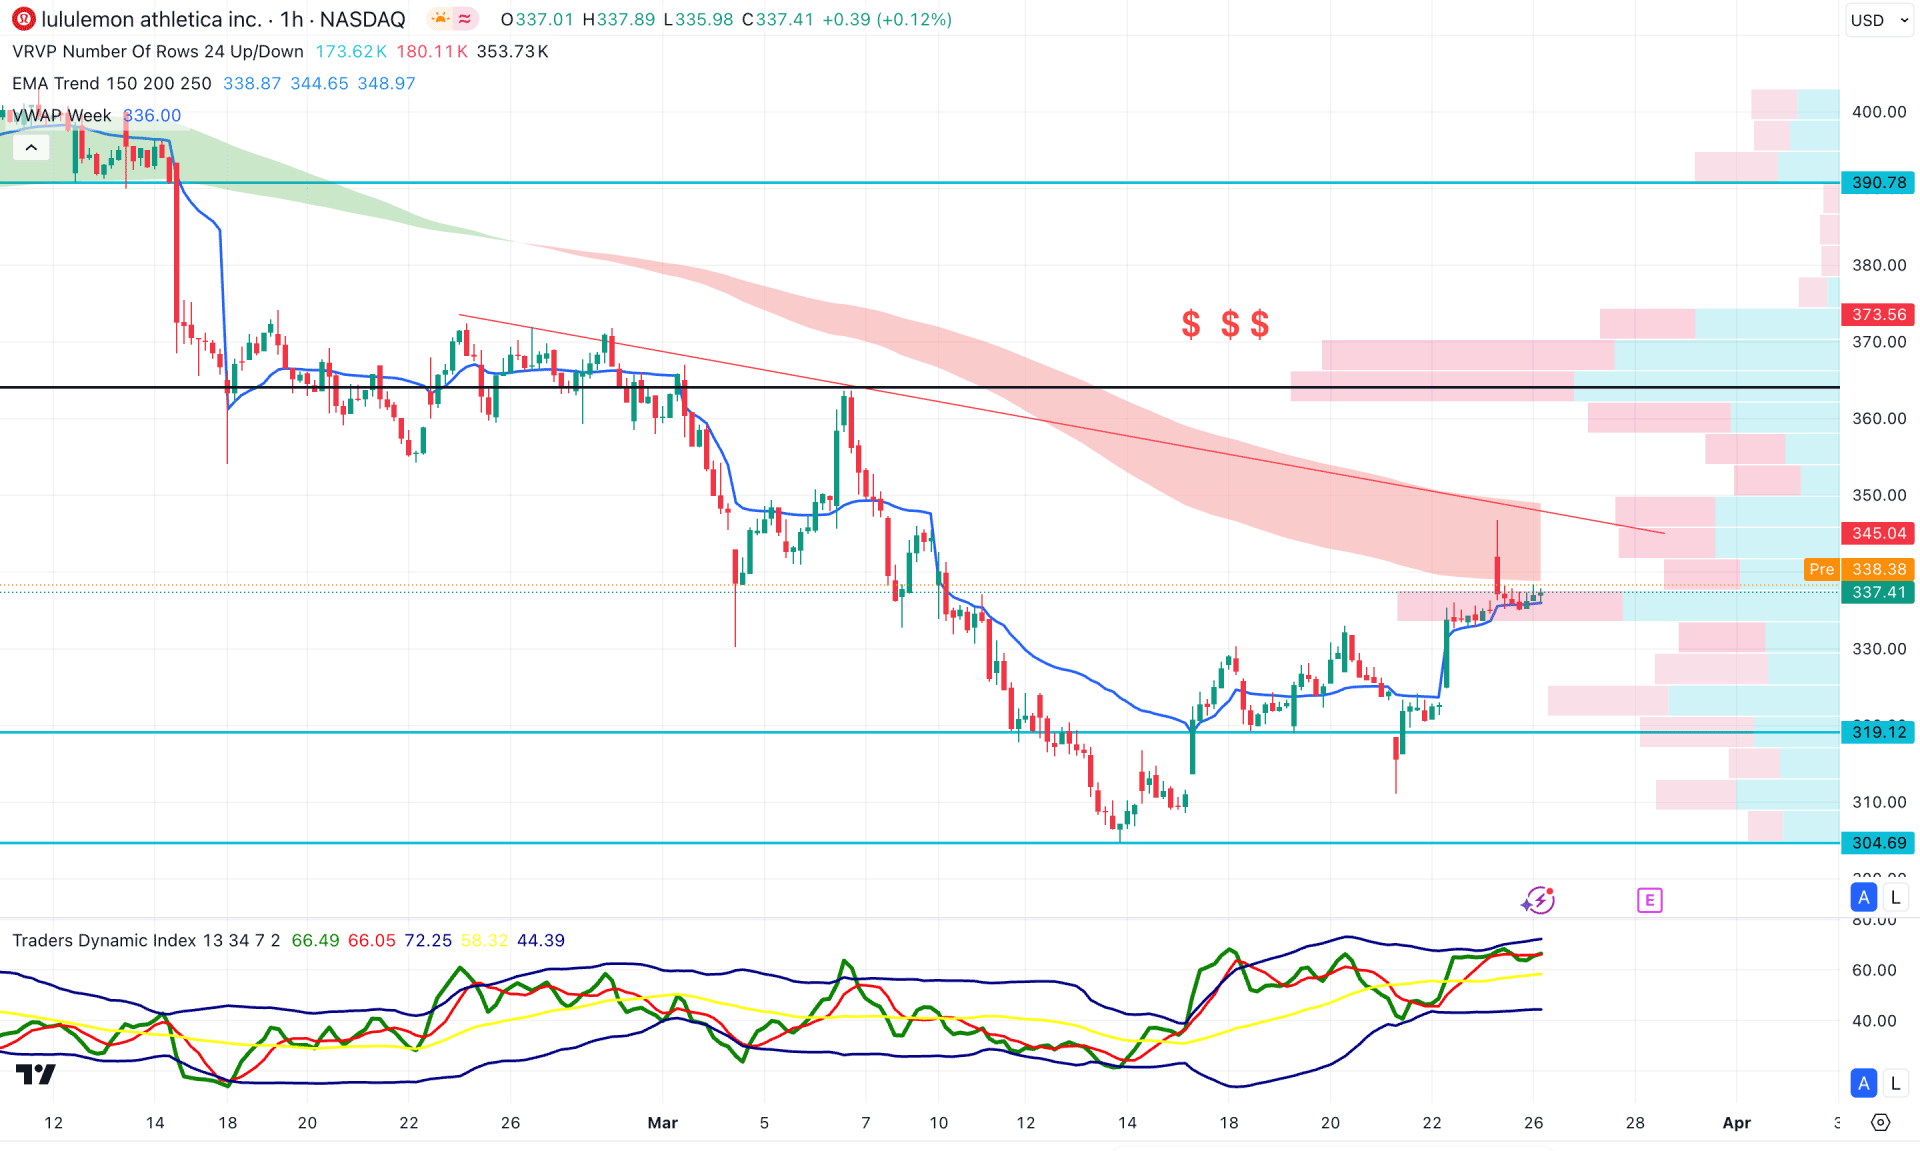
In the hourly chart, the LULU stock is trading within a corrective bullish trend, with the EMA wave acting as a major barrier. Although the weekly VWAP is below the current price, the secondary indicator does not provide sufficient support.
The Traders Dynamic Index (TDI) reached the upper band area, signaling a top formation. In that case, more upward pressure needs to be pushed from the price action, possibly from an impulsive continuation.
Based on the hourly outlook, the price is likely to extend higher, and the EMA wave will be tested as a resistance. On the bullish side, a potential break with a stable price above the trendline resistance could grab enough orders before reaching the 390.78 imbalance top.
On the bearish side, any immediate selling pressure below the dynamic VWAP line could lower the price towards the 304.69 support level.
Based on the current market momentum, LULU is more likely to extend the buying pressure as a bullish rebound is present above the 200-day SMA line. Investors should closely monitor how the price reacts to intraday resistance, as a bullish breakout could signal an early trend shift.


