
Published: March 12th, 2021
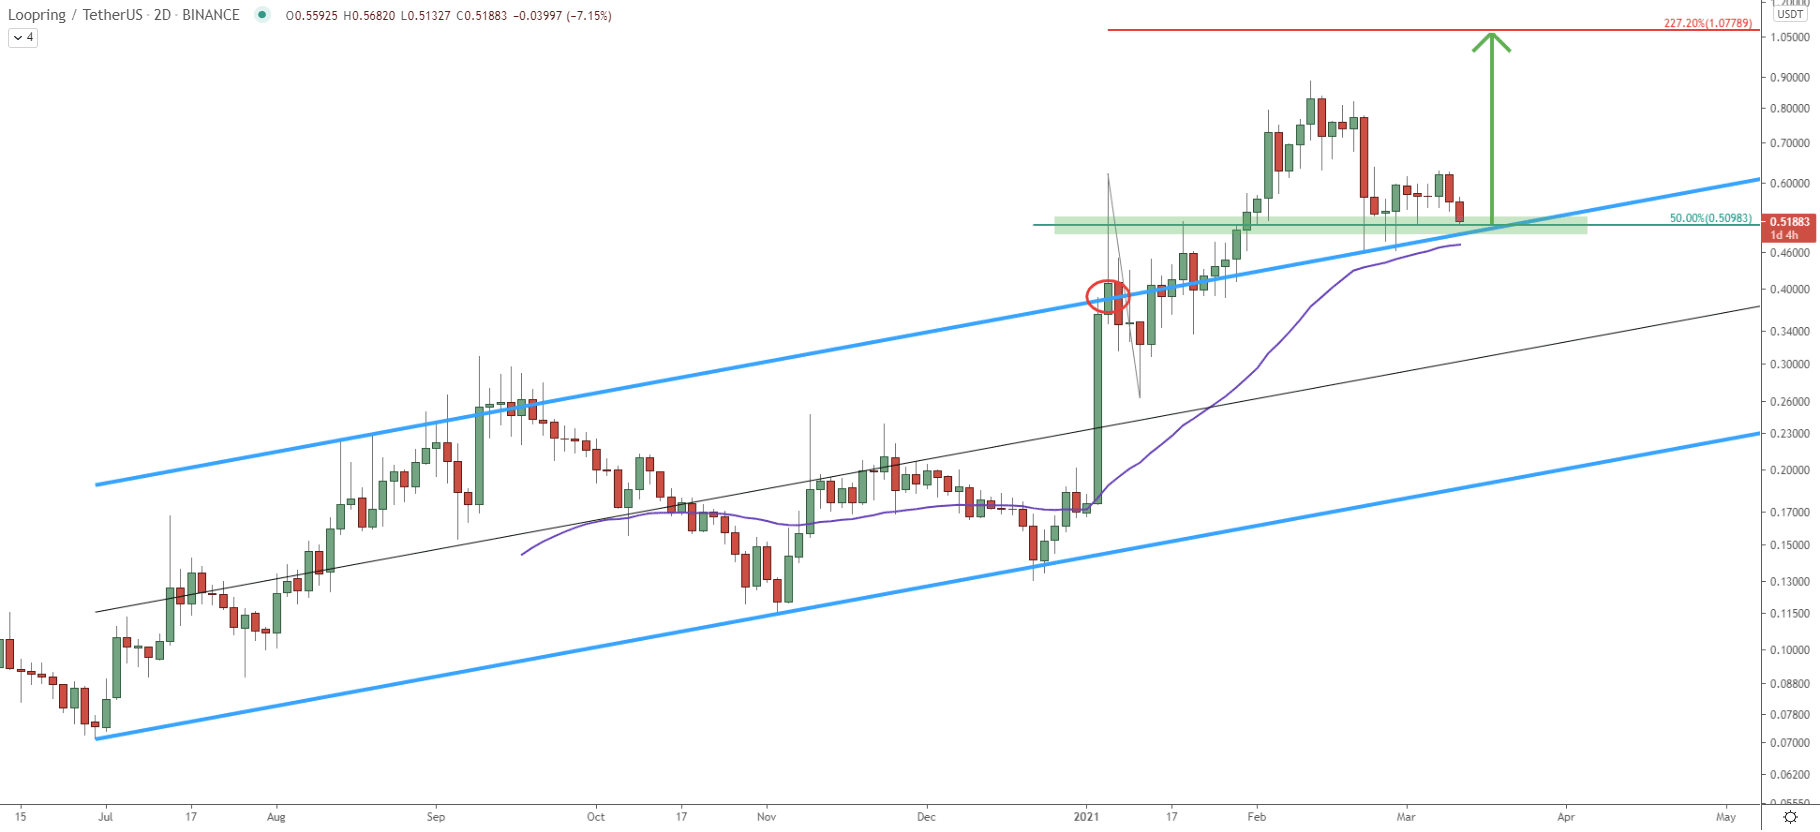
LRC price has been consistently up since July 2020 and has managed to rise from 0.078 up to the 0.900 resistance area in just under a year. It was a substantial price increase, where LRC went up by more than 10 times. The big question right now is whether there is enough steam for the price to continue rising. Well, the trend is clearly very bullish, but what is more important is that at the beginning of 2021 Loopring broke above the ascending channel on the 2-day logarithmic chart. This goes to show that bulls are still in complete control and the price is likely to bring a new all-time high.
Today LRC/USDT has approached the 0.50 psychological support for the second time, which is a key demand area. Previously it acted as the resistance but right now it is a clear support area. Right now LRC is near the support trendline of the channel and 50 Exponential Moving Average. At the same time price bounced off the 50% Fibonacci retracement level which is yet another bullish sign. Perhaps from this point onwards, the trend up will continue and might result in another x2 growth during the next couple of weeks.
This is because the nearest resistance is spotted at 1.07, which corresponds to the 227.2% Fibonacci retracement level. This Fibonacci indicator was applied to the first corrective move down after the price broke above the ascending channel. In the following charts, we’ll show thy this resistance could be a very important price.
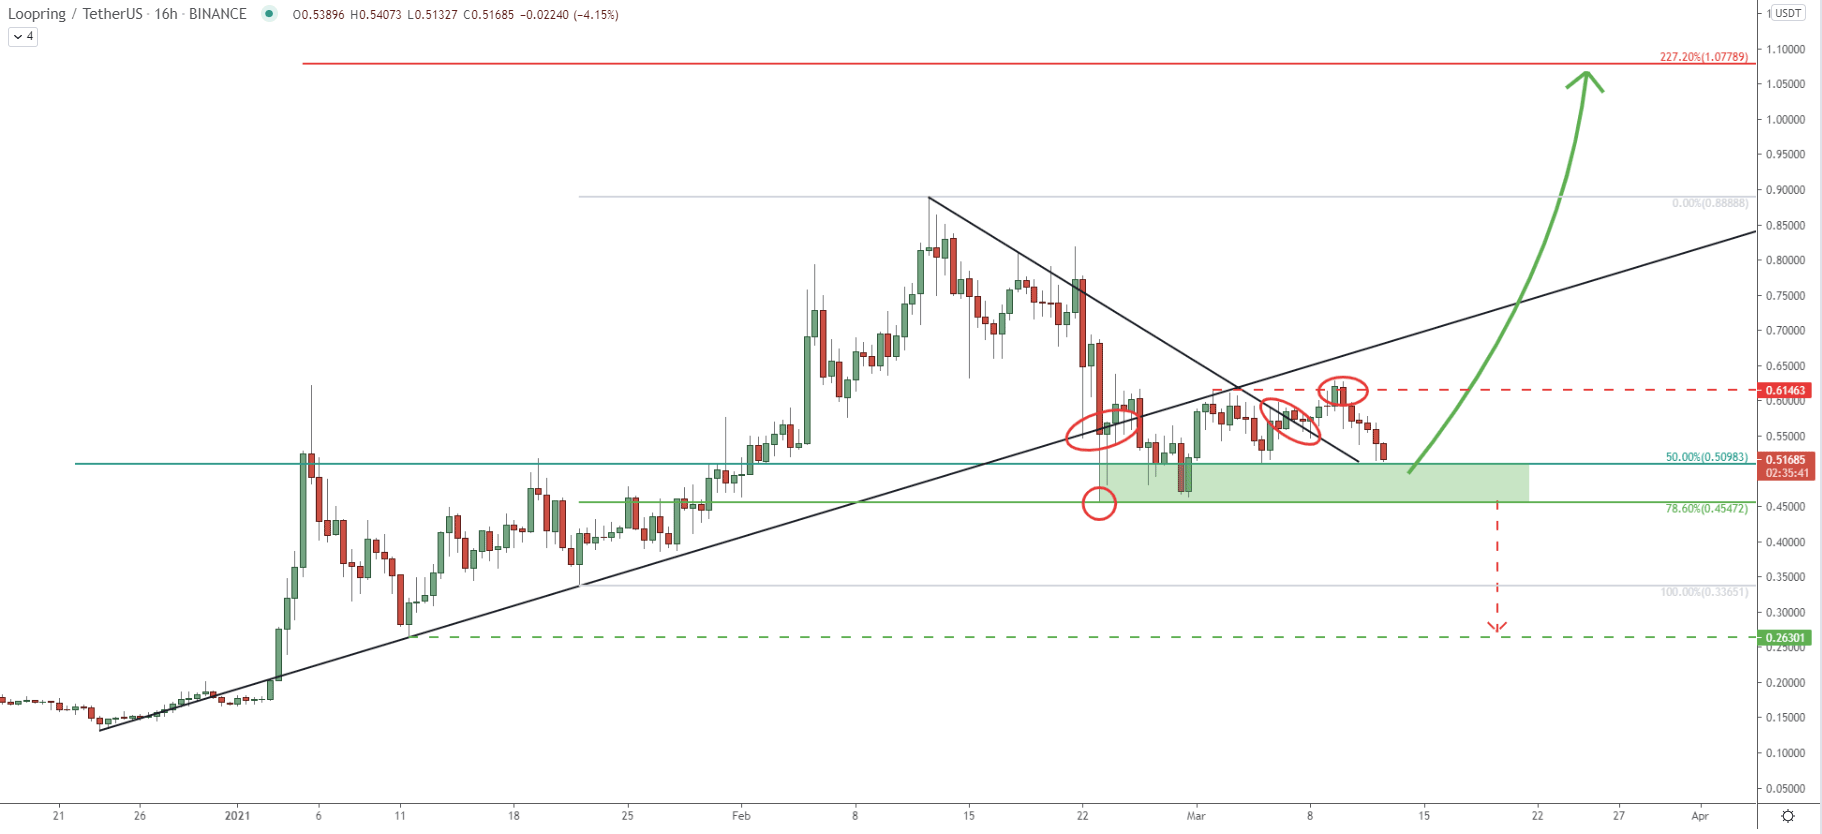
On this chart price action getting even more interesting. This is because the price has been attempting to break below the uptrend trendline, although LRC only managed to produced few spikes lower, without a clear break and close below. And one of the spikes has reached and cleanly rejected the 78.6% Fibonacci support at 0.45. This was an extremely clean rejection of the Fibs, confirming the validity of a long-term uptrend. Therefore, as long as LRC/USDT remains above 0.45, bulls will be attempting to push the price up, which should occur in a relatively short period of time, considering a strong bullish trend of Bitcoin.
The recent price action shows that the previous high at 0.61 has been broken along with the simple downtrend trendline. After the breakout price corrected down and entered the demand area. It implies that buying pressure is likely to start increasing from today, which could push price up very fast.
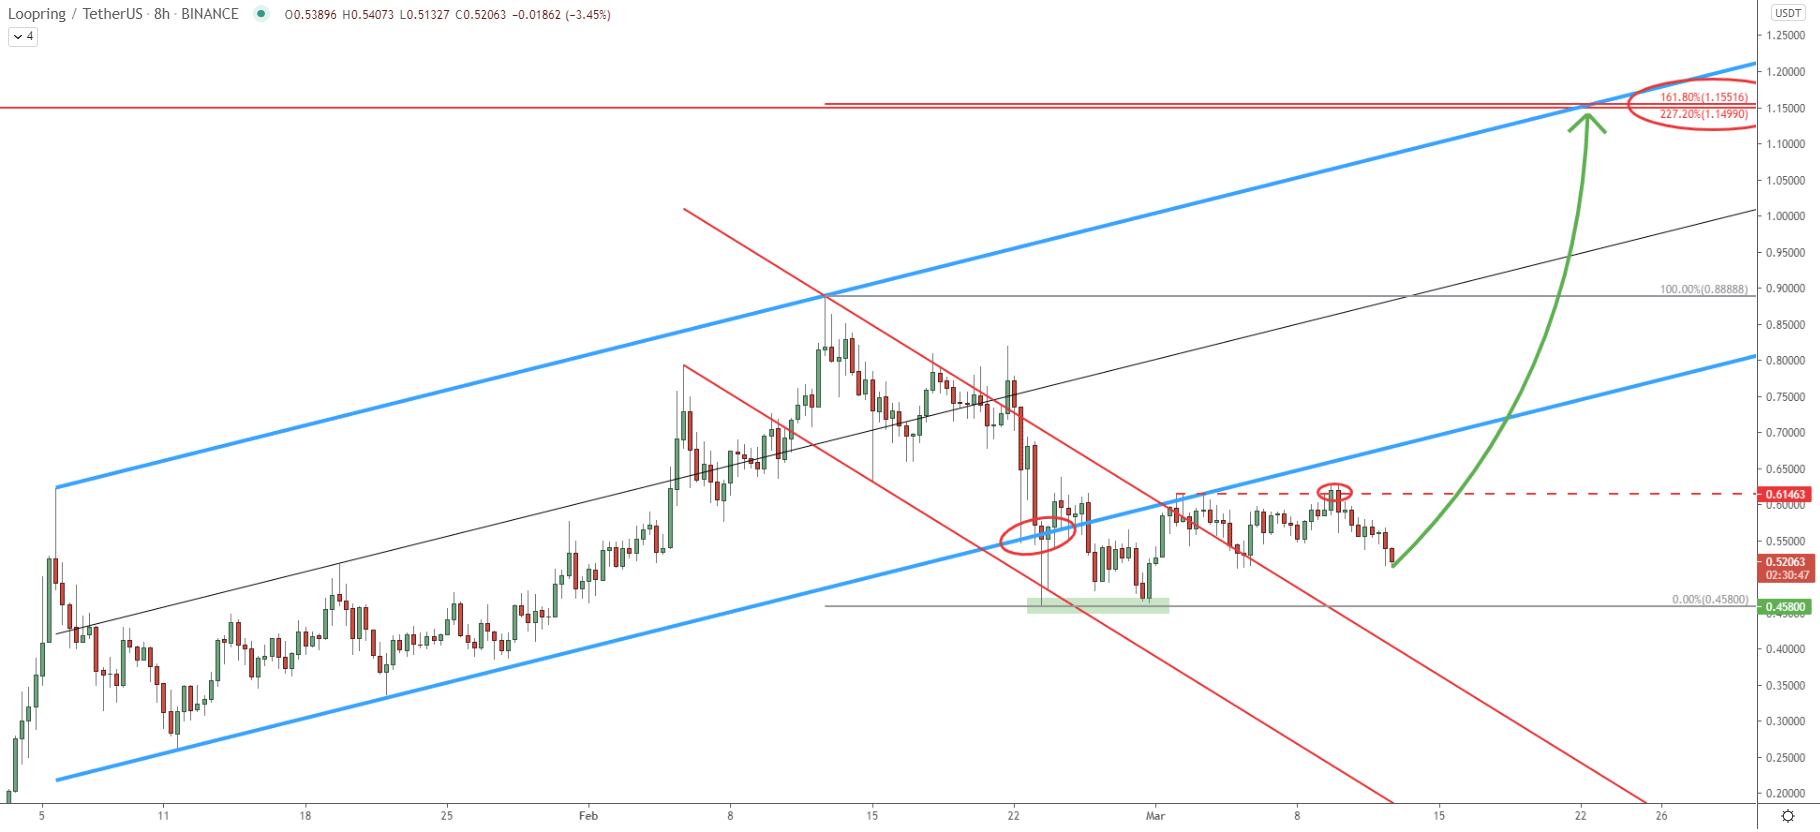
Another ascending channel has been plotted to this chart. It shows that price attempted to break below the support trendline, although failed to do so. We can also see that the bottom of the descending channel has been rejected after which price has produced a double bottom near 0.458. Then the price went up but formed resistance at 0.61, where LRC/USDT bounced off the resistance trendline and the top of the descending channel. However, several days ago this resistance has been penetrated with a daily break and close above 0.61. This is a strong indication that the uptrend is far from over and the next move up can bring the price to a 1.15 resistance area.
On this chart, this resistance is confirmed by two Fibs, the first is 227.2% as per the 2-day chart, and the second is 161.98% Fibs applied to the correction down, which took place during the second half of Februarry. Another thing is that the resistance corresponds to the upper trendline of the ascending channel, suggesting that the price might increase by x2 in just one or two weeks.
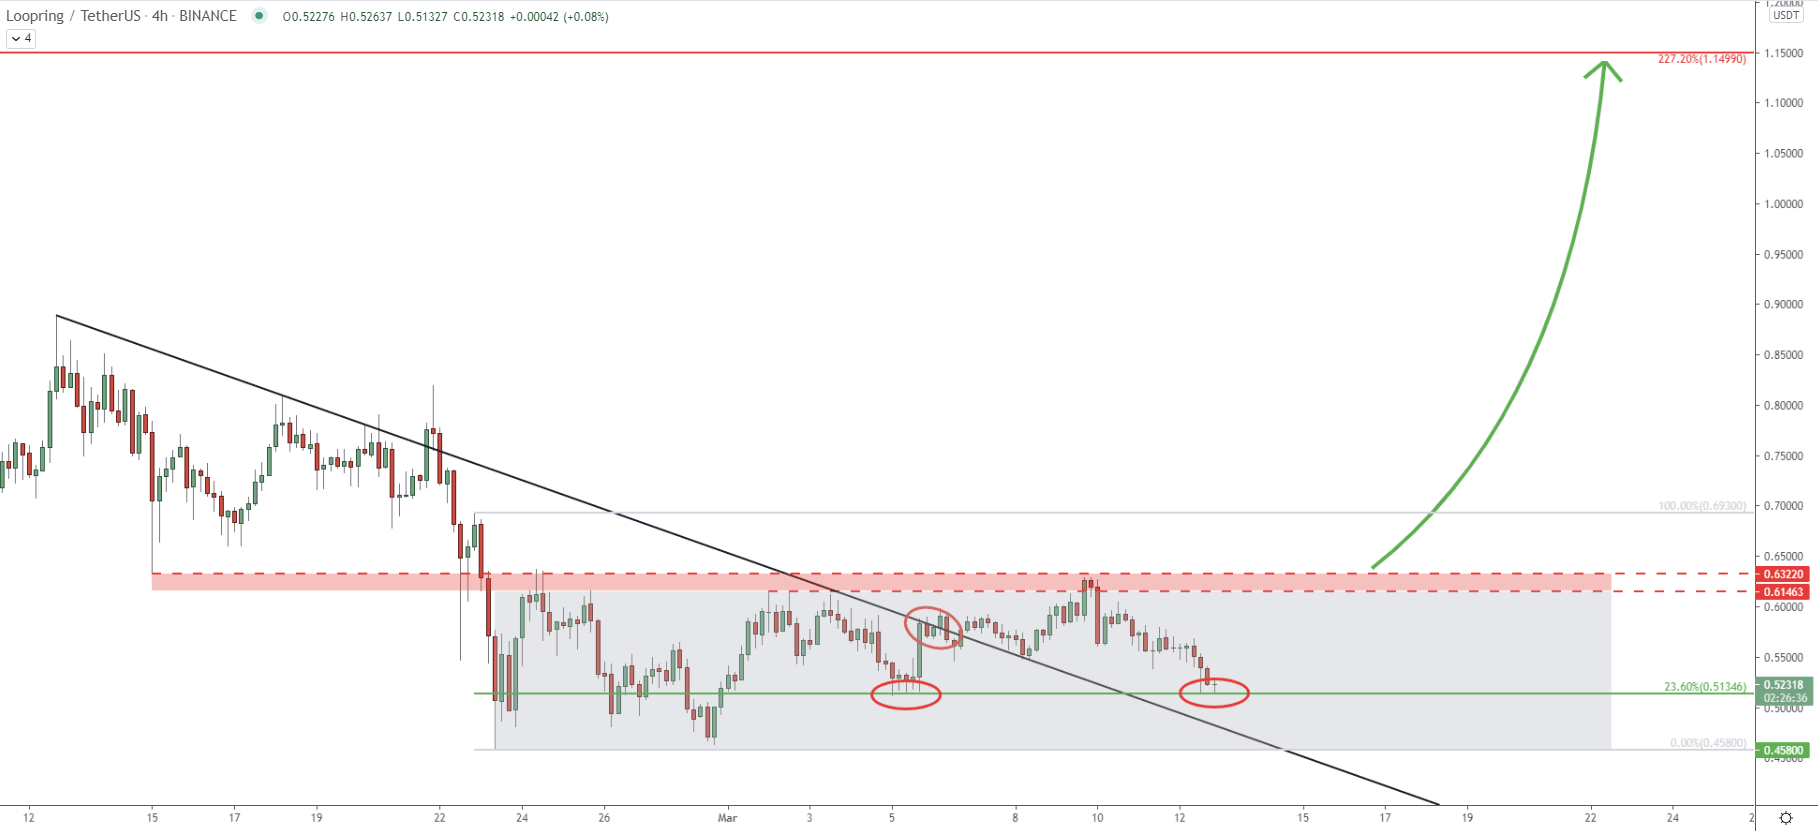
On the 4-hour chart, a consolidation phase seems to be still ongoing, the price has been stuck between 0.45 support and 0.63 resistance during the past 3 weeks. Such an extended consolidation usually results in a strong move. Considering that 23.6% Fibs at 0.51 has been rejected twice, the incoming wave should be expected to be up. Not to mention that the downtrend trendline was broken, adding extra confidence in the further price increase.
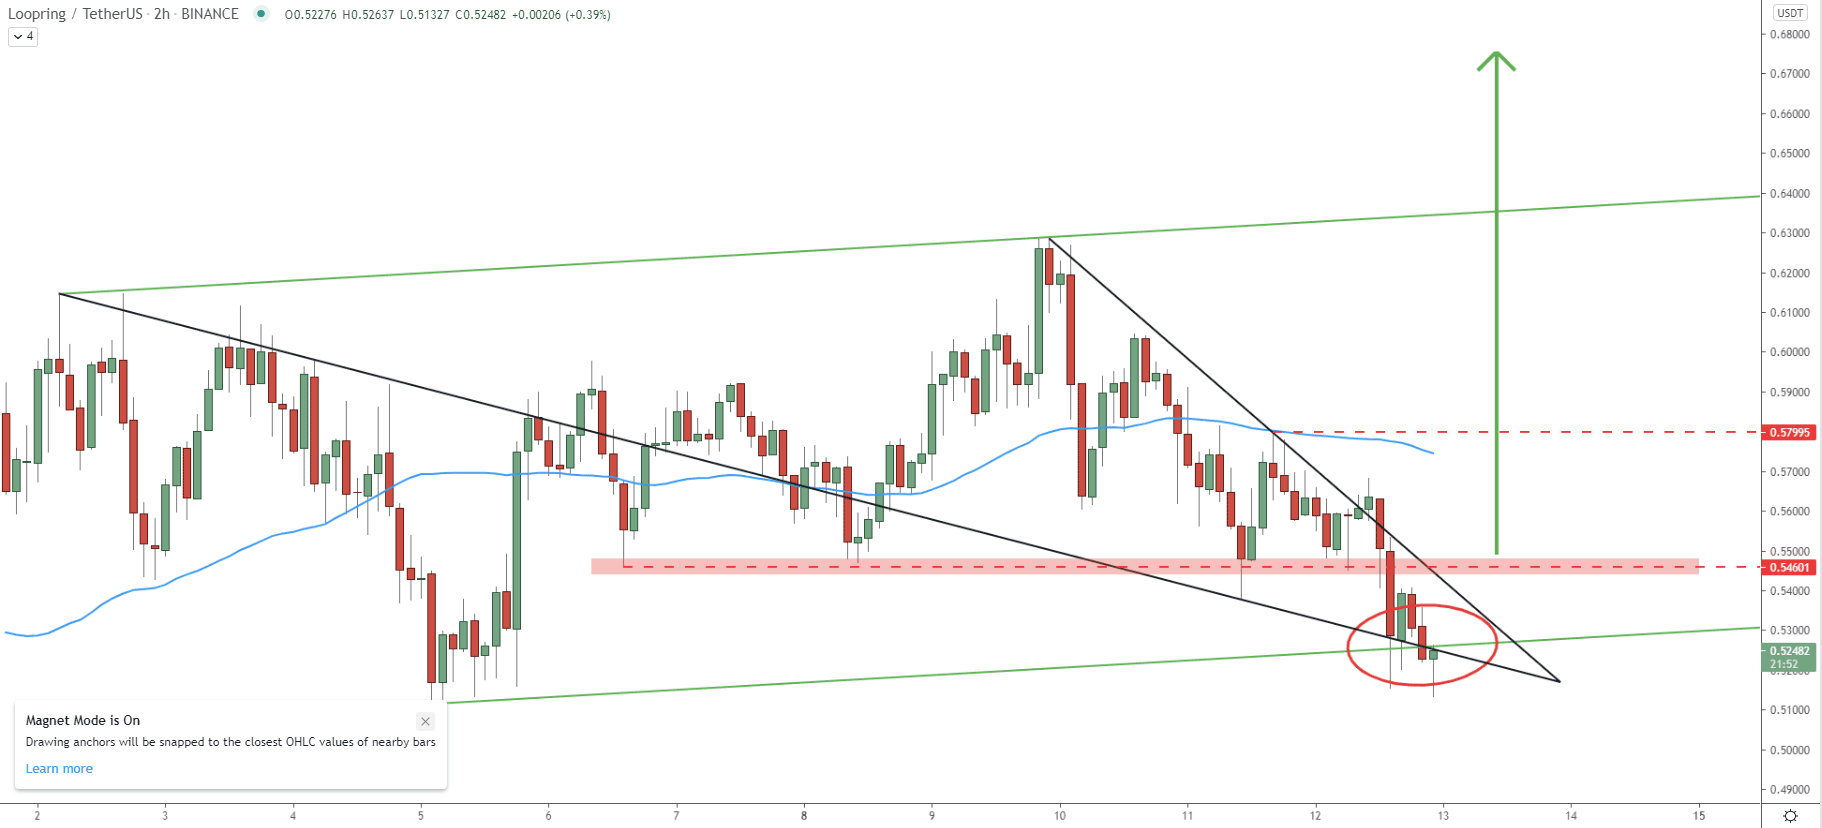
Finally, on the hourly chart price is testing the bottom of the ascending channel, which right now is being rejected. At the same time, price is bouncing off the average price downtrend trendline, and as a result, buyers are likely to step in. Perhaps the final confirmation of the uptrend continuation will be a break above the 0.54 resistance, which previously, on 3 auctions acted as the support. Another minor resistance that must be watched is 0.58, where previously the price bounced off the 50 EMA.
Along with most other altcoins, the LRC long-term trend remains heavily bullish. Currently, price is trading near the key demand area, and this is the most likely zone for buyers to enter the LRC/USD long positions. This might be the case for the price increase by two times in the next week or two.
As per the weekly and 8-hour chart, the key resistance is at 1.15, which corresponds to two Fibonacci retracement levels as well as the resistance uptrend trendline.
As per the 16-hour chart, the demand zone is based between 0.45 and 0.51. A break below 0.45 support, will immediately invalidate the bullish outlook and in this scenario, price should be expected to start declining, potentially towards the 0.3 psychological support area.
Support: 0.51, 0.45, 0.33 0.30
Resistance: 0.54, 0.58, 0.88, 0.10, 0.15


