Published: June 2nd, 2022
Litecoin’s most awaited event was the latest MimbleWimble upgrade, where the Litecoin network introduced features allowing users to conceal their transaction data. Moreover, the transaction fee is reduced with an increase in scalability. Despite these changes, Litecoin's price failed to show a bullish recovery, whereas last month’s price action showed an additional 40% loss from the April 2022 peak.
The Litecoin function might lose users' attention due to the lack of functionalities. While other platforms are becoming faster and more scalable, Litecoin still uses the proof of work method with no capability of Web3. On the other hand, its major users are limited to merchants, limiting future price growth.
On the other hand, the recent selling pressure in The LTC/USDT price was boosted by the US interest rate hike, where the Fed indicated a further increase in rates in 2022. In that case, the current bearish sentiment in the LTC/USDT price may extend more in the coming days. Let’s have a look at the complete future price direction from the LTC/USDT technical analysis.

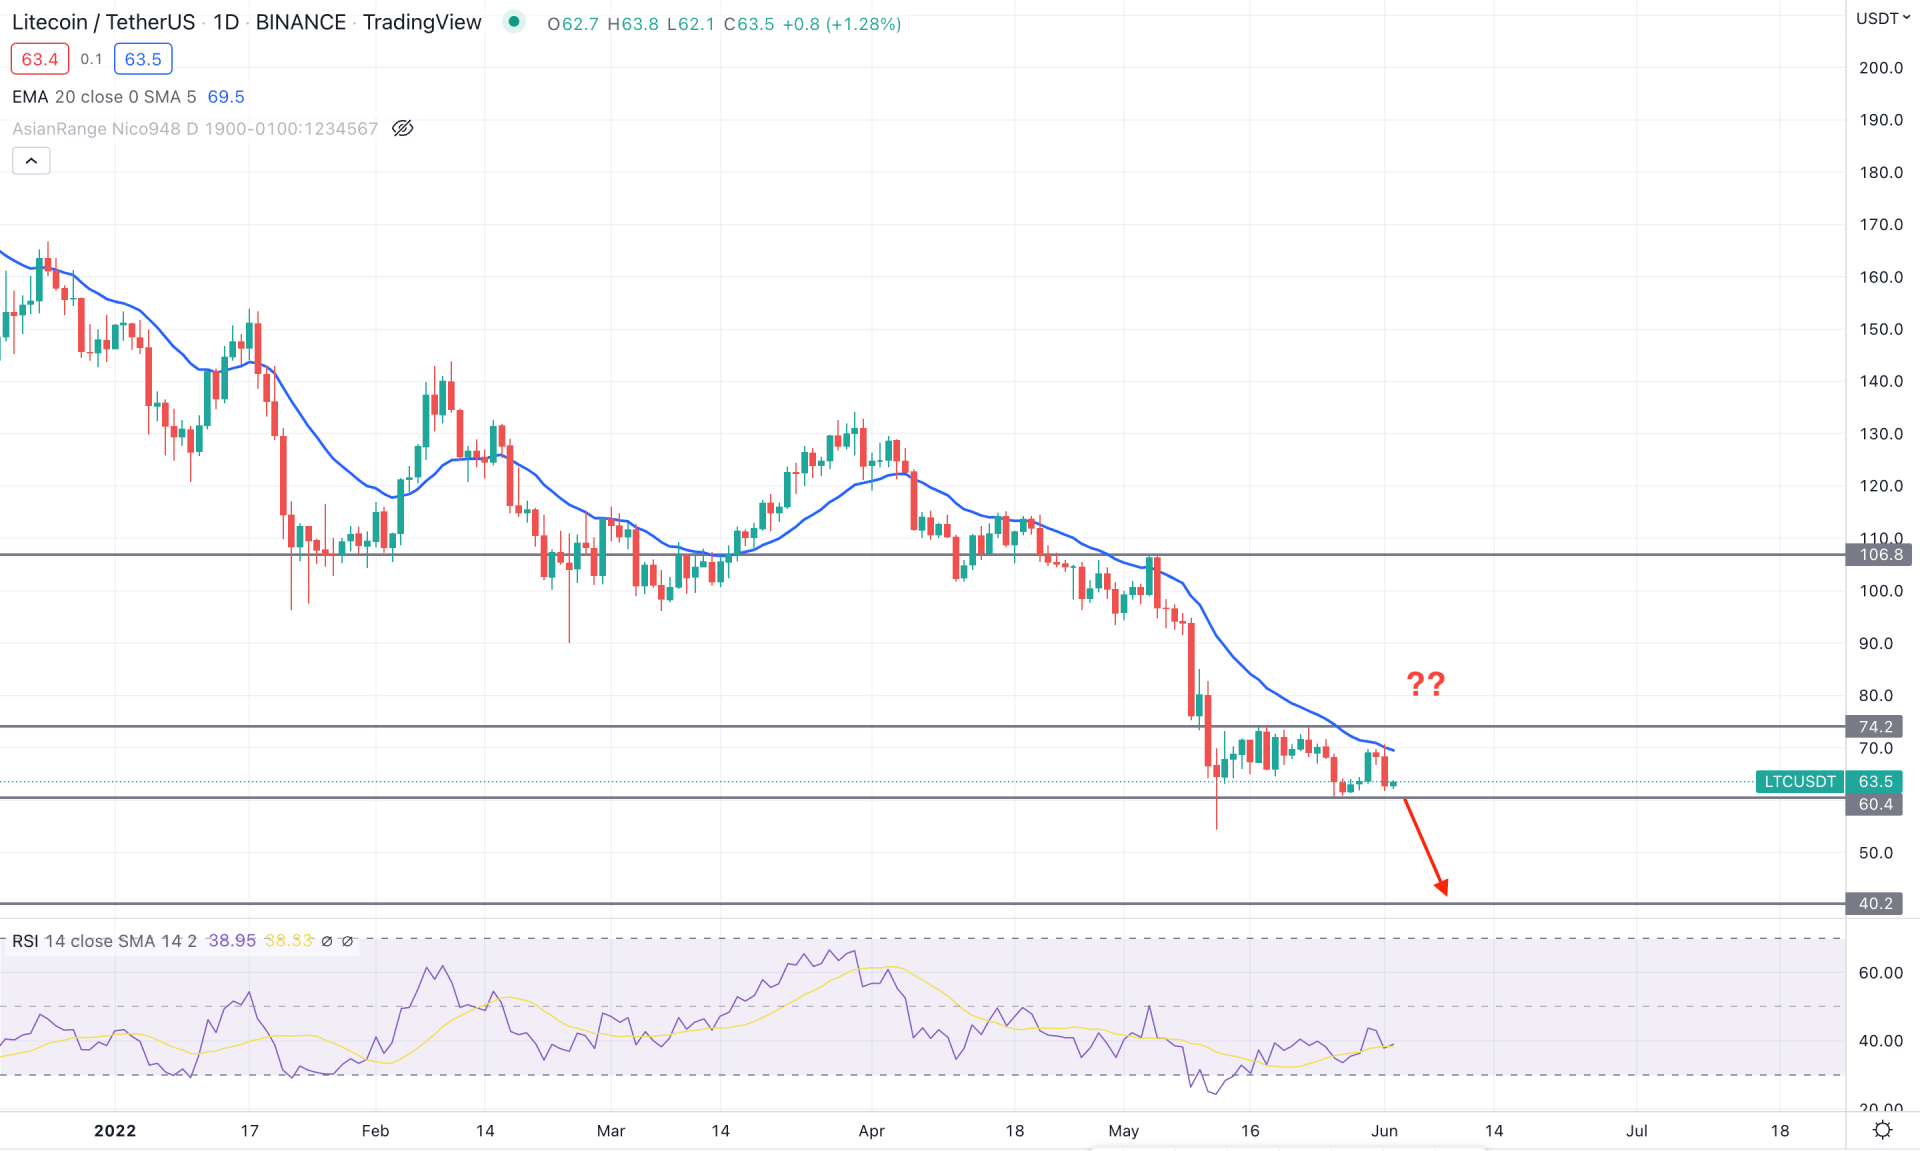
In the LTC/USDT daily chart, the price trades within a strong bearish trend where the recent lower lows indicate multiple bearish breaks of structure on the downside. Moreover, the selling pressure from the latest supply area, 106.80 to 100.00, is still active, whereas the consolidation from 74.20 to 60.40 area indicates further bearish pressure. The most recent price formed a bearish rejection from the dynamic 20 EMA with a bearish daily candle, indicating additional bearishness to the price.
The above image shows how the price trades below the dynamic 20 EMA, indicating a bearish carry below the 40.20 support level. On the other hand, the indicator window shows how the Relative Strength Index remains below the neutral 50 level, where any selling pressure below the 60.40 level would support the RSI sentiment.
Based on the daily context, the price action at the 60.40 support level should be monitored, where a bearish daily candle below the 60.00 level would bring the price down towards the 40.00 support level. On the other hand, the bearish sentiment in this pair is valid as long as it trades below the dynamic 20 EMA. A bullish recovery with a daily candle above the 74.20 level would be the first sign of the trend reversal that needs further confirmation from the intraday price.

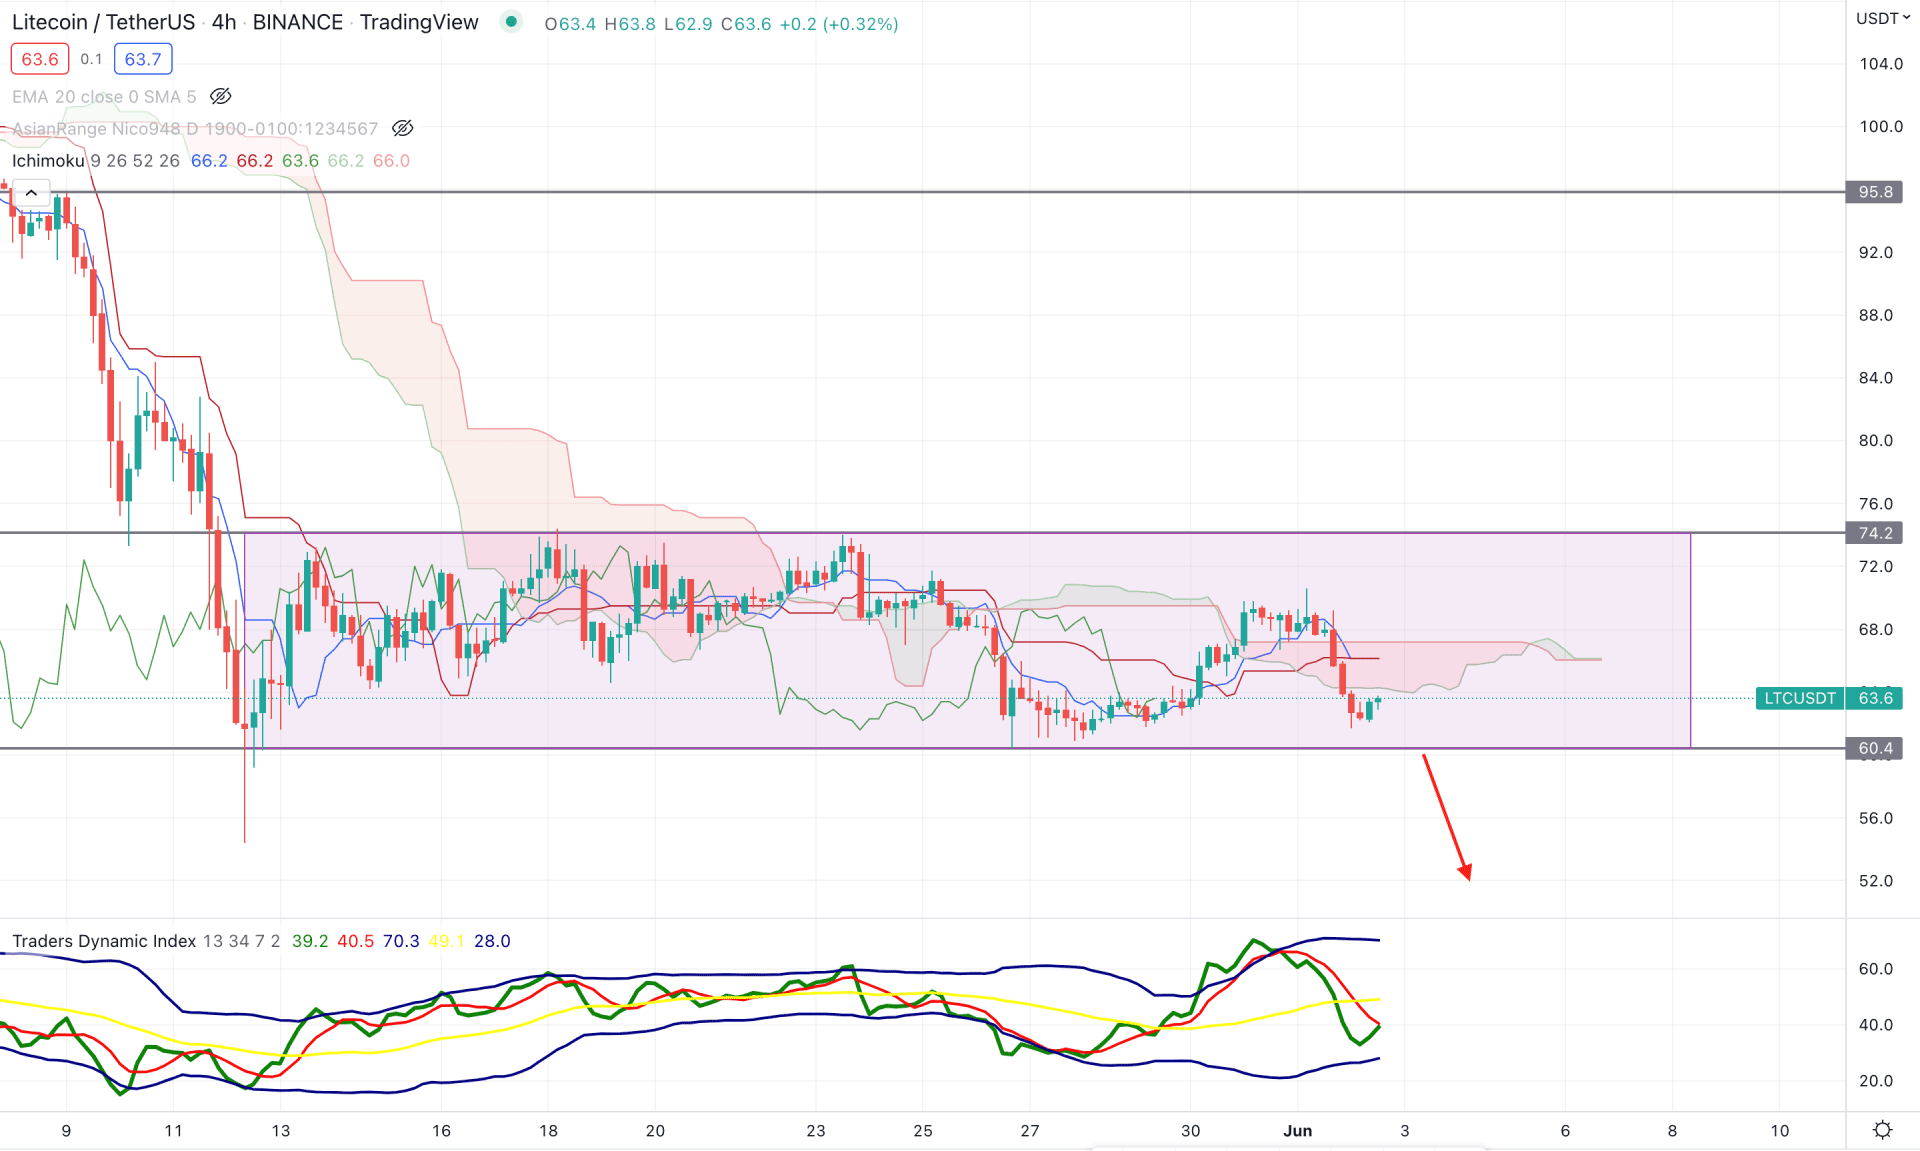
According to the Ichimoku Cloud in the H4 chart, the current market sentiment shows an extreme corrective momentum as the current Tenkan Sen and Kijun Sen lines are flat. Moreover, the future cloud shows no direction where Senkou Span A and Senkou Span B are close. The Lagging Span is also more relative to the price, which gives a clear price direction.
In the indicator window, the Traders Dynamic Index represents buyers'/sellers' strength to the price, whereas the current TDI line also shows a neutral sentiment. However, as the TDI line came from the upper band, the test of the lower band is pending with selling pressure in the price. Meanwhile, the dynamic Kijun Sen is above the price, working as immediate dynamic resistance. In that case, a bearish crossover in Dynamic lines would indicate sellers' comeback with a bearish opportunity.
Based on the H4 context, a bearish H4 candle below the 60.00 level would be the conservative selling opportunity in this pair, where the main target is to test the 40.00 support level. Moreover, further bearish rejection from the dynamic Kijun Sen would also provide a valid bearish opportunity until the price moves above the Kumo Cloud.

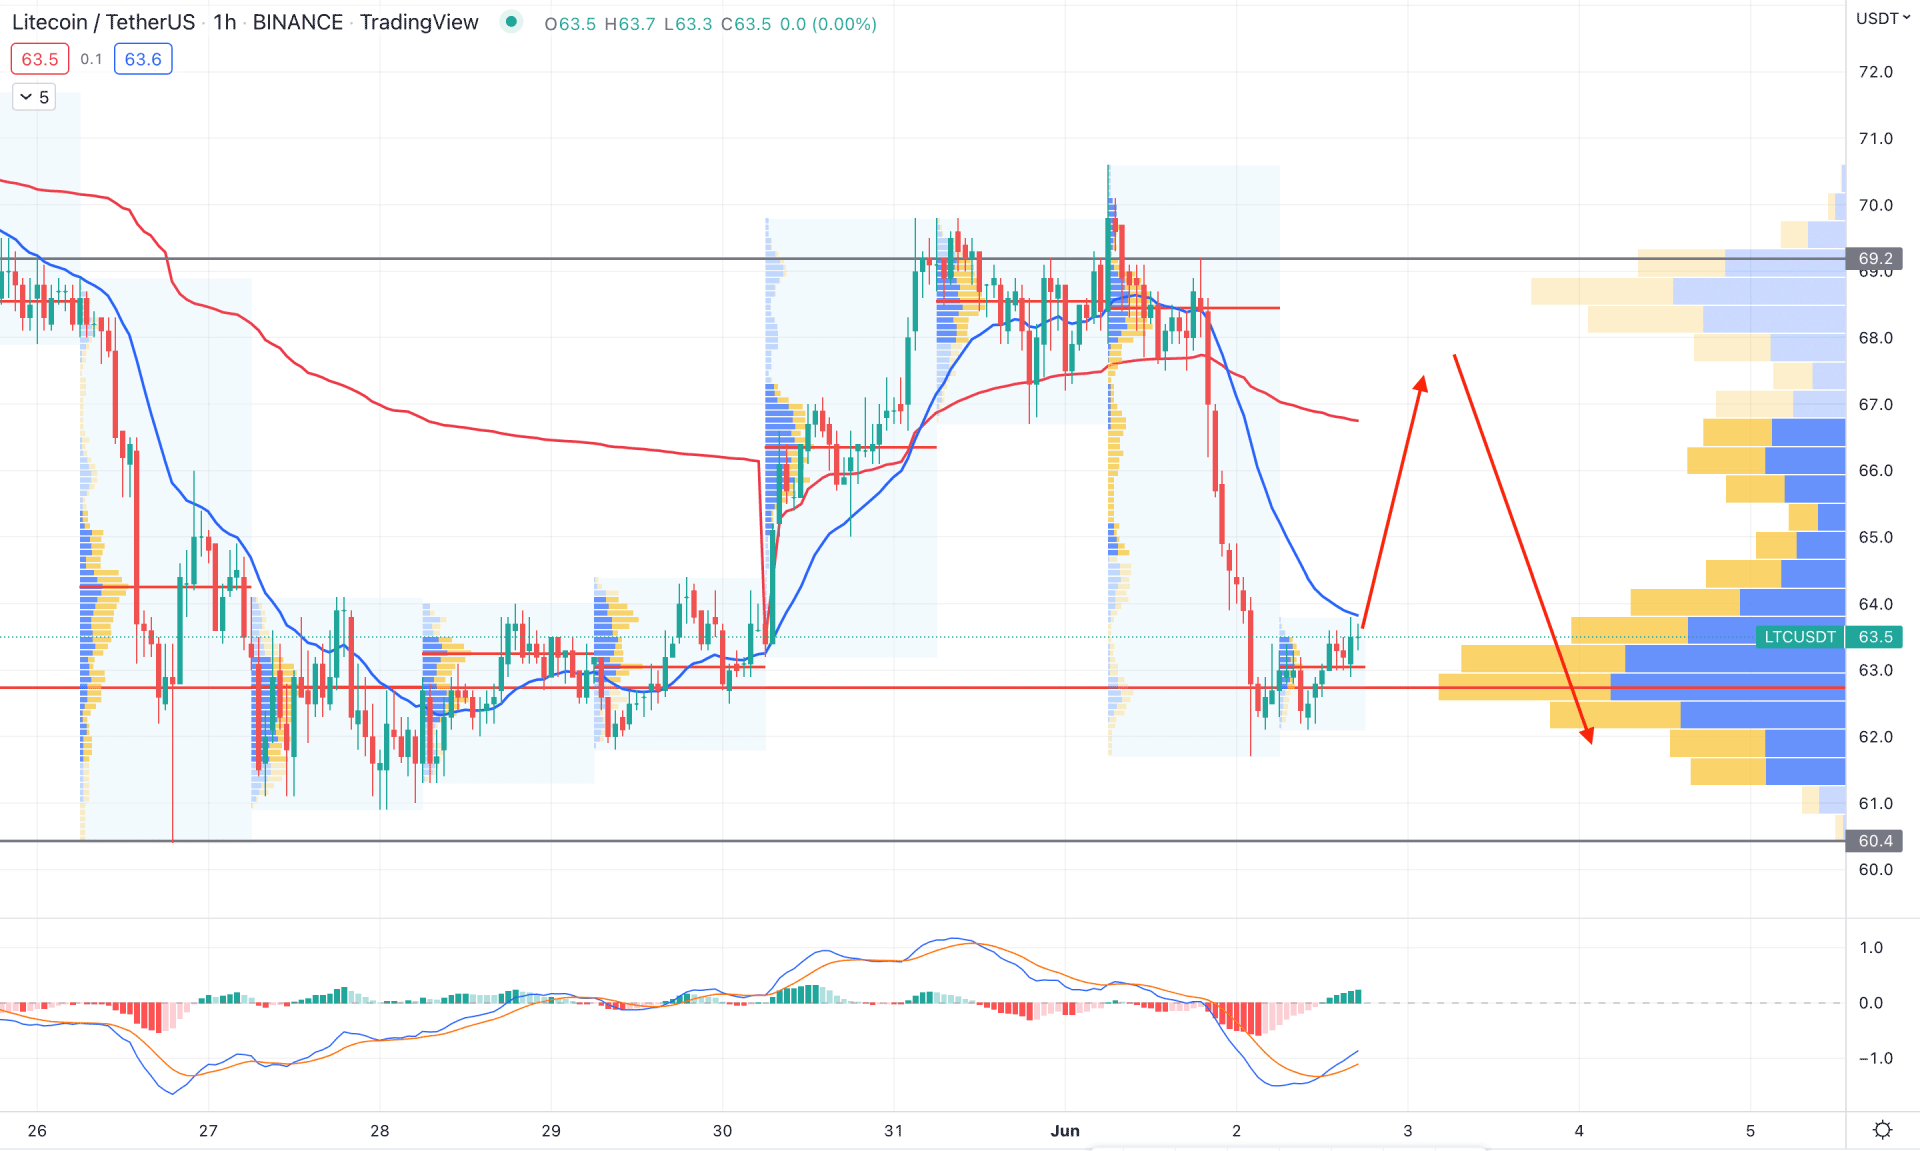
In the intraday chart, the LTC/USDT price is trading within a bullish pressure as the highest volume from the visible range is below the price, working as key support. Moreover, the intense bearish pressure on the latest daily candle created a gap between the price and dynamic weekly VWAP, indicating a bullish correction as a mean reversion. Therefore, as long as the price trades above the 62.80 high volume level, it may extend the bullish pressure towards the dynamic VWAP level.
The above image shows how the MACD histogram shifted its direction from bearish to bullish while the MACD line formed a bullish crossover. Therefore, if a bullish H1 candle appears above the dynamic 20 EMA, it may move higher towards the 69.00 level. On the other hand, the break below the 62.80 level with a bearish H1 close would change the direction from bullish to bearish.
As per the current market context, LTC/USDT is more likely to extend the current bearish trend, although a bullish correction is pending in the intraday chart. In that case, investors should monitor the intraday chart to find a suitable selling opportunity once the correction is over.