
Published: October 19th, 2021
The global crypto market is yet to see Bitcoin ETFs approval that might work as a power booster to altcoins. The weeks started with mixed sentiment in altcoins where LTC/USDT formed multiple bearish wicked daily candle with a bullish vibe. Therefore, investors should see how the debut of the first-ever Bitcoin futures ETF comes. The ProShares Bitcoin Strategy ETF will trade under the ticker “BITO,” which will be available on the New York Stock Exchange. The SEC did not intervene on the ProShares listing within the 75-days filing period. Therefore, this listing will open rooms for Bitcoin futures ETFs Invesco, Van Eck, and Valkyrie. However, dozens of companies are still waiting for approval with their funds.
On the other hand, BTC prices moved above the $60,000 level, where altcoin prices remained corrective this month. Therefore, any positive sign from Bitcoin futures ETFs approval might be a key price driver for altcoins. For Litecoin, there is a strong positive correlation with the BTC, and we may expect the LTC/USDT price would be among the first altcoins to soar higher in the coming days.
Let’s see the upcoming price direction from the LTC/USDT technical analysis:
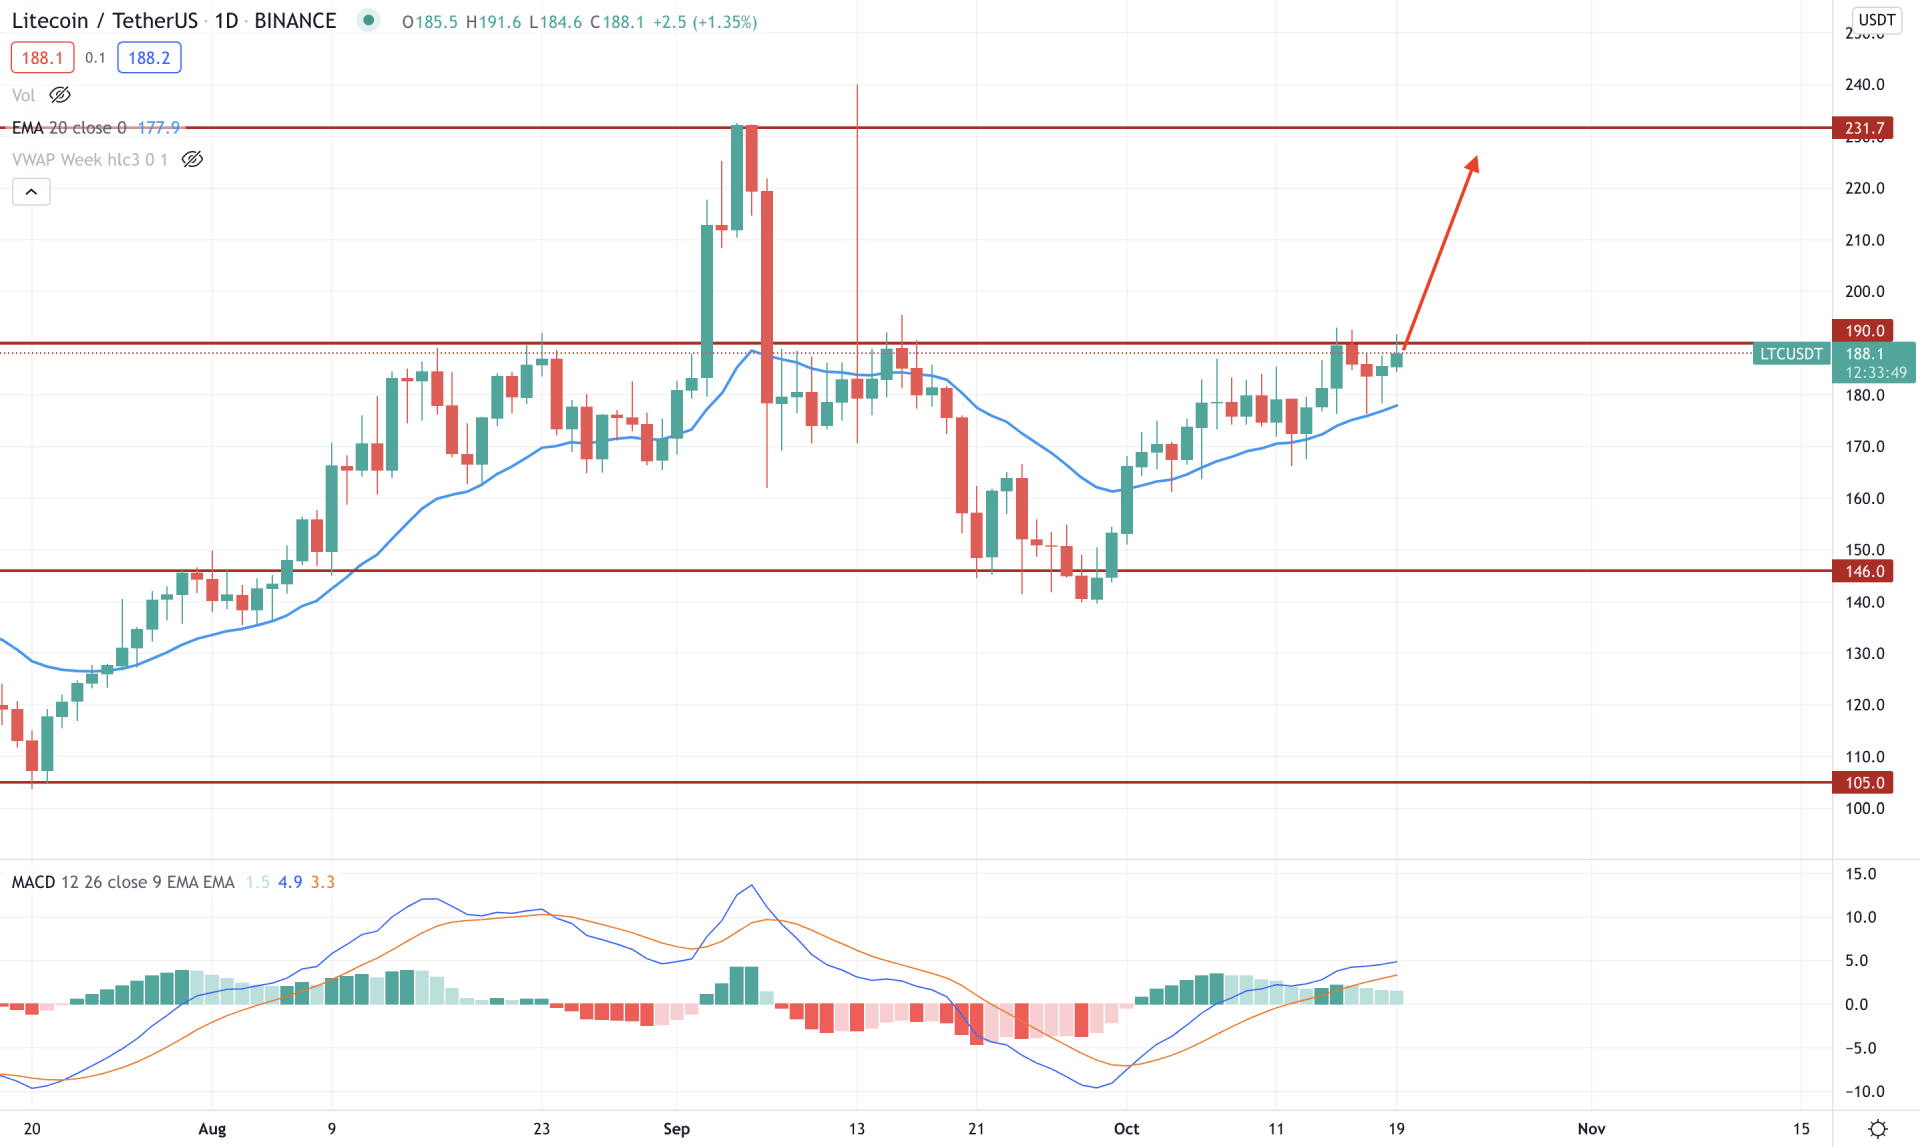
Litecoin’s price peaked higher at 231.00 level in the second half of 2021, where false news regarding Litecoin’s approval on Walmart created a prolonged spike in the price. Despite the fake breakout above the 231.00 level, LTC/USDT remained corrective within 190.00 to 146.00 low. However, the failure to break below the 146.00 level on 30 September 2021 increased the bullish possibility in the price.
In the above image, we can see that the LTC/USDT price rebounded higher with a strong bullish pressure in October that helped bulls to make the price stable above the dynamic 20 EMA. However, later on, the price tried to come lower but failed to break below the dynamic 20 EMA. As a result, the multiple failures and continuous support from the dynamic level increased the buying possibility at 190.00 level. Meanwhile, the MACD Histogram remained bullish where any new higher high with a bullish daily candle may initiate a strong bullish trend.
Based on the daily context, we can say that the LTC/USDT price is trading within a pre-breakout structure. Therefore a bullish daily close above the 190.00 level may take the price higher towards the 231.00 area. On the other hand, a strong bearish daily close below the dynamic 20 EMA may start a broader correction in the price towards the 146.00 level.
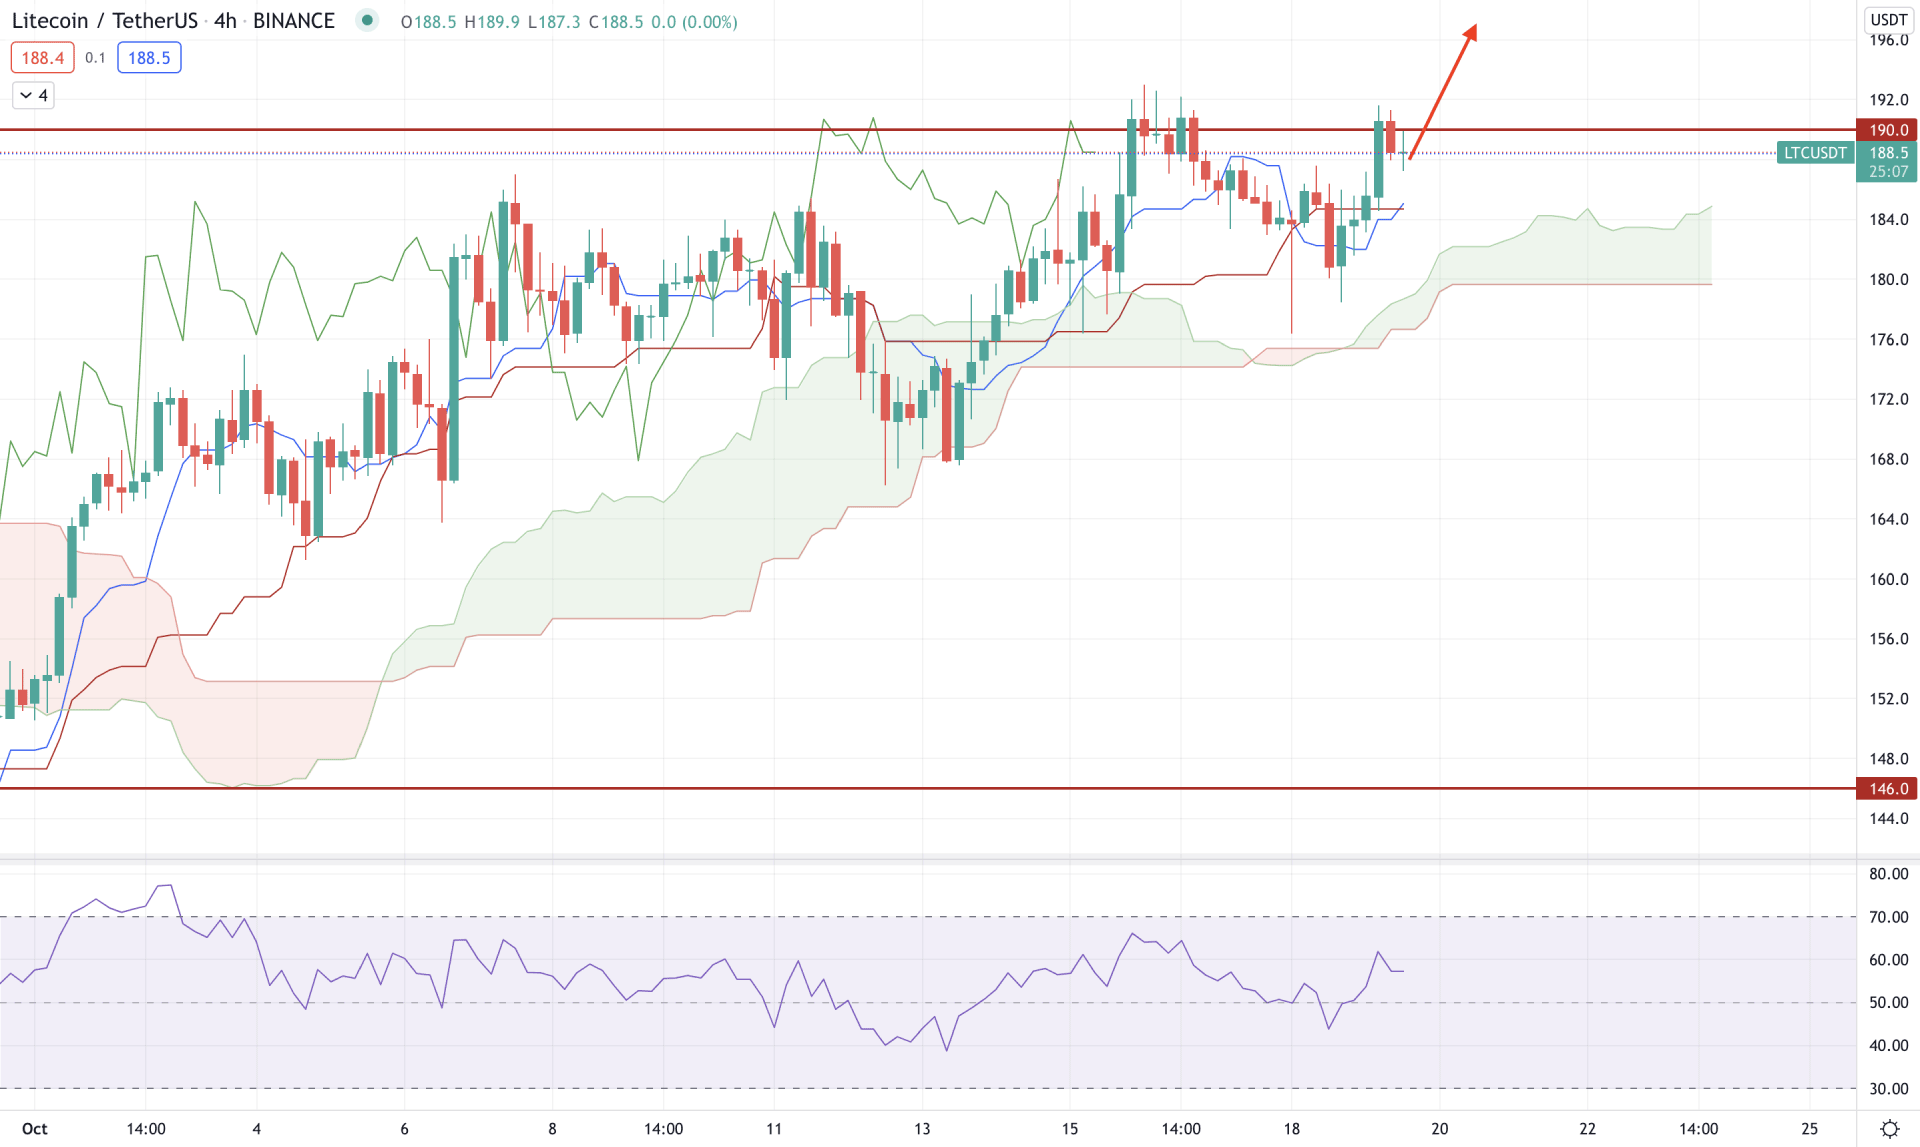
According to the Ichimoku Kinko Hyo, LTC/USDT is moving within a strong bullish trend where Senkou Span A aims higher in the future cloud. Moreover, the lagging span is above the price, and Kumo Cloud is working as major support. In that case, as long as the price is trading above the 180.00 Kumo Cloud support, it has a higher possibility of moving up towards the 231.00 level.
The above image shows how the price is trading above the Kumo Cloud, where the dynamic Tenkan Sen and Kijun Sen support the price. Moreover, the Tenkan Sen has crossed over the Kijun Sen in the current price, which indicates a strong presence of bulls. Meanwhile, the RSI is bullish where the current level is stable above the 50 areas, possibly testing the overbought 70 levels.
Based on the H4 context, we may expect the price to move higher in the coming days. In that case, a bullish H4 close above the 190.00 level may boost the buying pressure. On the other hand, a stable bearish H4 closing below the 180.00 level may alter the current market structure and lower the price towards the 146.00 area.
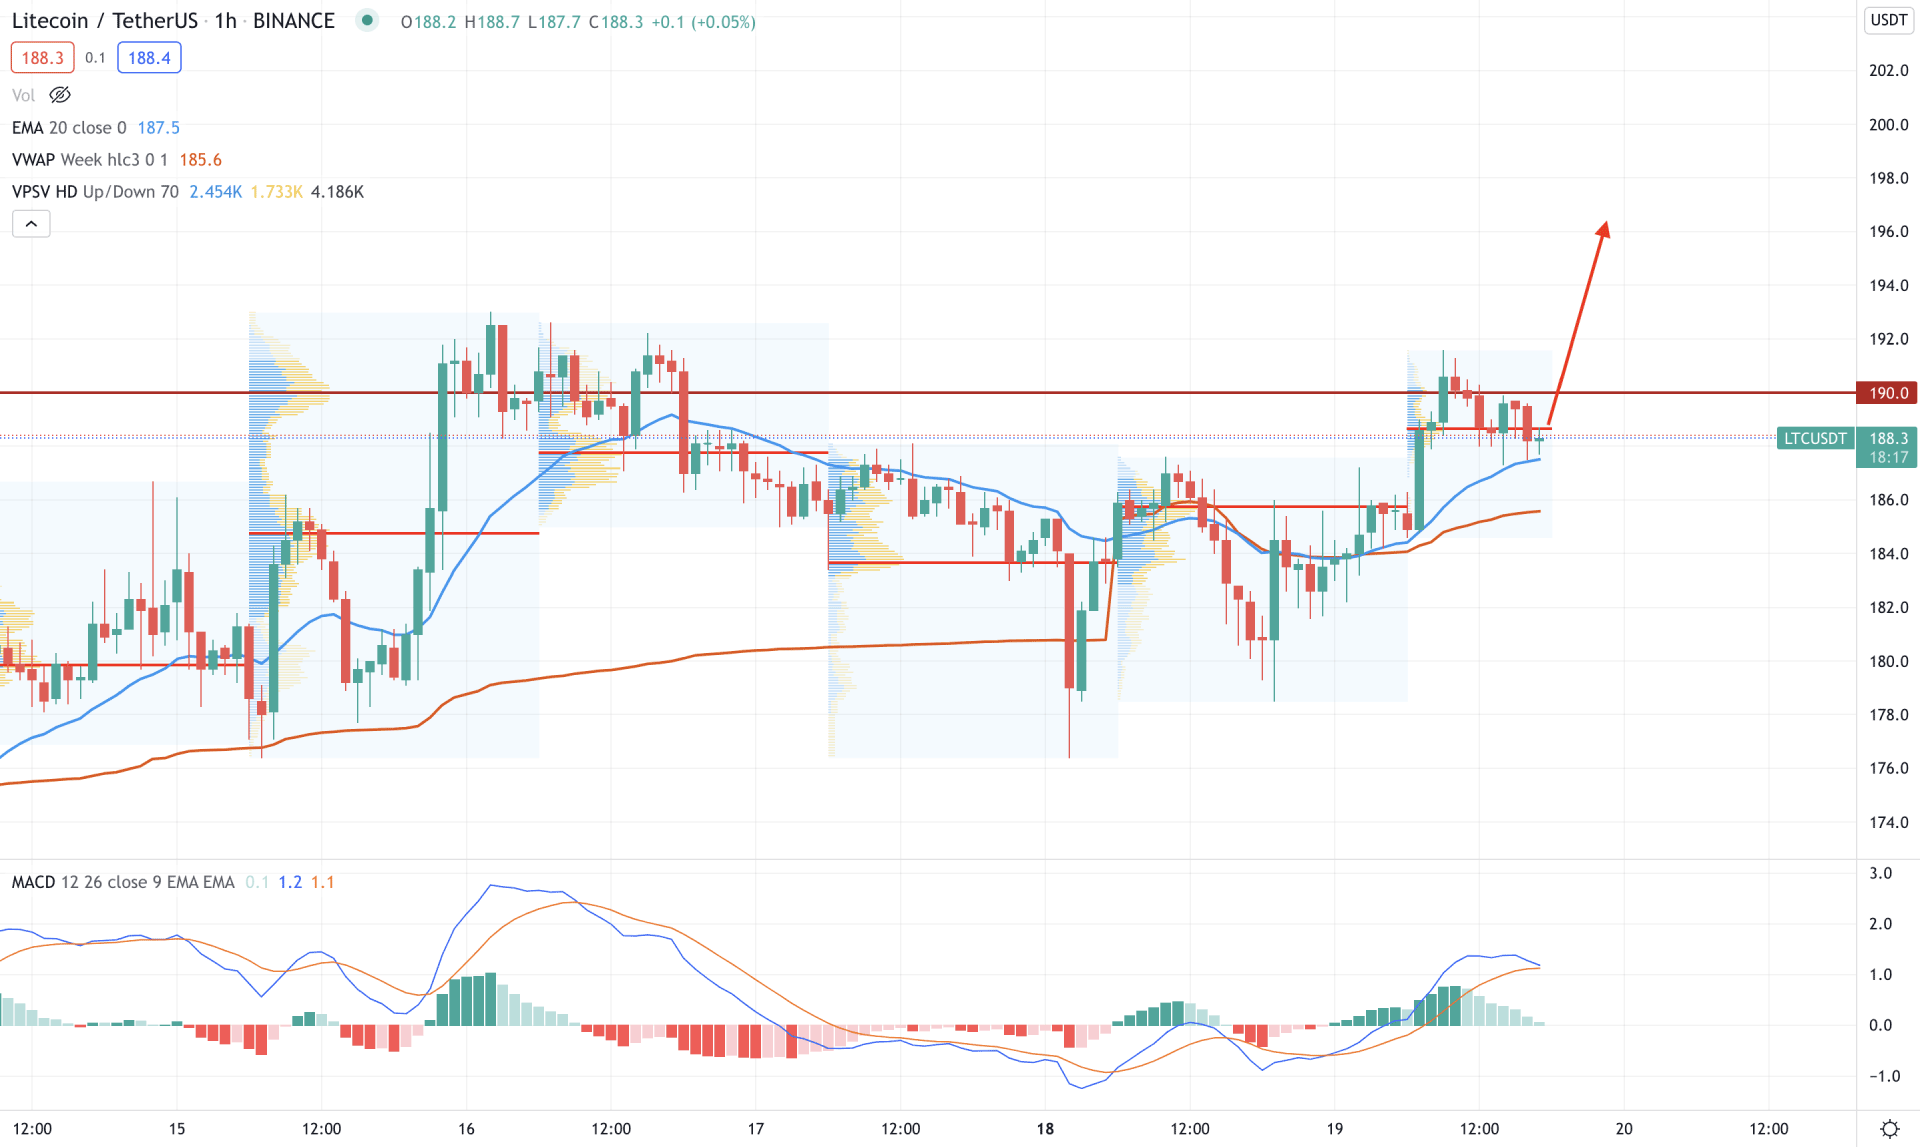
LTC/USDT is trading within a strong bullish pressure in the intraday chart as the price is trading above the dynamic 20 EMA and weekly VWAP. However, the current price is still below the 190.00 resistance level while the MACD Histogram is zero. Therefore, a bullish H1 close above the 190.00 level may resume the current trend towards the 200.00 area.
The above image shows how the price is trading at the most recent high volume area of 188.60 level. Therefore, investors should find a strong bullish price action above the 188.60 level to join the possible bullish rally. On the other hand, a solid bearish H1 close below the dynamic VWAP may start a broader correction to the price.
As per the current market condition, LTC/USDT may grow higher if a sufficient bullish activity is shown above the 190.00 level. In that case, the primary target of the bull run would be towards the 220.00 area. On the other hand, a stable bearish H4 close below the 180.00 level may alter the current market structure.


