Published: August 1st, 2023
As the Litecoin halving event approaches, the fundamentals of the network are exhibiting remarkable expansion. The sentiment of the mining community is measured by two crucial indicators: hash rate and difficulty. The Litecoin Foundation reports that the LTC hash rate has steadily increased since the beginning of 2023, reaching an astounding 869.9 TH/s with a difficulty level of 25.64 million.
This increase in hash rate indicates a substantial influx of miners joining the Litecoin community, resulting in a more secure and dependable network.
The Litecoin halving procedure, which occurs every four years or every 840,000 blocks, halves mining rewards, eventually resulting in no more LTC coins being mined by the year 2142. Traders and holders prepare for this event, anticipating optimistic outcomes consistent with the positive reaction observed during previous coin halvings.
According to a tweet from Santiment, key traders with significant LTC holdings spanning from $9,500 to $950,000 are rapidly accumulating more as the highly anticipated halving event approaches.
In addition, social engagement surrounding Litecoin is on the rise, with social analytics service LunarCrush reporting 2.16 million social engagements in just one hour on July 30. This increased social activity reflects the increased participation and activity within the Litecoin community.
Let’s see the upcoming price direction of Litecoin (LTC) from the LTC/USDT technical analysis:
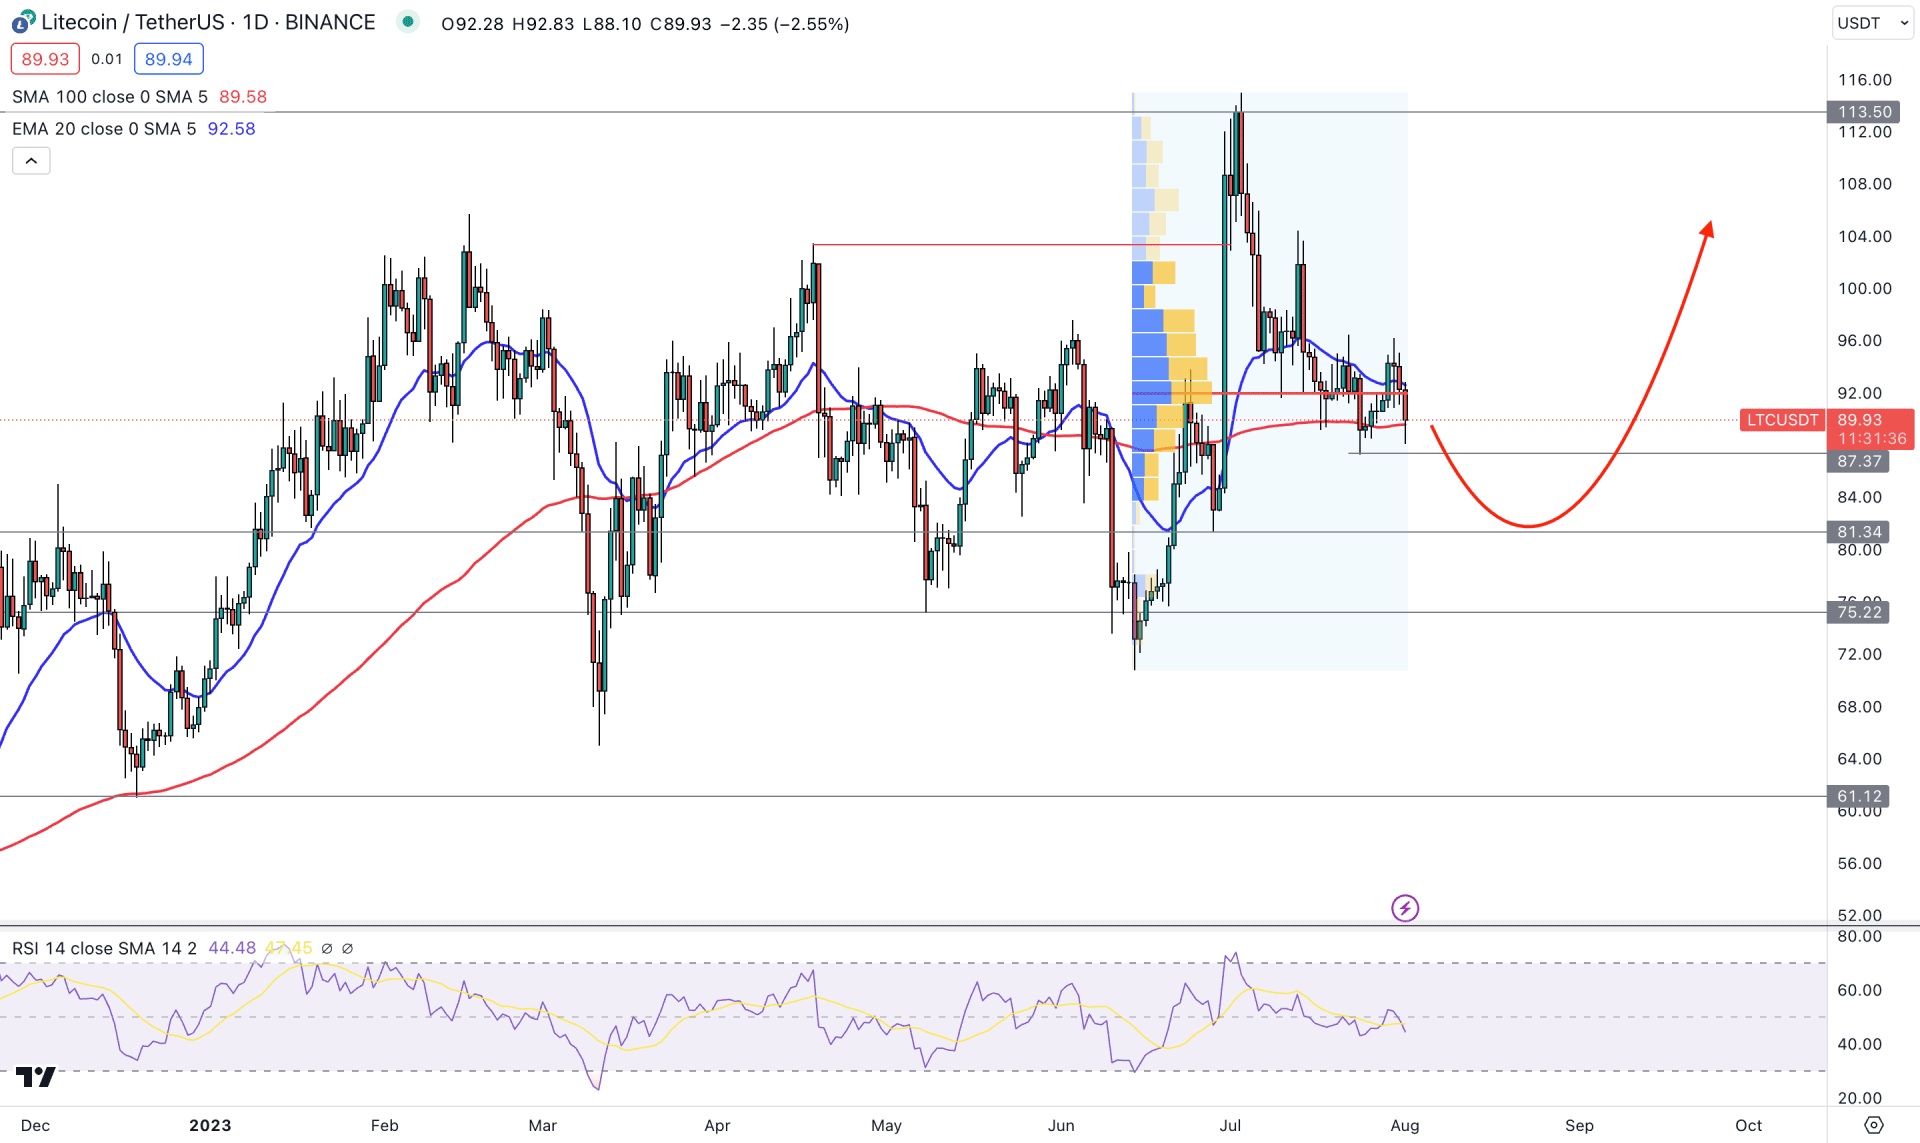
In the daily price, the broader outlook of the LTC/USDT is bullish as the recent price forms an impulsive bullish pressure, indicating a trend change.
The upward momentum is backed by a bearish liquidity sweep at the 75.22 key support level, from where the bullish pressure has come. Moreover, an immediate recovery with a bullish CHoCH formation at the 103.40 swing high indicates buyers' presence in the market.
The bullish pressure is also supported by the higher timeframe price action, where the latest weekly candle shows a bearish correction after an impulse. It is a sign that bulls are still present in the market and can regain momentum at any time.
The corrective price behavior is seen in the daily chart, where the price hovers at the 20 EMA area while the 100-day SMA is flat below the current price.
The current 14-period Relative Strength Index (RSI) showed a downside possibility by moving below the 50.00 line in the indicator window. It is a sign that sufficient downside correction is pending, and a bullish rejection is needed to anticipate a long position.
Based on the daily price outlook, the buying pressure is likely to form in this pair, but an additional sellers’ failure is needed to form. In that case, investors should monitor how the price reacts in the 87.00 to 76.00 zone as a strong buying pressure from this area could increase the price towards the 110.00 level.
The alternative trading approach is to look for a stable price below the 75.00 level with a D1 candle close, which might extend the loss toward the 55.00 key level.
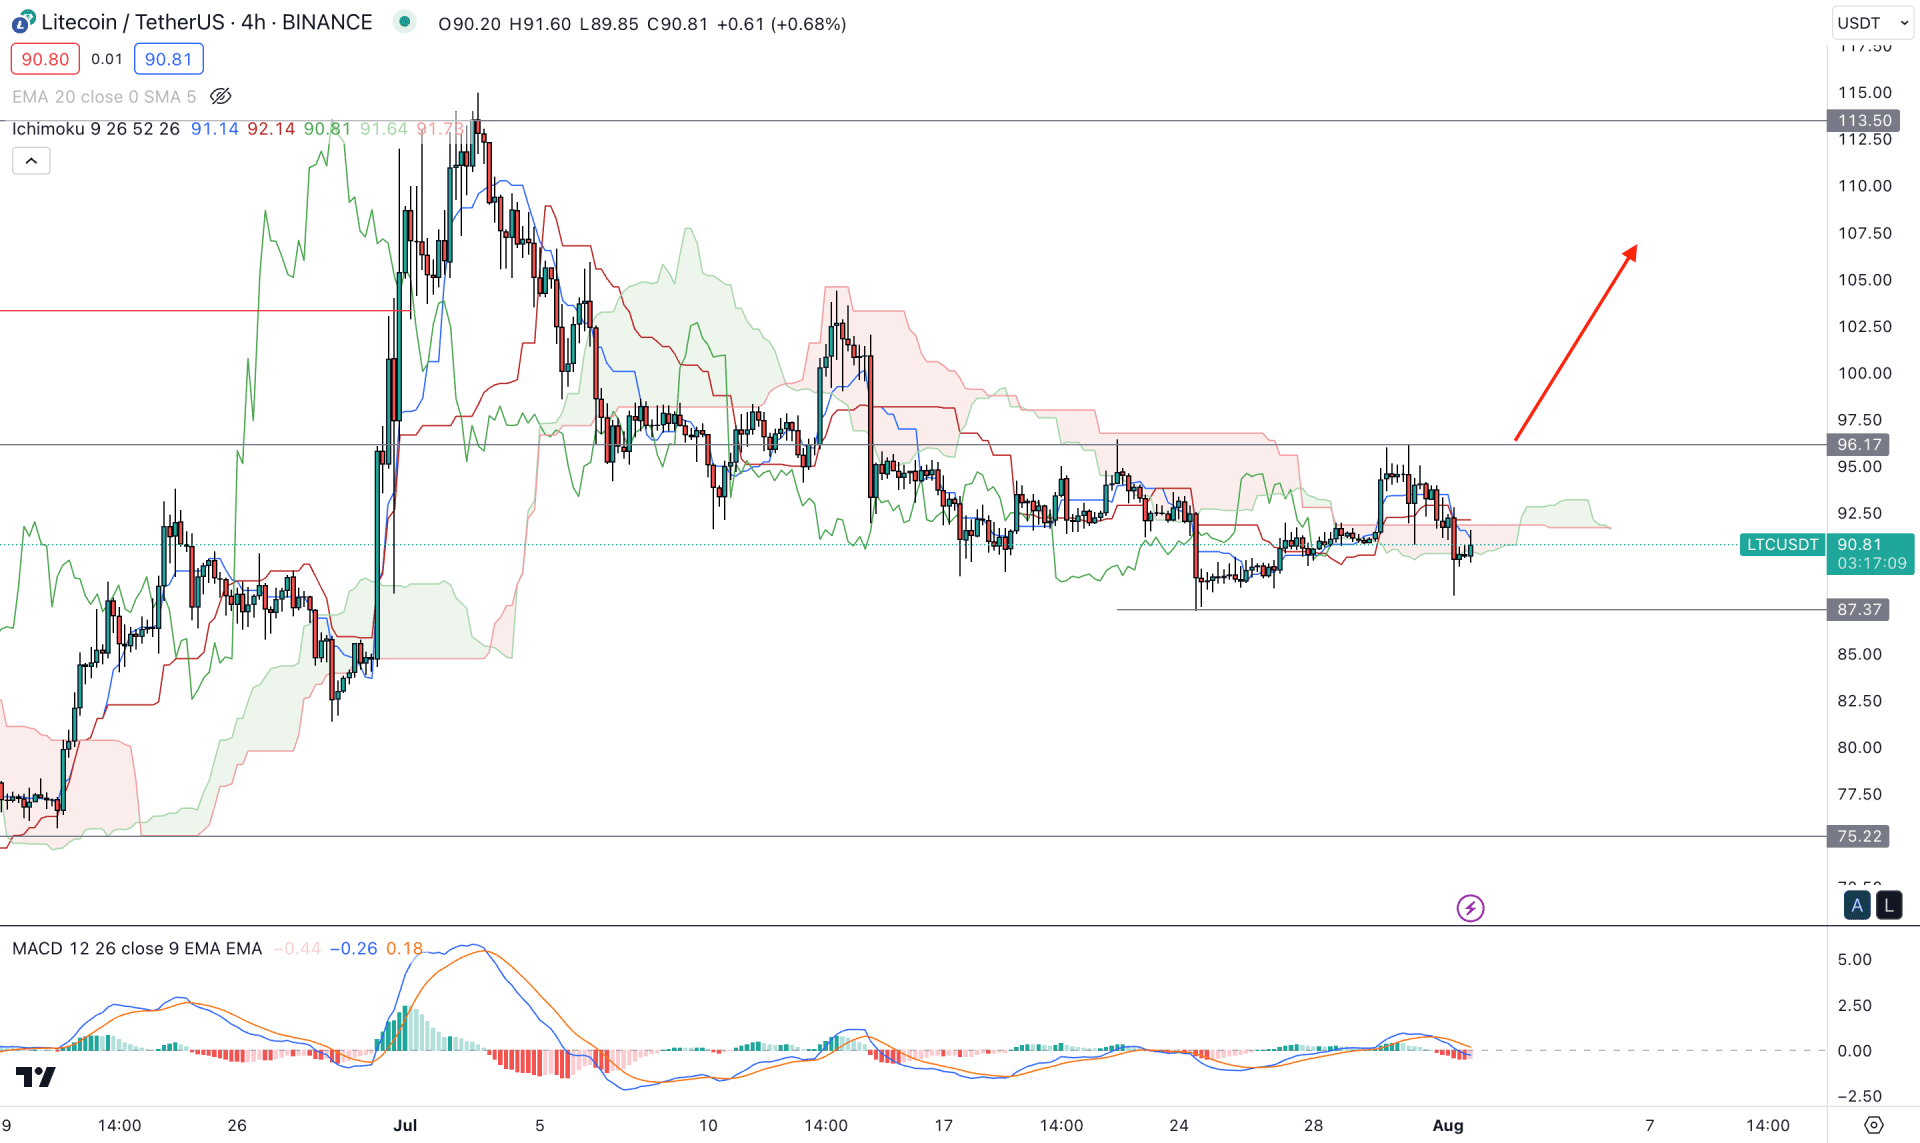
In the H4 timeframe, the corrective price momentum is visible as the most recent price remained sideways within the 96.17 to 87.37 area. Therefore, the primary outlook for this instrument is to look for a breakout from this zone before anticipating a fresh trend.
In the current structure, the future could be corrective, where the Senkou Span A should move above B before anticipating a bullish trend. Moreover, the current MACD Histogram is below the neutral zone but in a corrective mode, indicating indecision.
Based on the h4 structure, a bullish H4 candle above the 96.00 level could be a conservative buying approach in this pair, targeting the 113.50 swing high. On the other hand, any bearish rejection from the dynamic Kijun Sen with an H4 candle below the 87.00 level could lower the price towards the 72.00 area.
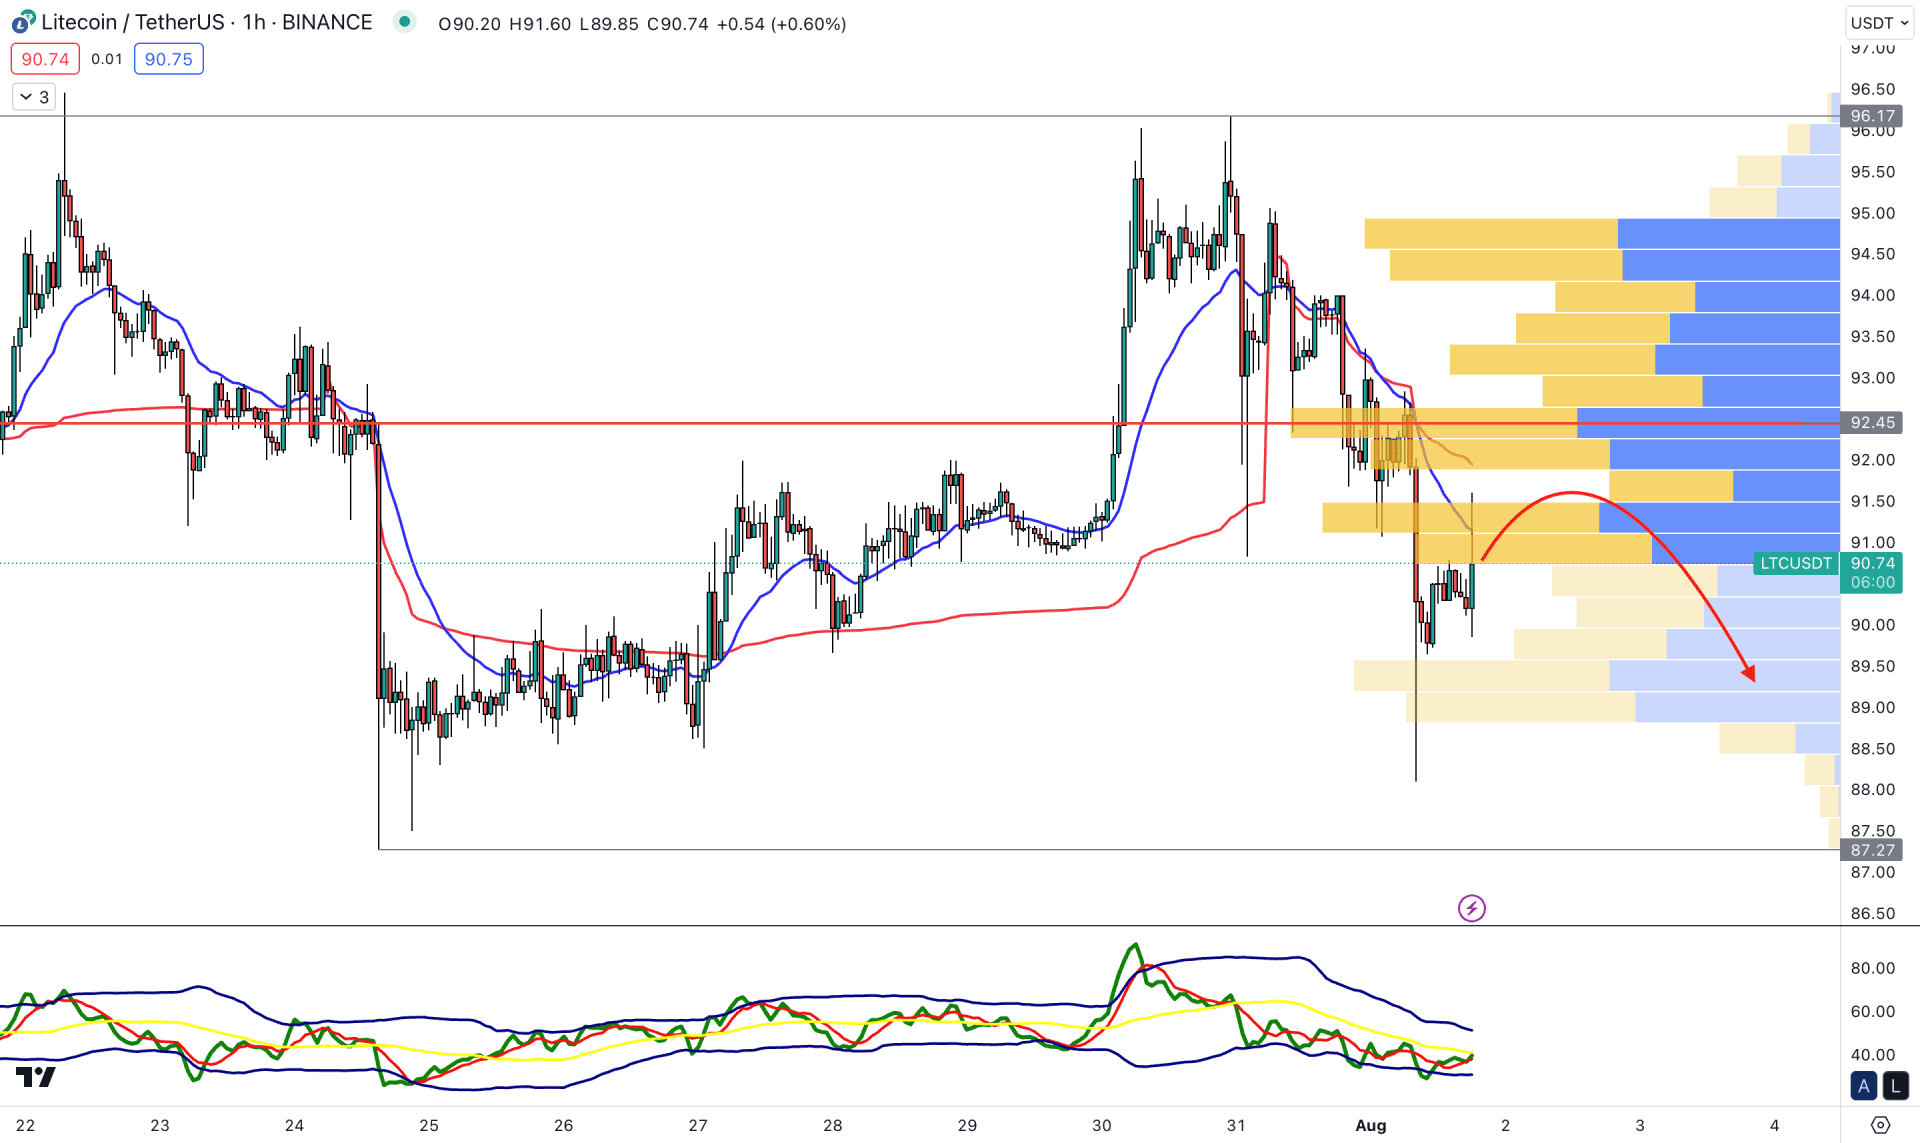
The H1 chart shows the current market structure is bearish as the recent visible range high volume level is above the current price. Moreover, the dynamic 20 EMA is above the current price, working as an immediate resistance, which could work as a confluence resistance to bears.
In the indicator window, the current TDI level remains corrective at the lower band area, which is a sign of an oversold market condition.
Based on the H1 structure, an immediate bullish H1 candle above the visible range high volume level is needed before anticipating a long movement. On the other hand, any immediate bearish rejection from the 91.00 to 93.00 zone could be a bearish trend continuation opportunity, targeting the 85.00 level.
Based on the current market structure of LTC/USDT, the broader outlook is corrective, where a sufficient downside correction is pending. In that case, investors should closely monitor the price and find a significant bullish rejection from the intraday support level to open a long position.


