
Published: August 14th, 2020
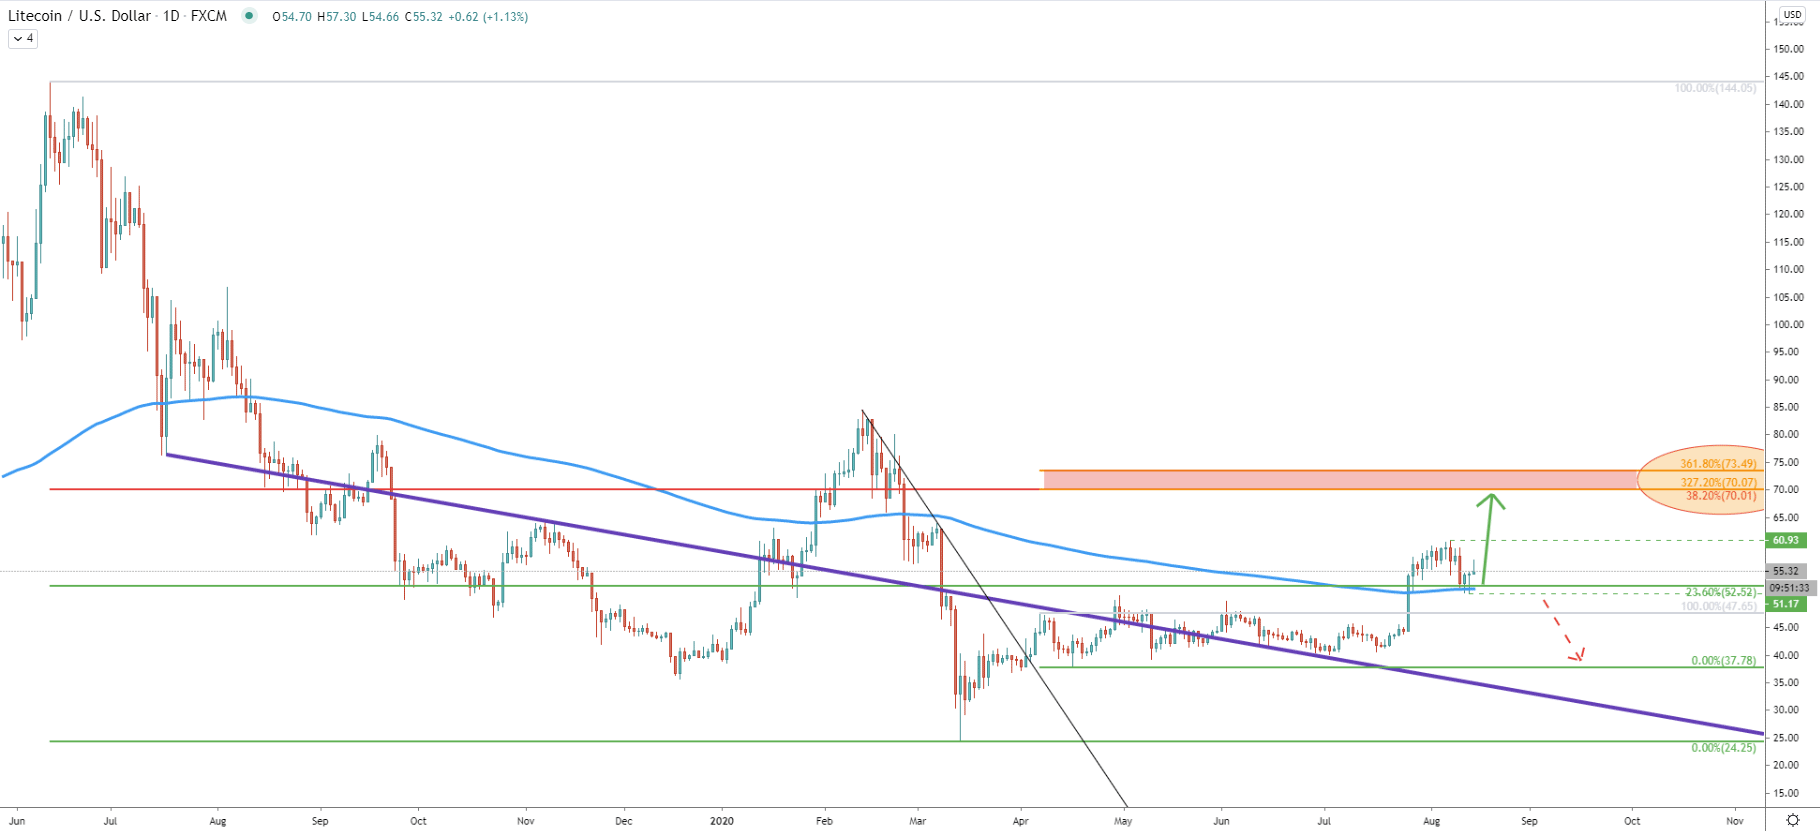
On the Daily chart, we can see the average-price downtrend trendline, which has been active during the period of over one year. On July 2 there was the last rejection of the trendline after which the price went up sharply. LTC/USD rose from $40 up to $60 in a matter of just a few weeks and on the way up broke above the 200 Exponential Moving Average.
Fibonacci retracement indicator was applied to the overall downtrend, which started in June 2019. We can see that the 23.6% retracement level at $52.52 was broken and currently acting as the support, along with the 200 EMA. Perhaps this is the beginning of the next wave, which is highly likely to be heading north. Another Fibs was applied to the corrective wave down after price broke above the downtrend trendline. And it shows that 327.2% Fibs precisely corresponds to the 38.2% Fibs, both of which are located at $70. This is an extremely strong psychological level which is also confirmed by technical indicators and is expected to be the nearest upside target.
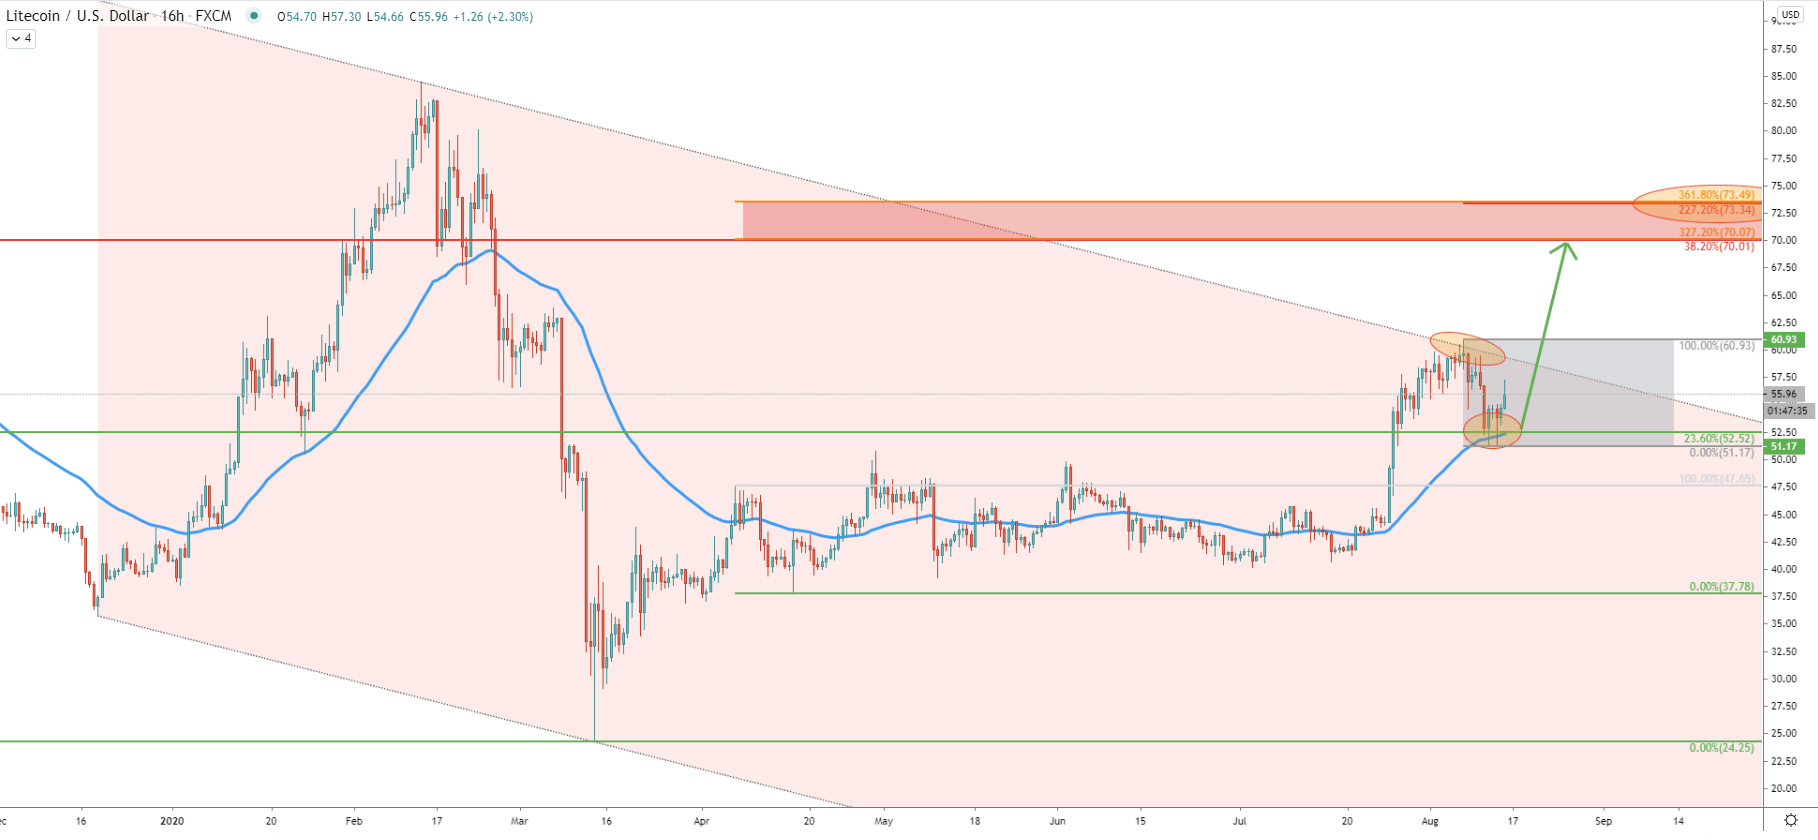
While the probability of the trend remains up, we must also pay attention to the rejection of the upper trendline of the descending channel, which occurred on August 7. This has already resulted in the corrective move down, where 50 SMA was rejected. This means that price is stuck between the $52.50 support and $61.00 resistance areas for the time being.
In regards to the upside potential, we have applied the Fibonacci retracement indicator to the current pullback, which shows that 227.2% Fibs precisely corresponds to the second upside target at $73.50 as per the daily chart. If price will reach this level, the overall growth from the current price will be equivalent to 30%.
Price has been moving within the ascending channel up until the end of July. Then LTC/USD broke above, reached $60.93 high, and corrected down. On the correction price rejected the 200 EMA, providing a strong buying opportunity, considering that it is a trend following scenario.
The first upside target at $70.00 corresponds to the upper trendline of the extended ascending channel and suggests that the Litecoin could test this level around August 31, which is just two trading weeks away from today.
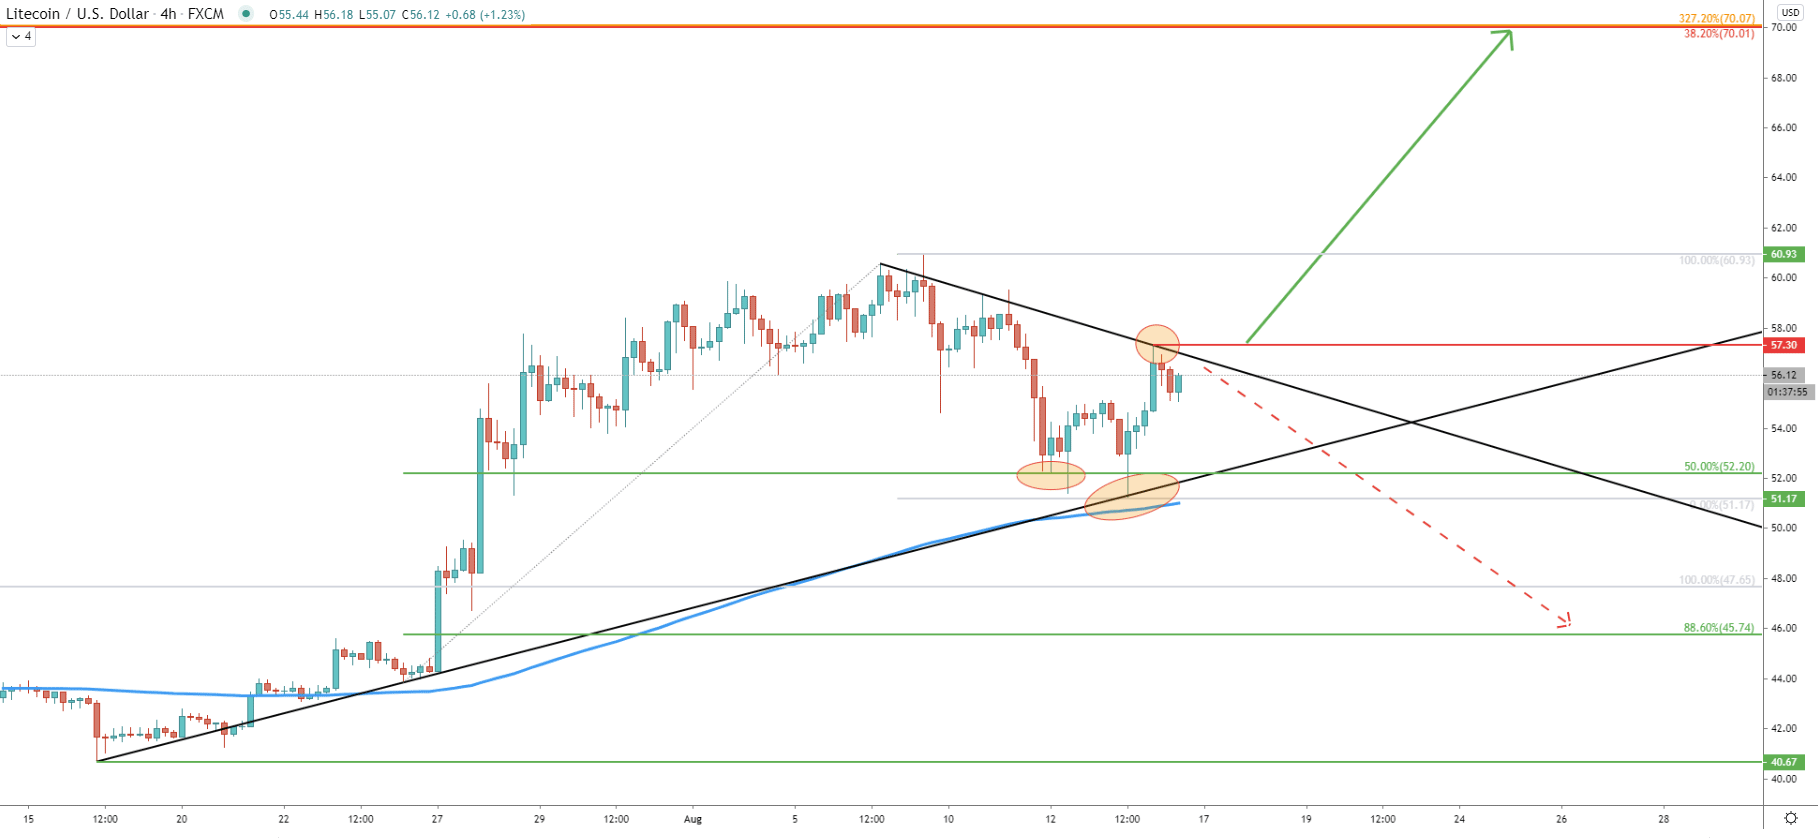
Current correction down was stopped by the uptrend trendline, which yesterday was rejected very cleanly. But prior to that, there already was another rejection of the 50% Fibonacci retracement level at $52.20. Price attempted to break below, but only produced spikes and rejected the trendline.
However, today LTC/USD has reached and bounced off the downtrend trendline at $57.30, which means that there is still not enough buying power to continue moving higher. Maybe the best approach that buyers will take, is to wait for untilt the price breaks above and only then take action and strongly consider a buying opportunity. Because as long as price remains below the resistance, the risk of the downside move towards the 88.6% Fibs at $45.74 must not be ignored.
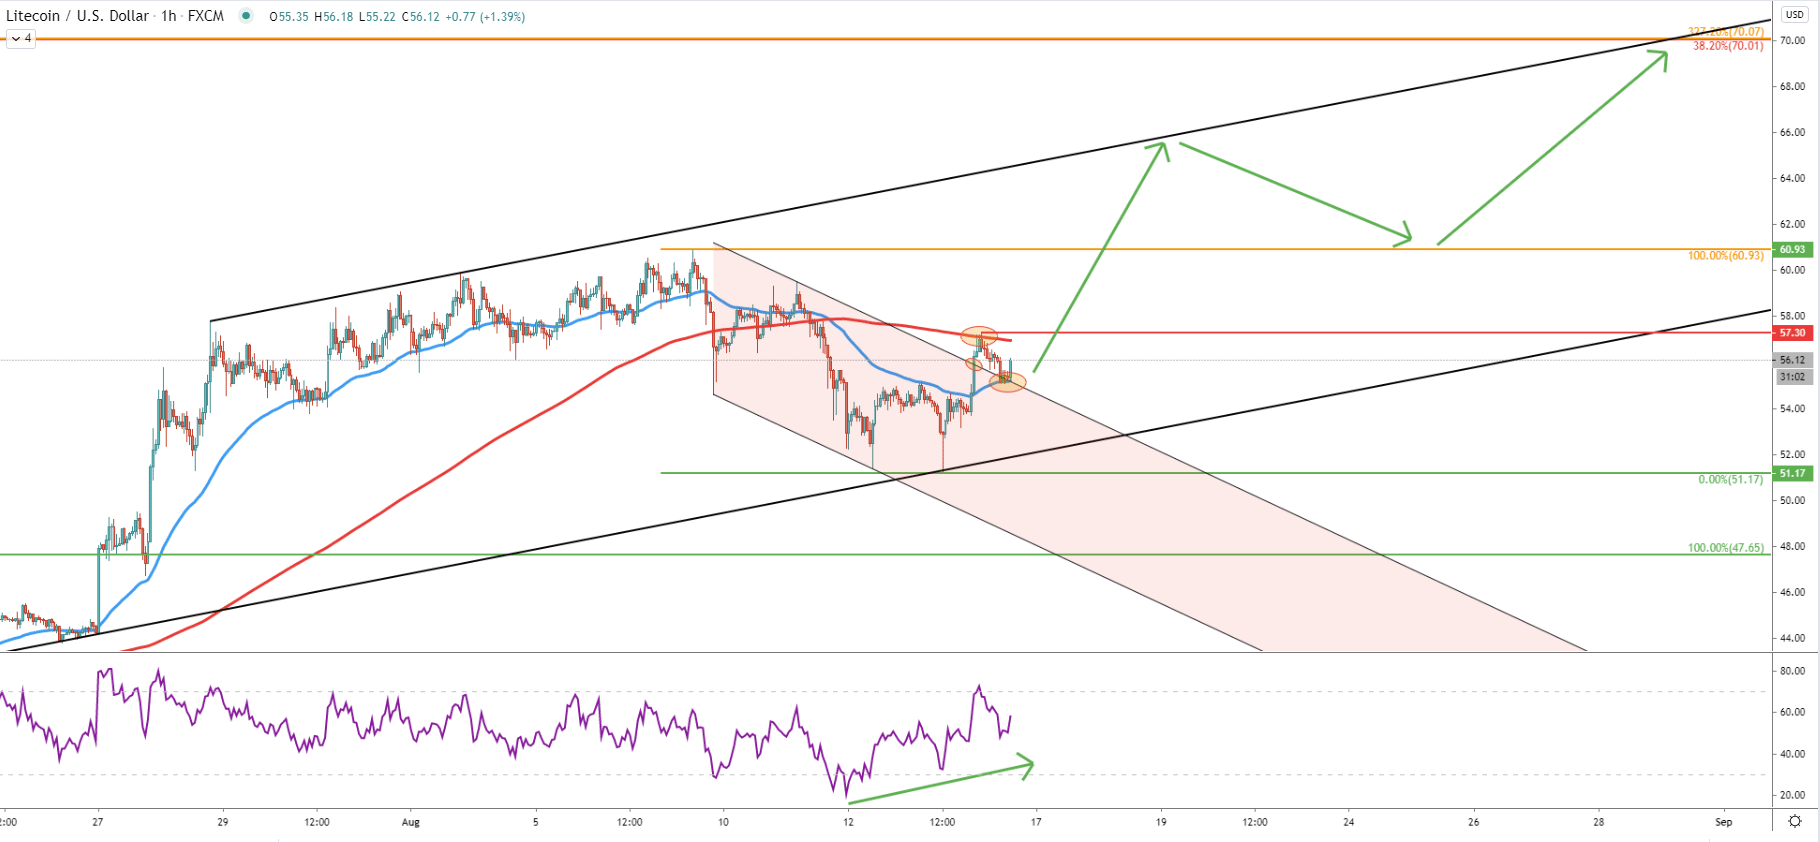
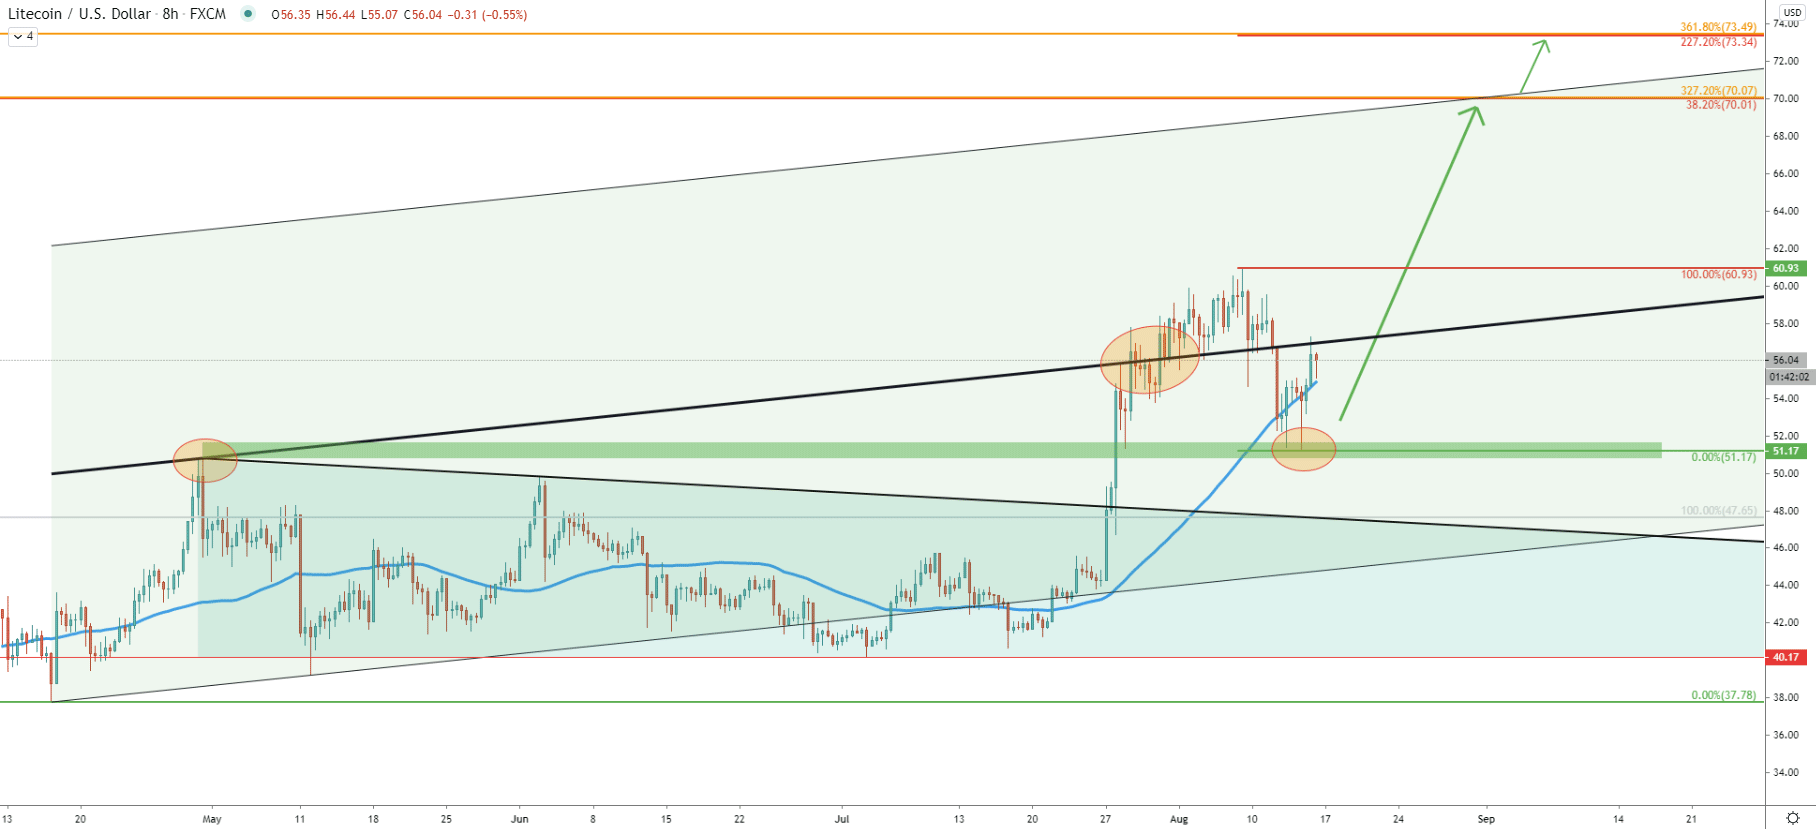
On the 1-hour chart price rejected the $51.17 level where it produced a double bottom. Simultaneously, the RSI oscillator has formed a bullish divergence after which price broke above the descending channel. But now price stuck between two moving averages, the 50 EMA which is the support, and the 200 EMA which is the resistance.
When/if price breaks above the $57.30, Litecoin uptrend should continue and as per the resistance uptrend trendline and the first upside target crossing, the $70 level could be reached by the end of this month.
Along with the Bitcoin, many top altcoins are also on the rise. Currently, there is a short term consolidation phase on LTC/USD, and break above the resistance should confirm the uptrend, at least for the short term. Based on the crossings of the first resistance level, the resistance trendline, and the upper trendline of the extended ascending channel, there will be two weeks of an uptrend, which might start at any time.
As per the Daily and 16-hour chart, there are two main resistance levels to watch in the next two weeks. Each of them is confirmed by at least two Fibonacci retracement levels which are located at $70.00 psychological level and $73.34.
As per the Daily and 4-hour chart, currently, price is facing a minor resistance at $57.30, and as long as it holds, the risk of a stronger downside correction remains high. Daily break and close below the $51.17 will confirm a strong selling pressure which might result in the price drop towards the 88.6% Fibs at $45.74.
Support: 51.17, 47.65, 45.74
Resistance: 57.30, 60.93, 70.00, 73.34