
Published: December 19th, 2023
LQTY serves as a token responsible for capturing the commission revenue produced by staking on the Liquity Protocol. Liquidity, a decentralized borrowing protocol, facilitates the acquisition of 0% interest loans by users through the pledge of Ether.
LQTY, which had a market capitalization of $126 million, debuted in 2023 at approximately $0.575. Subsequently, it underwent a substantial upswing, surpassing $3.30 by mid-March—a remarkable increase of approximately 500%. Significant events that occurred during the initial quarter of the year contributed to the increase in the price of LQTY.
Interest in the token increased in March as a consequence of the unrest caused by the depegging of USDC, the second-largest stablecoin issued by Circle. This occurrence precipitated a significant decline in the value of USDC. The decentralized platform of Liquity, on which loans are settled in the principal token LUSD, was declared the victor. In contrast to LUSD, which remained pegged to the dollar, LQTY witnessed an extraordinary surge.
LQTY also benefited from a directive issued by a New York regulator during this time period, which instructed Paxos to cease minting its centralised dollar-pegged cryptocurrency, BUSD. This advancement has generated apprehensions regarding a possible regulatory assault on the centralised stablecoin ecosystem as a whole.
Let’s see the upcoming price direction of Liquity from the LQTY/USDT technical analysis:
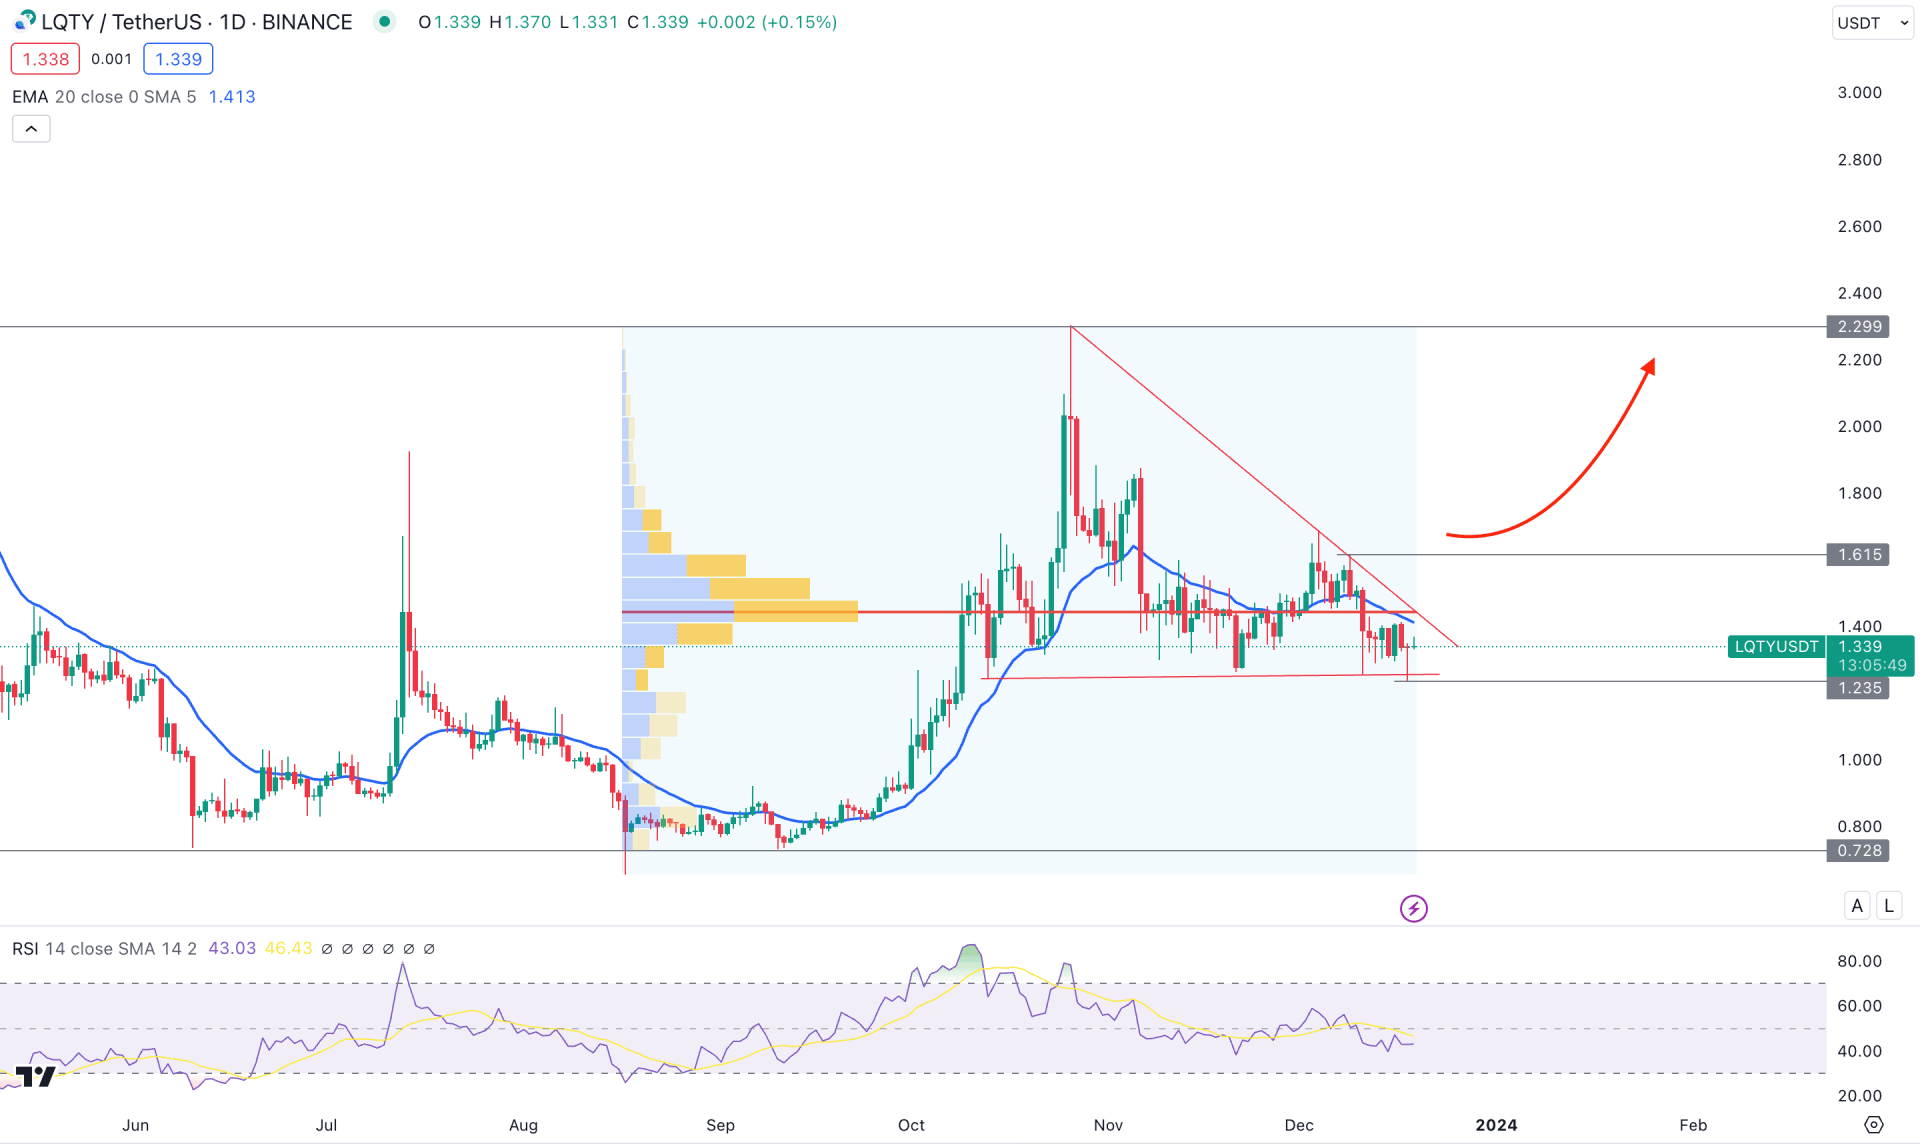
In the daily chart of LQTY/USDT, a strong bull run is visible where the recent price trades sideways after setting a top. In this price behaviour, the ideal trading approach is to wait for the correction to be over and find long opportunities based on price actions.
In the volume structure, the latest high volume level since August 2023 is marked at the 1.445 level, which is above the current price. It is a sign of an ongoing consolidation, from where a strong bullish break is needed before anticipating a long opportunity.
In the higher timeframe, an inside far formed in November followed by the strong bullish candle in the previous month. As the current price still holds within October’s low, investors might expect a bullish continuation after a valid signal. The weekly price suggests a corrective price action, from where a bullish pennant breakout could activate the monthly chart’s buying opportunity.
A clearer view is visible on the daily timeframe, where the current price hovers below the dynamic 20-day EMA. Moreover, the 14-day RSI shows a bearish continuation by holding the momentum below the 50.00 line. In that case, a new swing low below the 1.235 support level could be a short opportunity in this pair, targeting the 0.728 level.
Bulls might find it challenging to resume the long-term bullish trend as the near-term Moving Averages are above the current price. In that case, a valid daily close above the 1.615 swing high could be a strong bullish opportunity, where the main aim would be to test the 2.299 high.
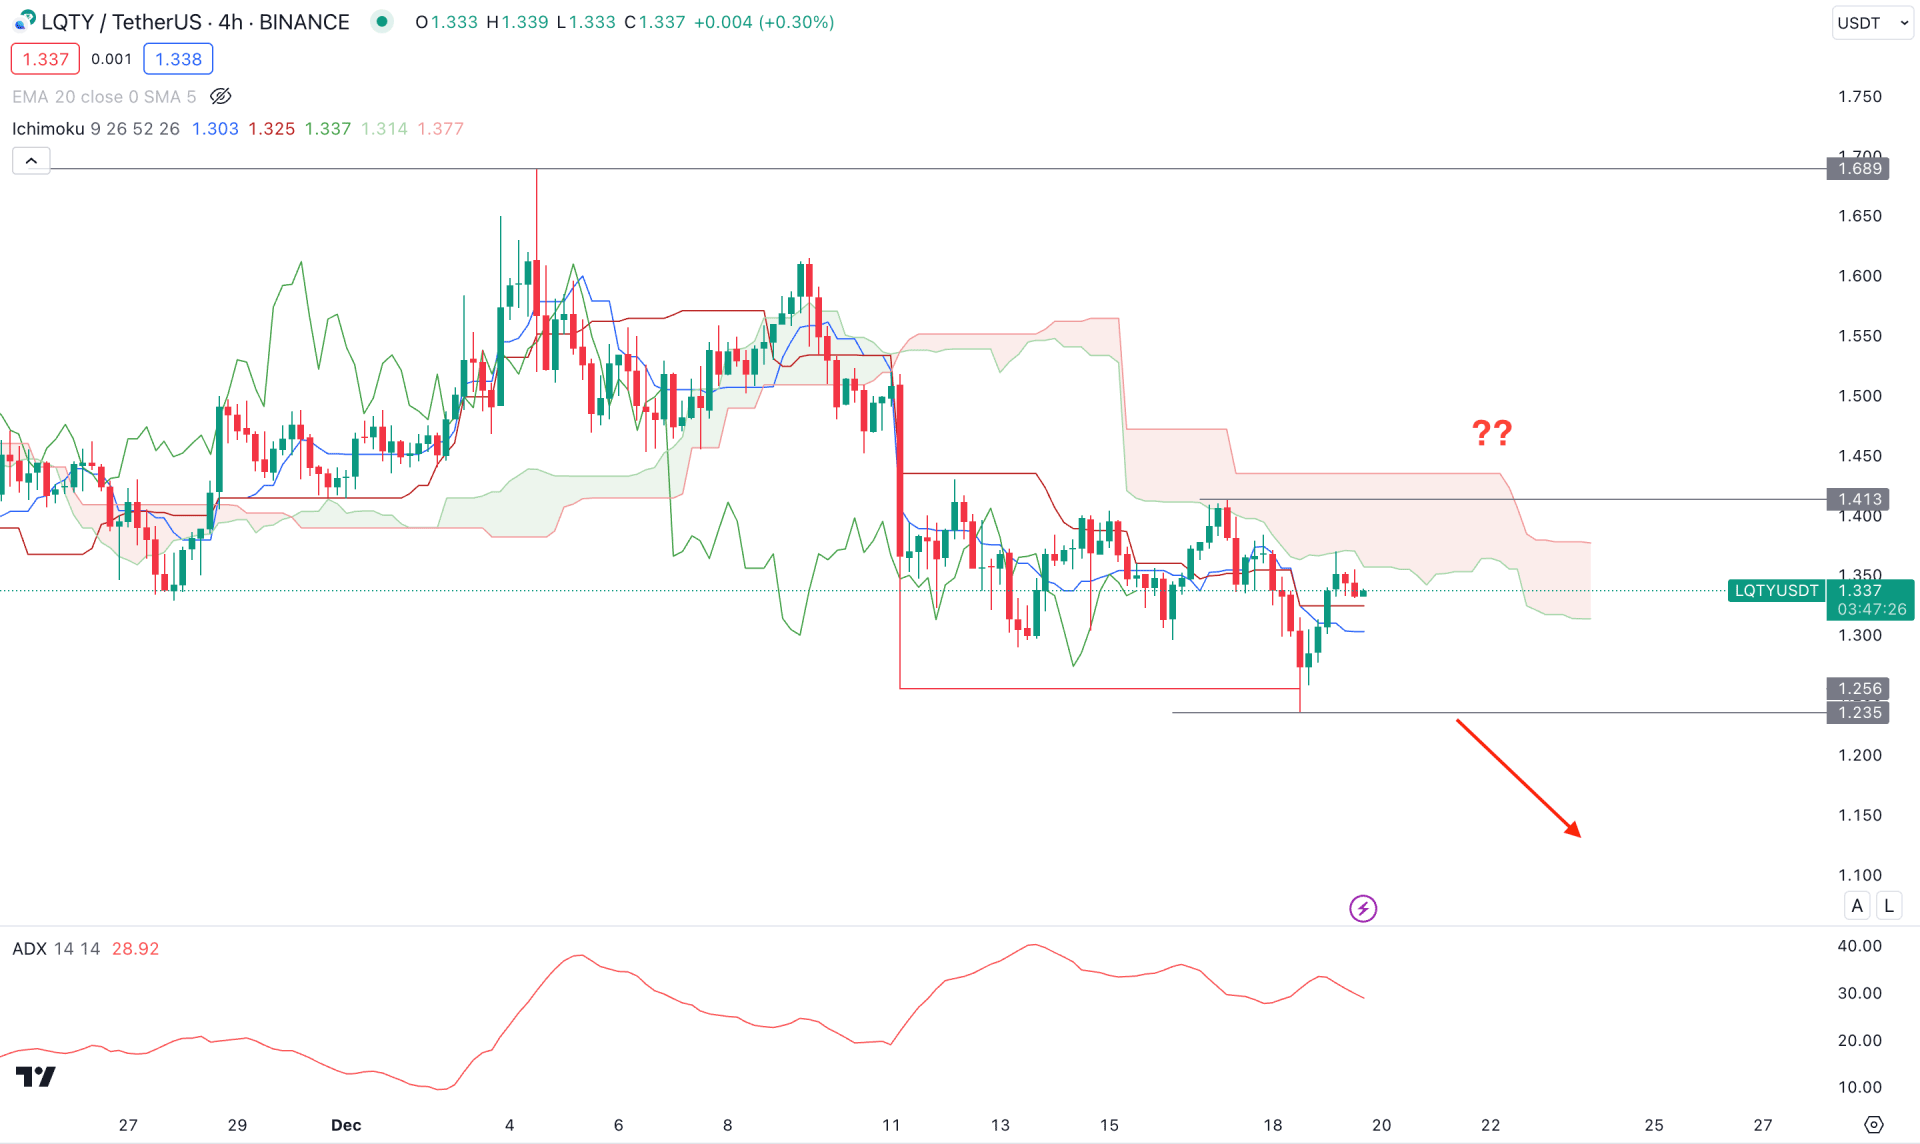
In the H4 chart, the current price trades below the dynamic Ichimoku Cloud zone, which is the primary sign of upcoming selling pressure.
On the other hand, the most recent buying pressure with an H4 close above the dynamic Kijun Sen came with a bearish liquidity sweep from the 1.256 low, which is the only signal for anticipating a long opportunity.
In the secondary window, the strength of the trend is still valid but the downward slope in the ADX line suggests a possible correction ahead.
Based on the H4 structure, the ongoing bearish trend might extend after having an H4 close below the 1.235 support level. In that case, the downside possibility would be valid until the price reaches the 1.100 psychological level.
The alternative approach is to wait for a bullish recovery above the 1.413 level, which could increase the price towards the 1.689 level.
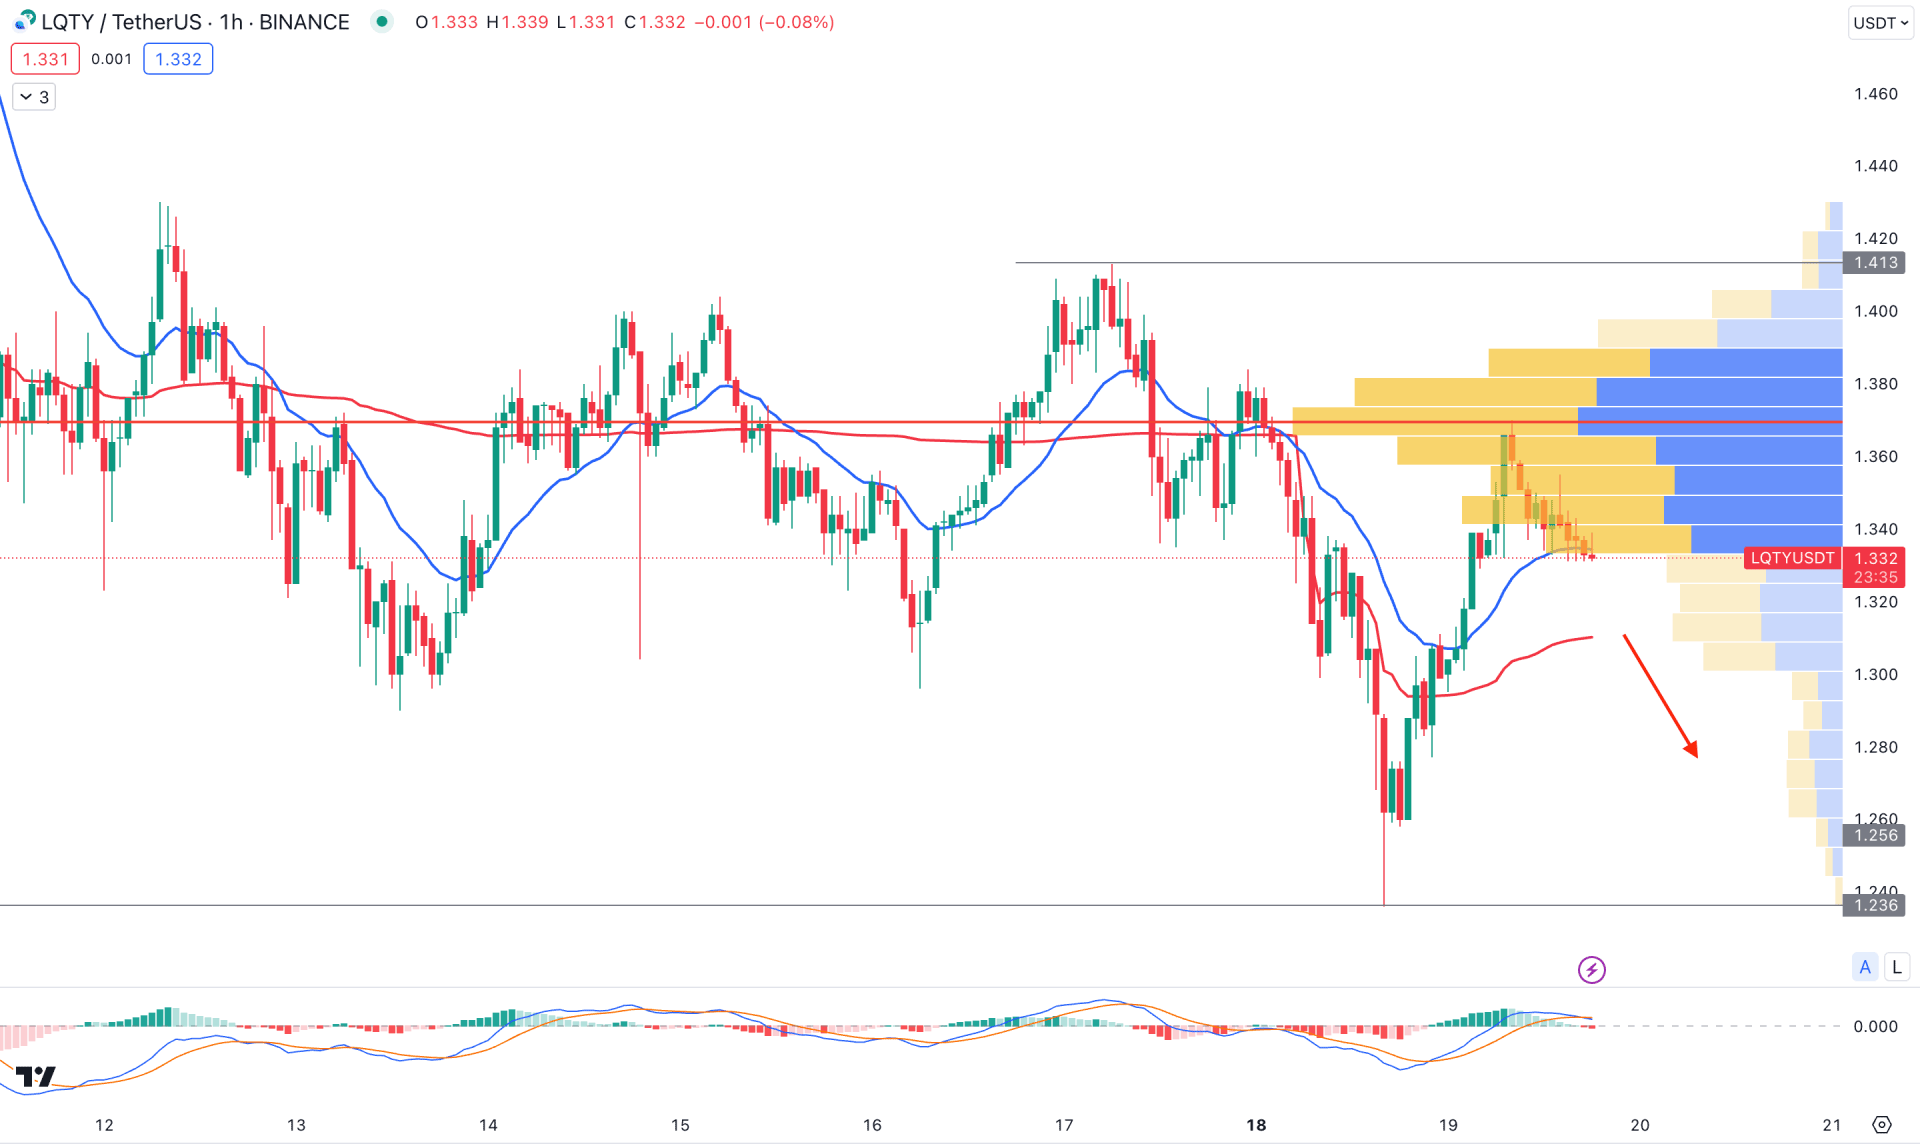
In the hourly chart, the current price trades below the visible range high volume level, which indicates a primary downside pressure in this pair. Moreover, a bearish crossover is seen with the MACD signal line, which supports the downside possibility.
On the other hand, the dynamic 20 EMA and weekly VWAP are working as an immediate barrier to sellers as these levels are below the current price with an upward slope.
Based on this outlook, an hourly close below the dynamic VWAP level could extend the loss towards the 1.236 low in the coming hours. However, a bullish recovery with a valid price action above the 1.380 level could eliminate the bearish possibility and increase the price in the coming days.
Based on the current outlook of LQTY/USDT, the overall market momentum is corrective, where a valid bullish trend line breakout could initiate the long opportunity. However, the intraday price is still bearish with an additional bearish pressure as pending.


