
Published: June 13th, 2023
Linear Finance (LINA) is a decentralized platform that enables the construction of "Liquids," or digital versions of traditional assets. These Liquids provide unrestricted access to commodities, foreign exchange, market indices, and other markets for cryptocurrency consumers.
Linear.Buildr, a decentralized application (DApp) used for managing Liquids, is one of the main products offered by Linear Finance. Users can use Linear's native token, LINA, and other tokens as collateral within Linear.Buildr app. In addition, the platform provides an efficient exchange for trading diverse Liquids, with swift transaction confirmations and robust security.
The Linear Finance platform is constructed on Ethereum. With over 1.15 billion tokens staked, LINA has an estimated annual percentage yield (APY) of 33.93 percent. However, the quantity of holders of LINA tokens has remained unchanged. In the past week, there has been a significant increase in the price of LINA.
Recently, a Twitter account reported that a whale, a 12% holder of LINA supply, has engaged in a pump-and-dump scheme. The current circulation supply of this token is 5,344,831,013.34 LINA, which is 54% of the total supply.
Let’s see the upcoming price direction from the LINA/USDT technical analysis:
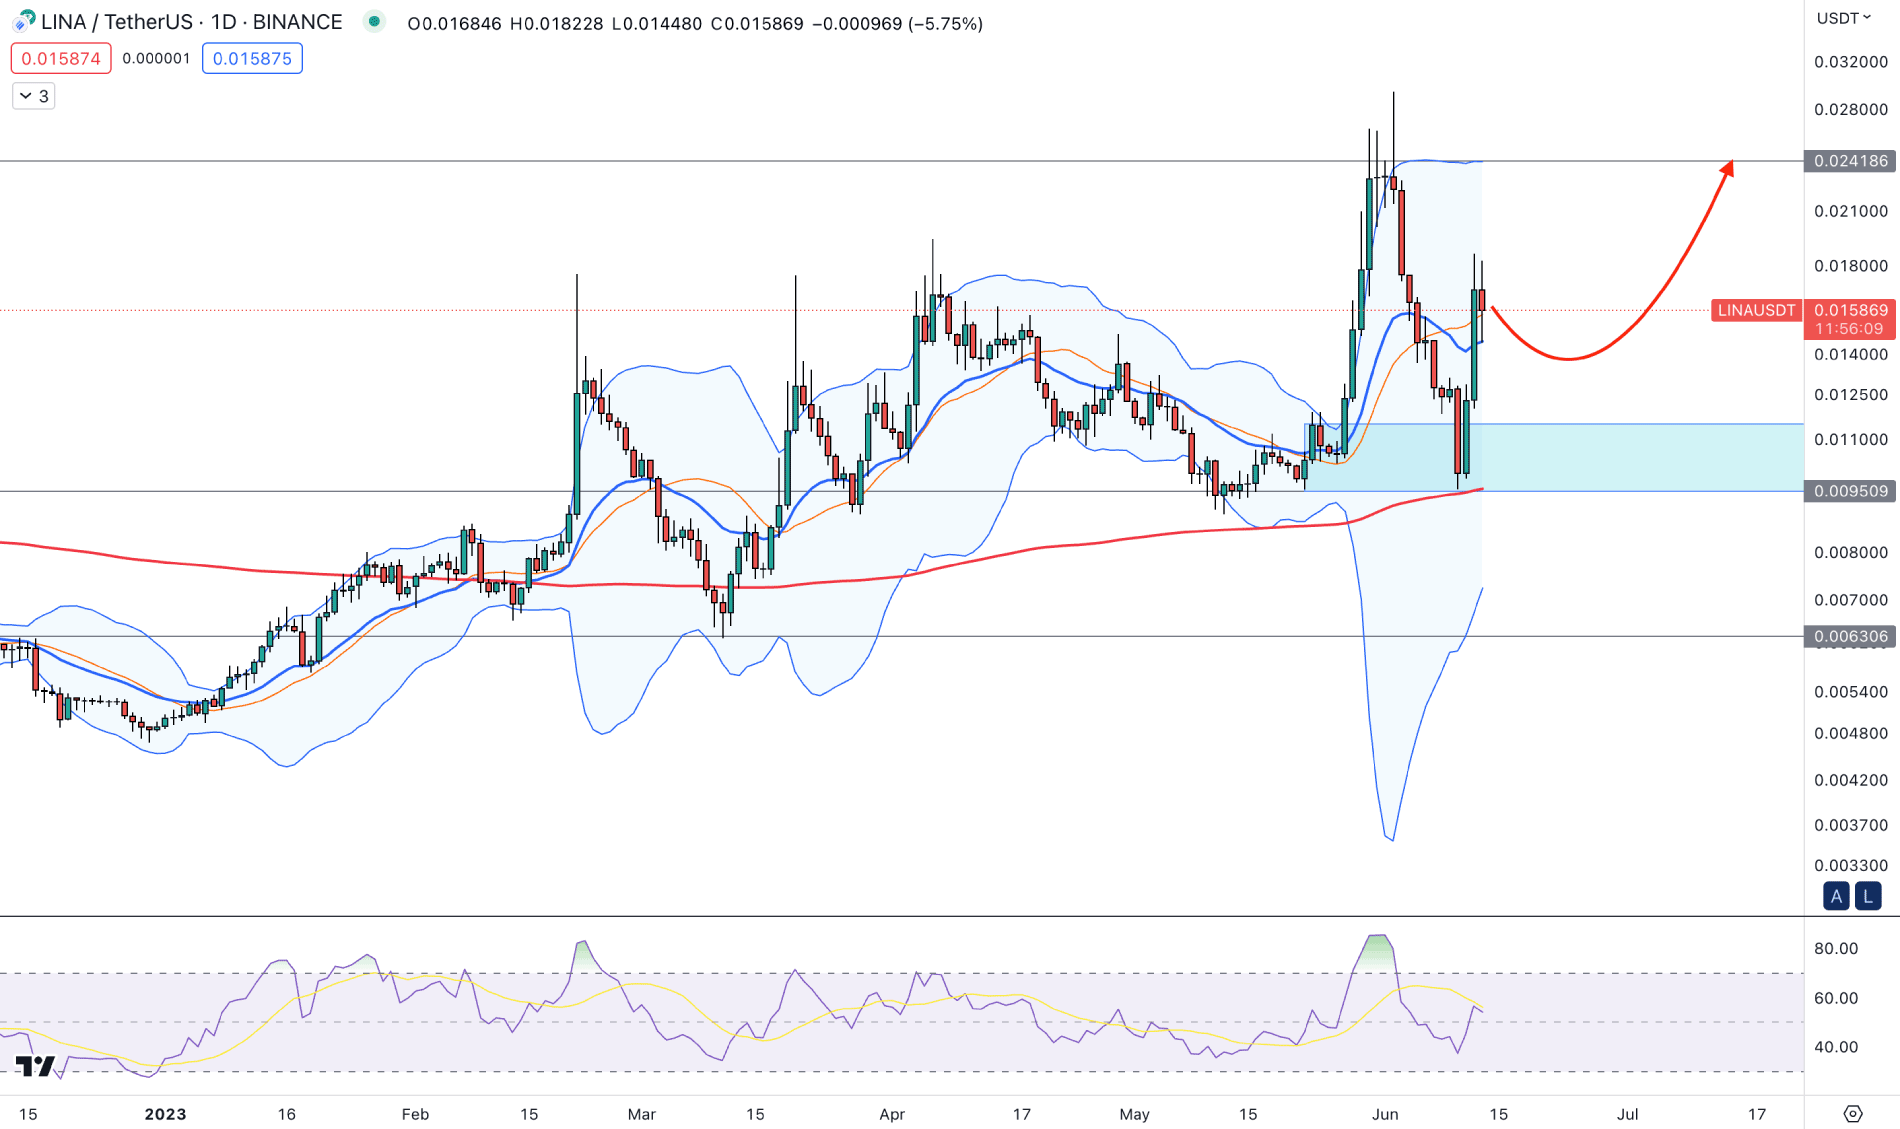
In the daily chart of LINA/USDT, the overall direction is bullish as there have been several higher high formations over the past few months. In that case, it would be profitable to rely on long trades only.
Strong volatility is present in the most recent chart, where the latest weekly candle showed an immediate bullish recovery. The clearer version of the recovery is seen in the daily chart, where a strong demand zone is present at the 0.01155 to 0.0095 area. As the recent price formed a bullish recovery from this area with a strong daily close, we may expect a trend continuation in the coming days.
In the main chart window, the 100-day Simple Moving Average is working as a confluence support at the demand zone, which will be the ultimate barrier for the bull run. Moreover, the 20-day Exponential Moving Average is closer to the price, working as an immediate dynamic support.
The latest daily candle closed above the middle Bollinger Bands line, which is a sign of a strong bullish reversal. The secondary window supports the bullish sentiment, as the current 14-period RSI is above the 50.00 line with an upward slope.
Based on the daily price of LINA/USDT, the broader market context is bullish. Any minor rebound in the intraday chart could offer a decent long opportunity. On the upside, the immediate resistance is at the 0.0241 level. A strong break above this level could extend the momentum toward the 0.0350 level.
On the downside, the break below the 0.0095 level could be negative for bulls as it can lower the price toward the 0.0063 area.
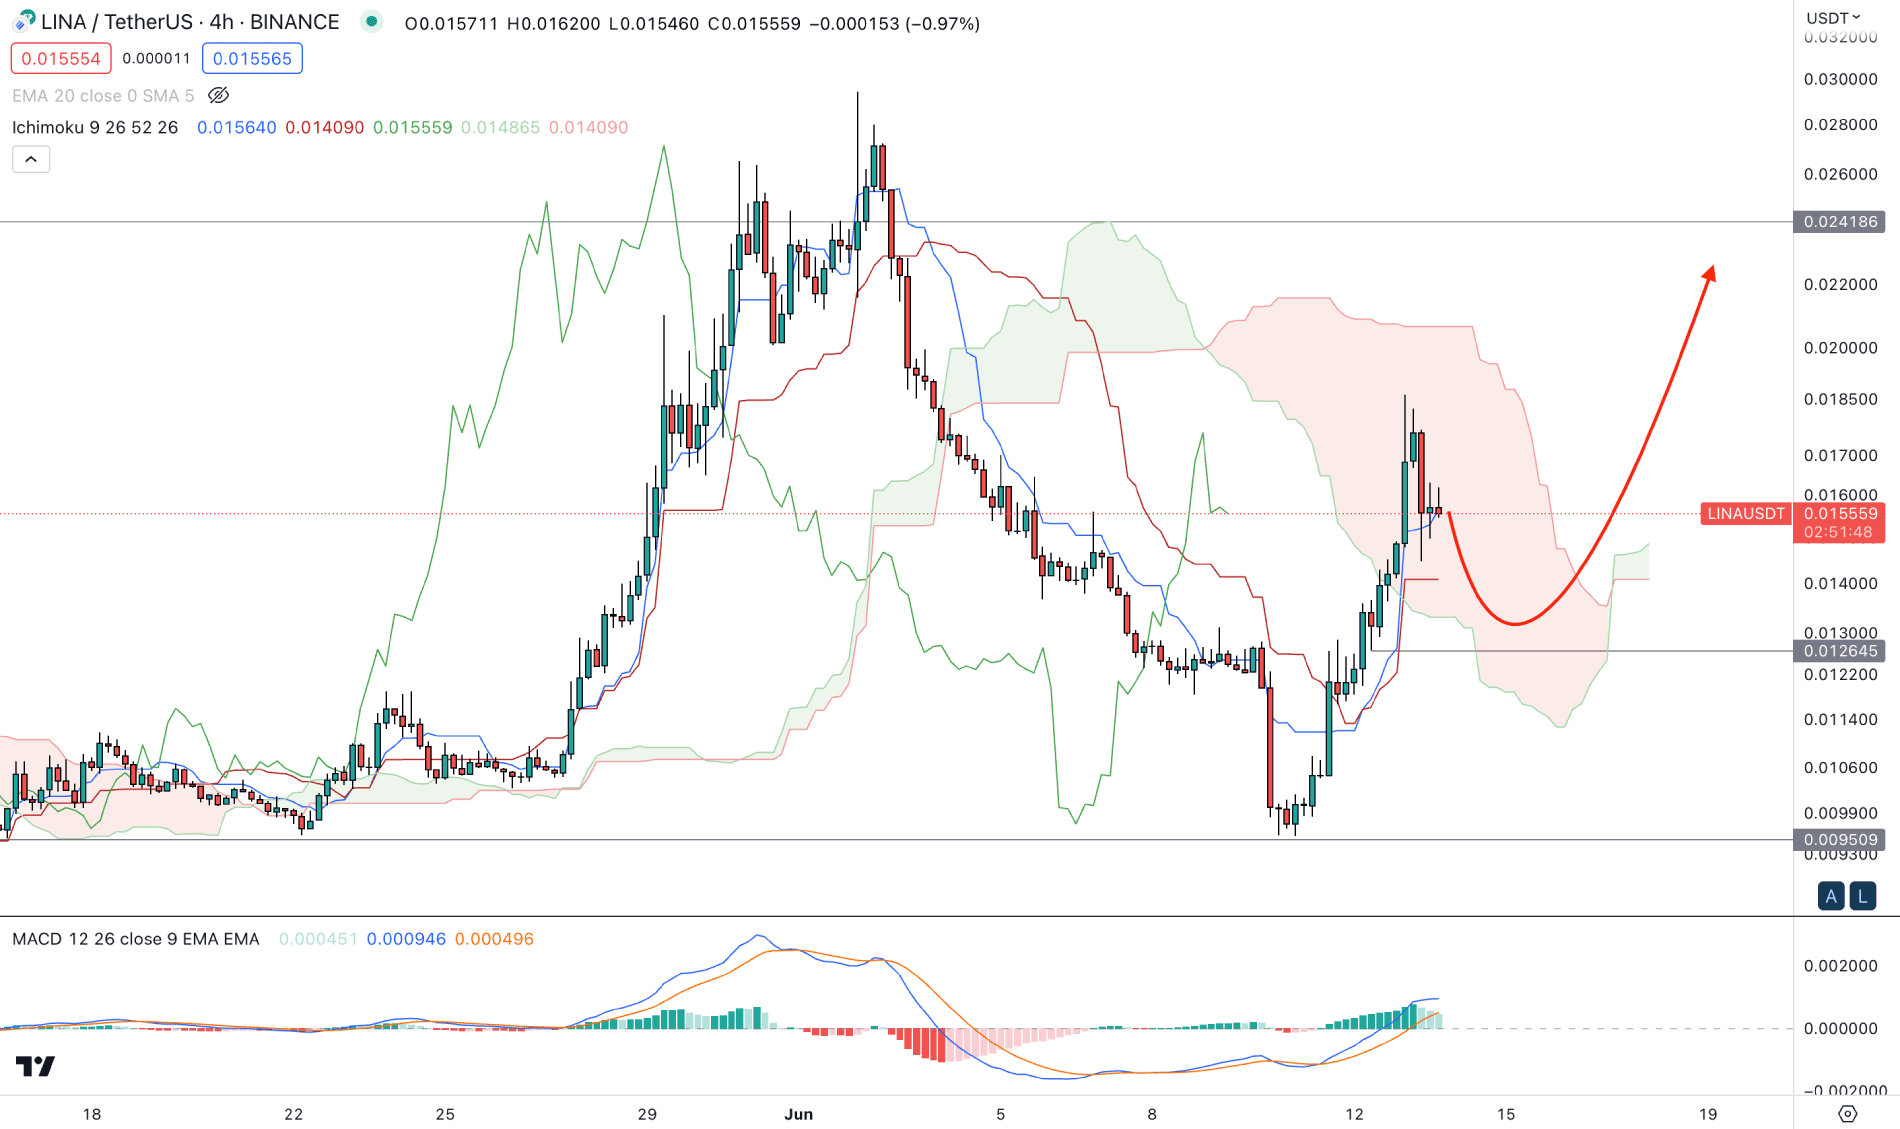
In the H4 chart, a strong bullish rebound is visible, which failed to overcome the Ichimoku Cloud zone. However, bulls managed to breach the dynamic Tenkan Sen and Kijun Sen levels, while the current future cloud level is bullish.
As dynamic levels work as support while the future cloud is on the buyers’ side, we may consider the market trend bullish. The Indicator window shows a corrective pattern, where the current MACD Histogram narrows to the neutral zone.
Based on the current outlook, a strong break above the Cloud resistance would be the conservative buying approach for this instrument. Although a minor bearish correction is pending from the current price level, a break below the 0.0126 level could eliminate the bullish outlook and open the room for testing the 0.0095 low.
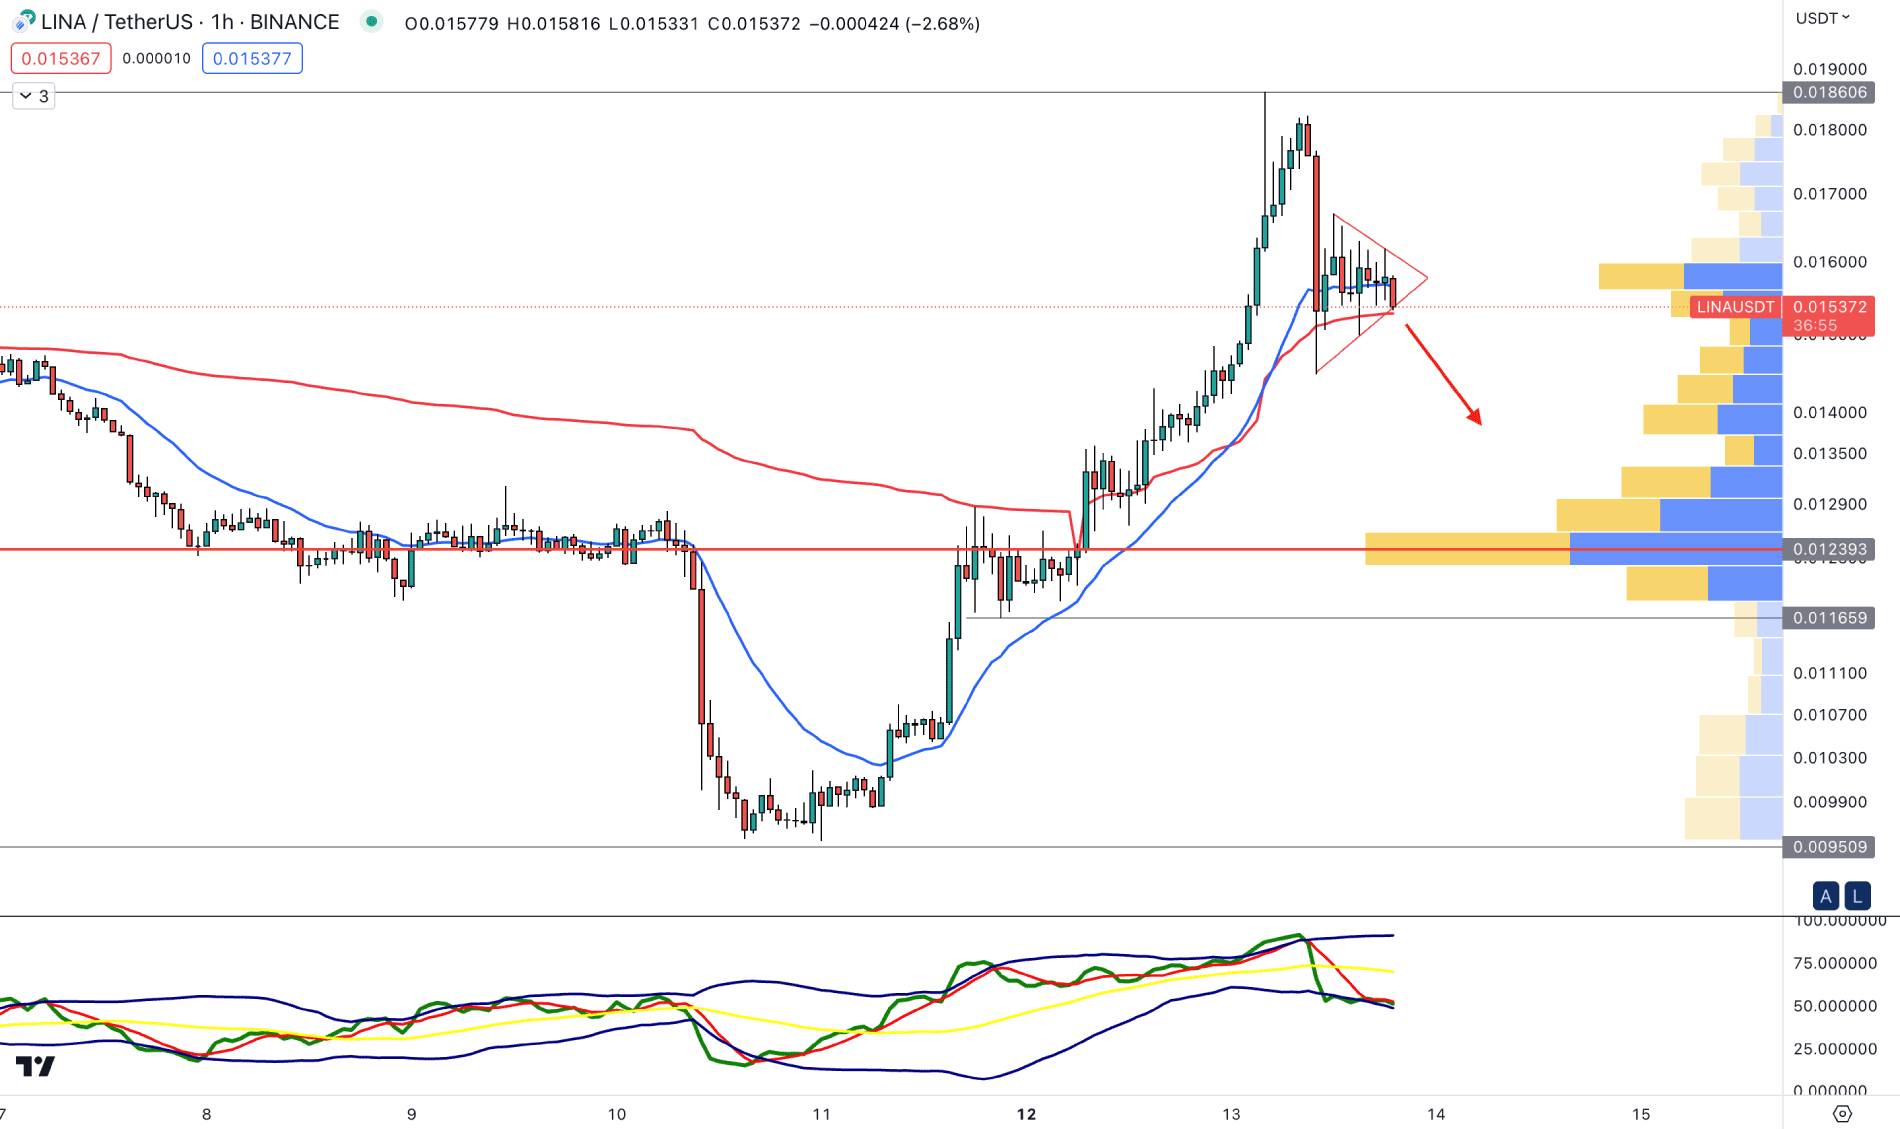
In the H1 chart, the current price trades sideways within a symmetrical triangle formation. However, the broader direction is towards the buyers’ side, as the visible range high volume level is a strong backup.
The price remained closer to dynamic 20 EMA and VWAP support levels, while the current TDI level reached the overbought position.
Based on the outlook, we may expect bears to extend their presence, but any rebound from the 0.0129 to 0.0100 area could be a high probable buying opportunity.
On the other hand, breaking below the 0.0100 level might limit the gain and extend the downside pressure towards the 0.0095 area.
LINA/USDT has a strong fundamental background in the broader context, supported by the near-term daily demand zone. In that case, any minor downside correction from the intraday price could be an attractive bullish opportunity in this pair.


