
Published: February 3rd, 2022
UNUS SED LEO was initiated by iFinex, a payment processor that saw some of its funds be seized by the government. iFinex is the mother company of Bitfinex, a world-class crypto trading exchange that warned that the fund might not be possible to recover. As a result of the financial shortfall, the company decided to launch a token known as LEO.
The mechanism behind the LEO token is that the company is committed to buying back UNUS SED LEO on a monthly basis from the market. As per the latest company news, the burn mechanism will extend until 100% of tokens are redeemed. Unlike other cryptocurrencies, LEO is issued in two different blockchains. 64% of the total supply was on the Ethereum network, while the remaining 36% was under the EOS.
The recent surge in the LEO/USD price surge grabbed mass investors' attention while that took this project within the top 50 coins in the coinmarketcap listing. Among the total supply of 985,239,504 LEO, almost 96% or 953,954,130.00 LEO are in circulation with a market cap of $3,977,576,043.
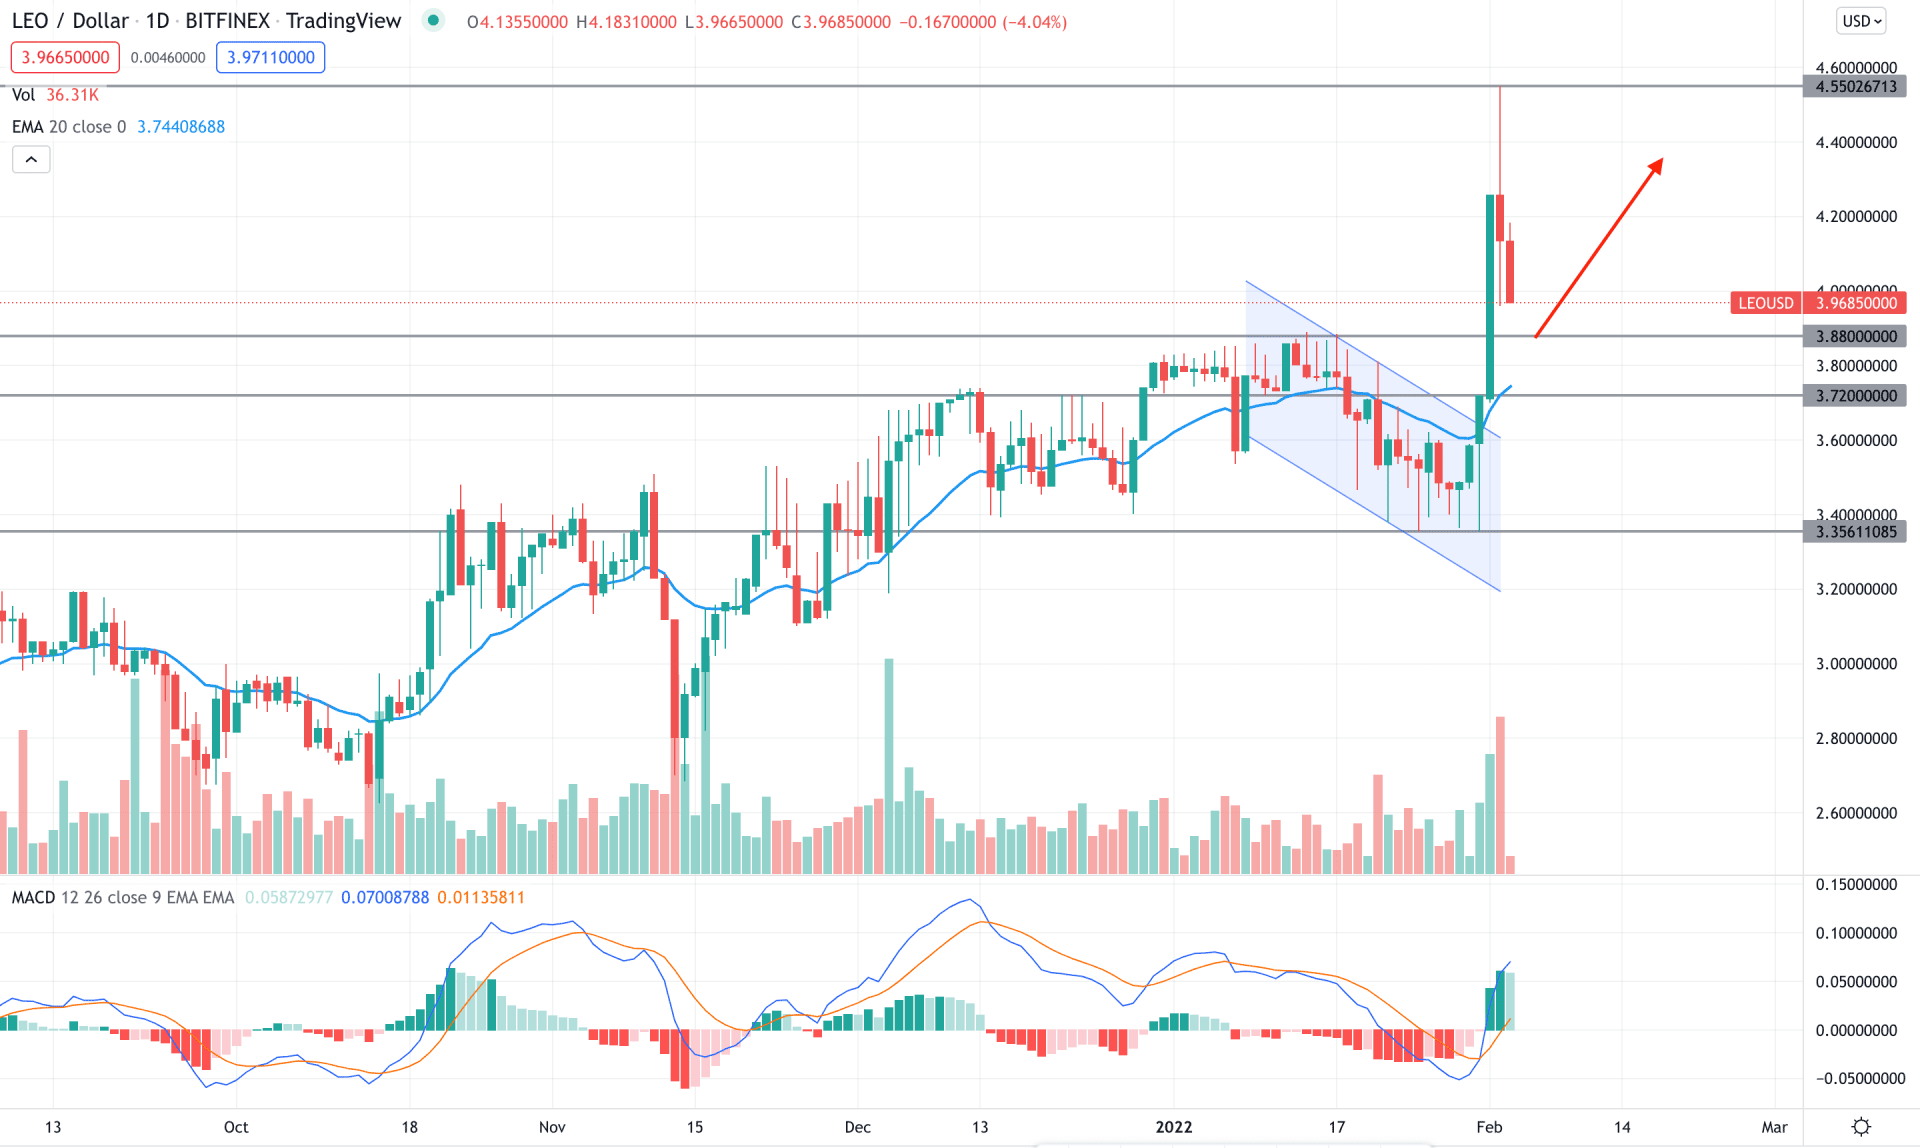
In the LEO/USD daily chart, the price showed an amazing bearish channel breakout with a bullish structure break from the 3.88 key resistance level. The daily candle that closes above the channel has provided a 22% gain on the next day by making a new swing high at 4.55 level. As the current price is coming lower from the top and bullish sing from near term support areas would be a potential buying point.
The above image shows how the MACD Histogram turned bullish while the breakout happens with the support from volume. As a result, the price shoot higher above the dynamic 20 EMA resistance with strong power.
Based on the daily price structure, the upcoming price direction for this instrument would be bullish as long as bulls hold the price above the dynamic 20 EMA. Any bullish rejection in the intraday chart from 3.88 to 3.60 would be a solid buying point where the ultimate target would be at the 4.55 level. On the other hand, a break below the 3.35 might alter the current market structure and lower the price towards the 3.00 area.
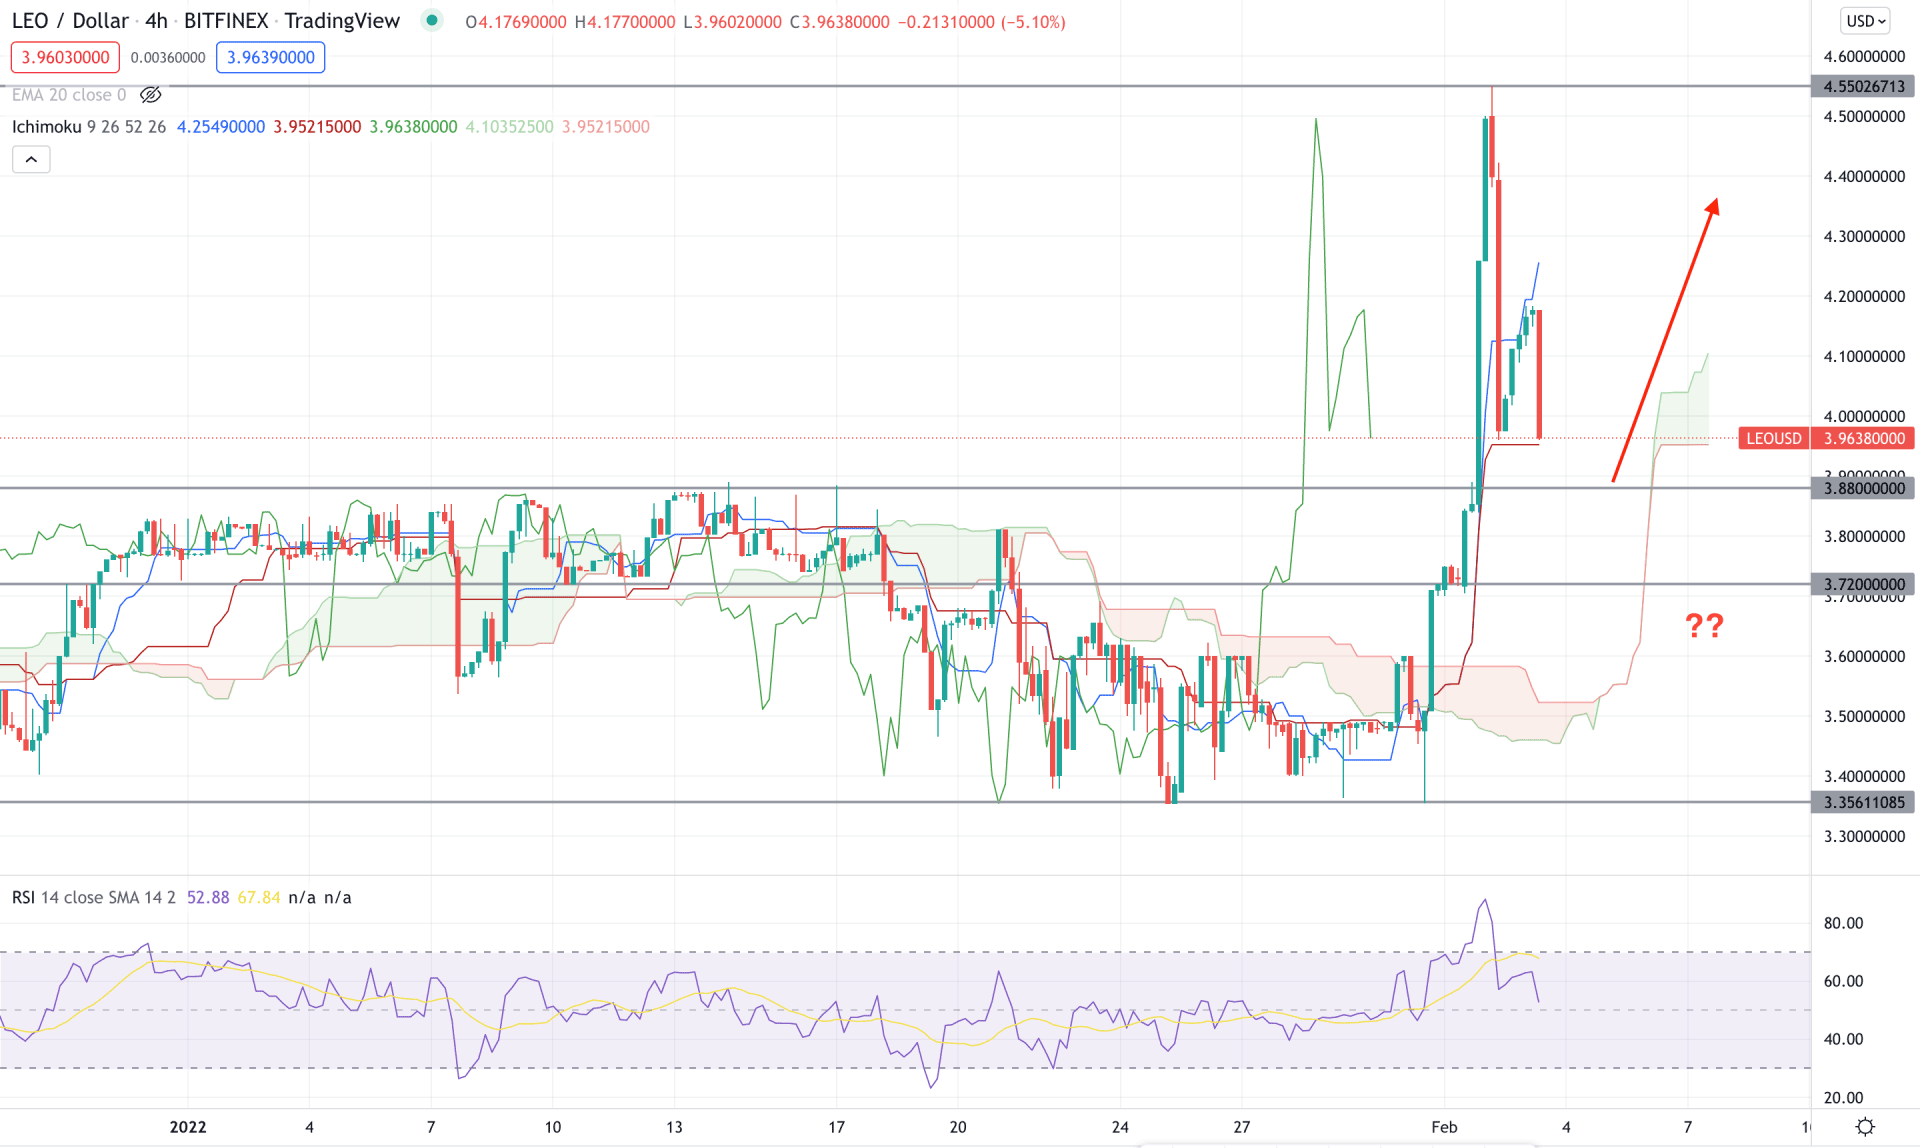
According to the Ichimoku Cloud, LEO/USD H4 chart showed a strong cloud breakout where the future cloud changed its direction from bearish to bullish. Moreover, the price direction changed by moving above the cloud resistance with an impulsive bullish pressure. Therefore, as long as bulls hold the price above the Cloud support, it may continue moving higher towards the 4.55 level.
The above image shows how the price moved above dynamic Tenkan Sen and Kijun Sen while the Lagging span is above the price. Moreover, in the indicator window, RSI tested the overbought 70 level and still remained above the neutral 50 area.
According to the current price context, a strong bullish rebound is needed to rely on the possible upside pressure in the price. In that case, any bullish rejection from dynamic Kijun Sen would be a solid buying point.
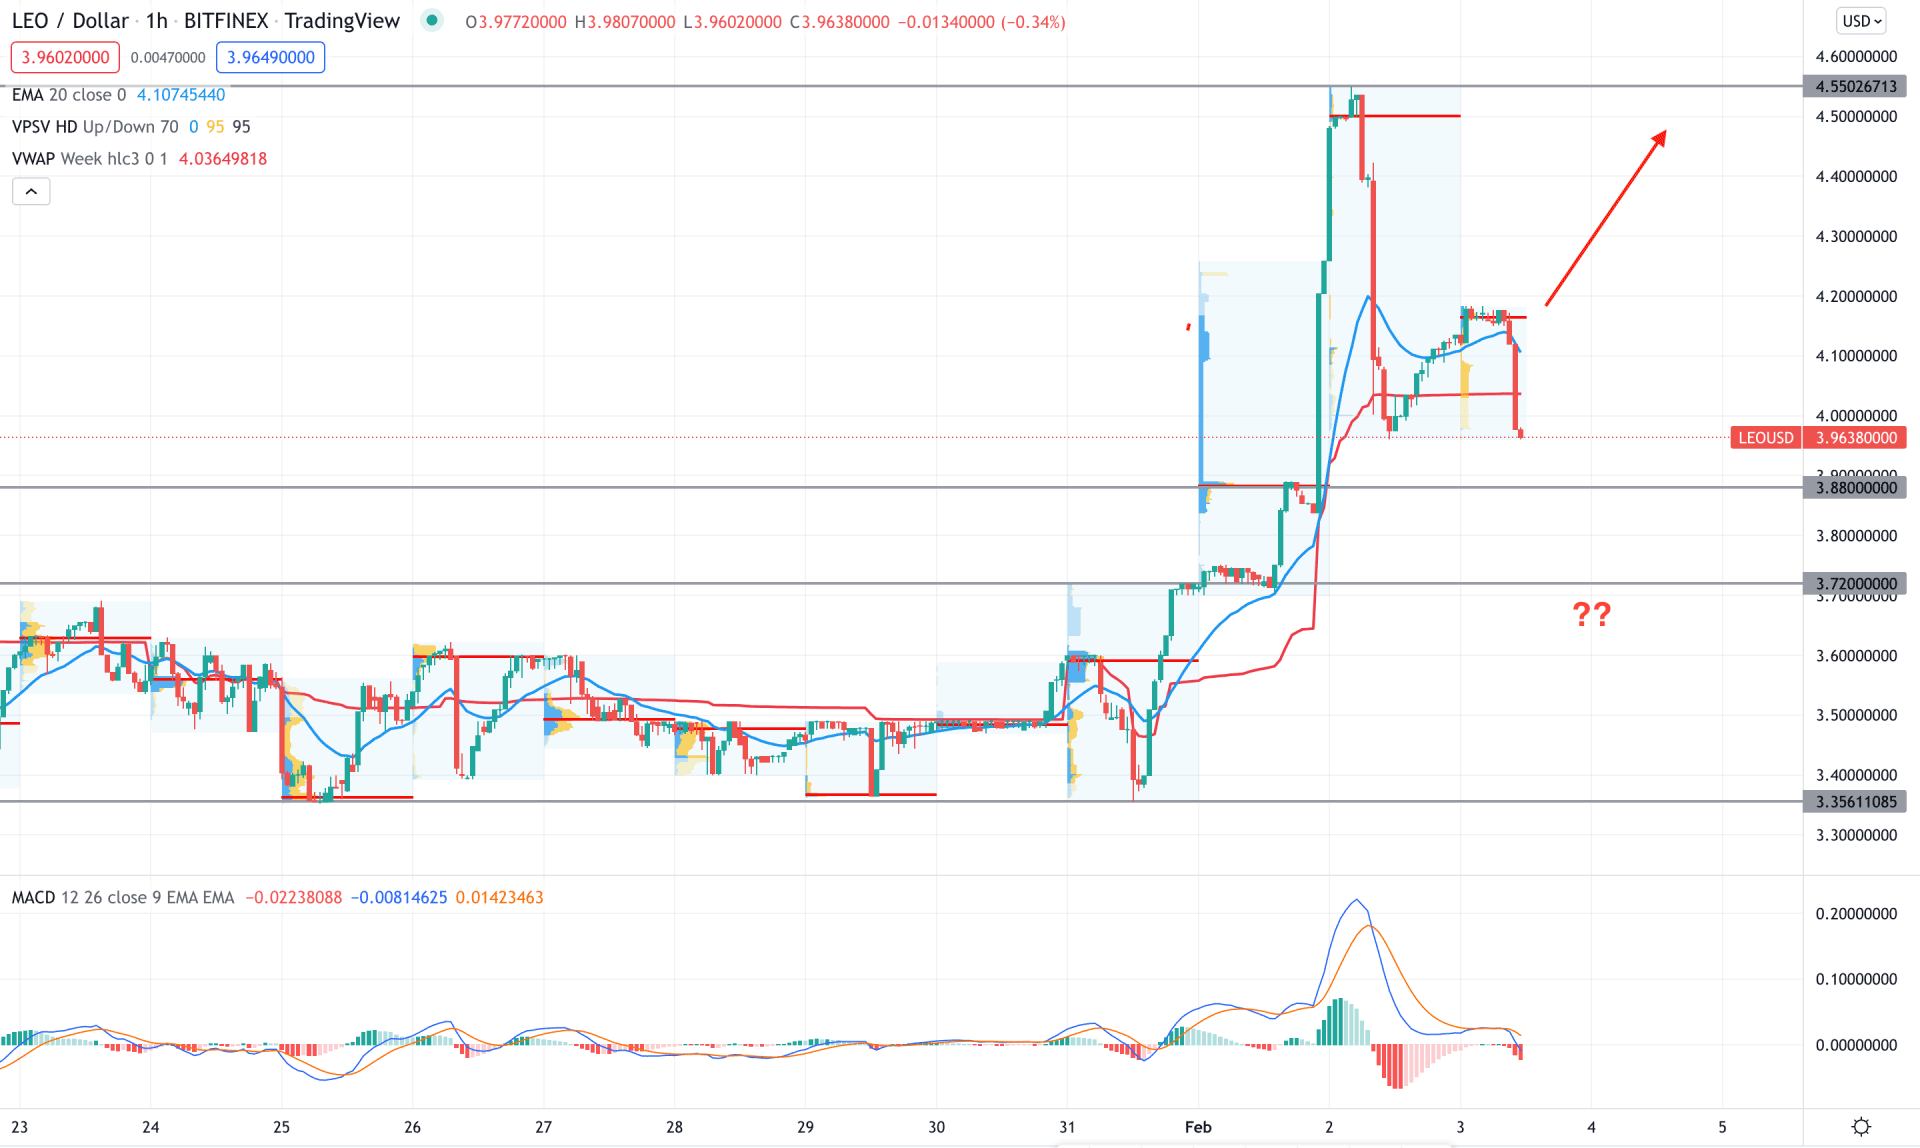
According to the intraday chart, LEO/USD is trading within a bullish swing where the most recent price is still showing a minor bearish correction. In that case, bulls may regain momentum at any time if the price shows bullish rejection from dynamic levels.
The above image shows how the price trades below dynamic VWAP and 20 EMA, where the most recent high volume level is at 4.16 level. On the other hand, the MACD Histogram changed its direction from bullish to bearish and made new lows. Therefore, the current price is still under bearish pressure that needs to eliminate by bulls.
Based on the current market context, investors should find the price above dynamic 20 EMA before going long towards the target of 4.55 level. On the other hand, any strong bearish pressure with an H1 closes below the 3.72 needs close attention before taking and buying trade.
As per the current market context, the overall price is within a bullish trend and it needs to complete the correction before showing a buy sign. Investors should closely monitor how the price trades at the H4 chart, where a bullish rejection from the dynamic Kijun Sen would provide the best buying entry.


