
Published: September 26th, 2023
Lear Corporation stock (LEA) showed a relatively lacklustre stock performance in the last three years. However, one key metric under scrutiny is the Return on Equity (ROE), which measures a company's ability to generate returns from shareholders' investments. The ROE of Lear appears acceptable and is comparable to the industry average of 12%.
Concerning is the 33% decline in Lear's net income over the past five years, which poses questions as to why the decent ROE has not translated into growth. A substantial portion of earnings could have been distributed as dividends, or competitive pressures could be to blame.
Moreover, Lear's earnings have been declining compared to industry counterparts, whereas the industry has experienced an 11% increase over the same period.
Despite the absence of substantial earnings growth, Lear's commitment to paying dividends for at least a decade demonstrates management's dedication to shareholders. Analyst estimates indicate that Lear's future payout ratio will decline to 15% over the next three years, possibly increasing the company's future ROE to 20% over the same time frame.
While Lear's financial performance is not alarming, it does raise concerns about the company's ability to compete and accomplish growth relative to its industry peers.
Let’s see additional clues about Lear’s stock from the LEA technical analysis:
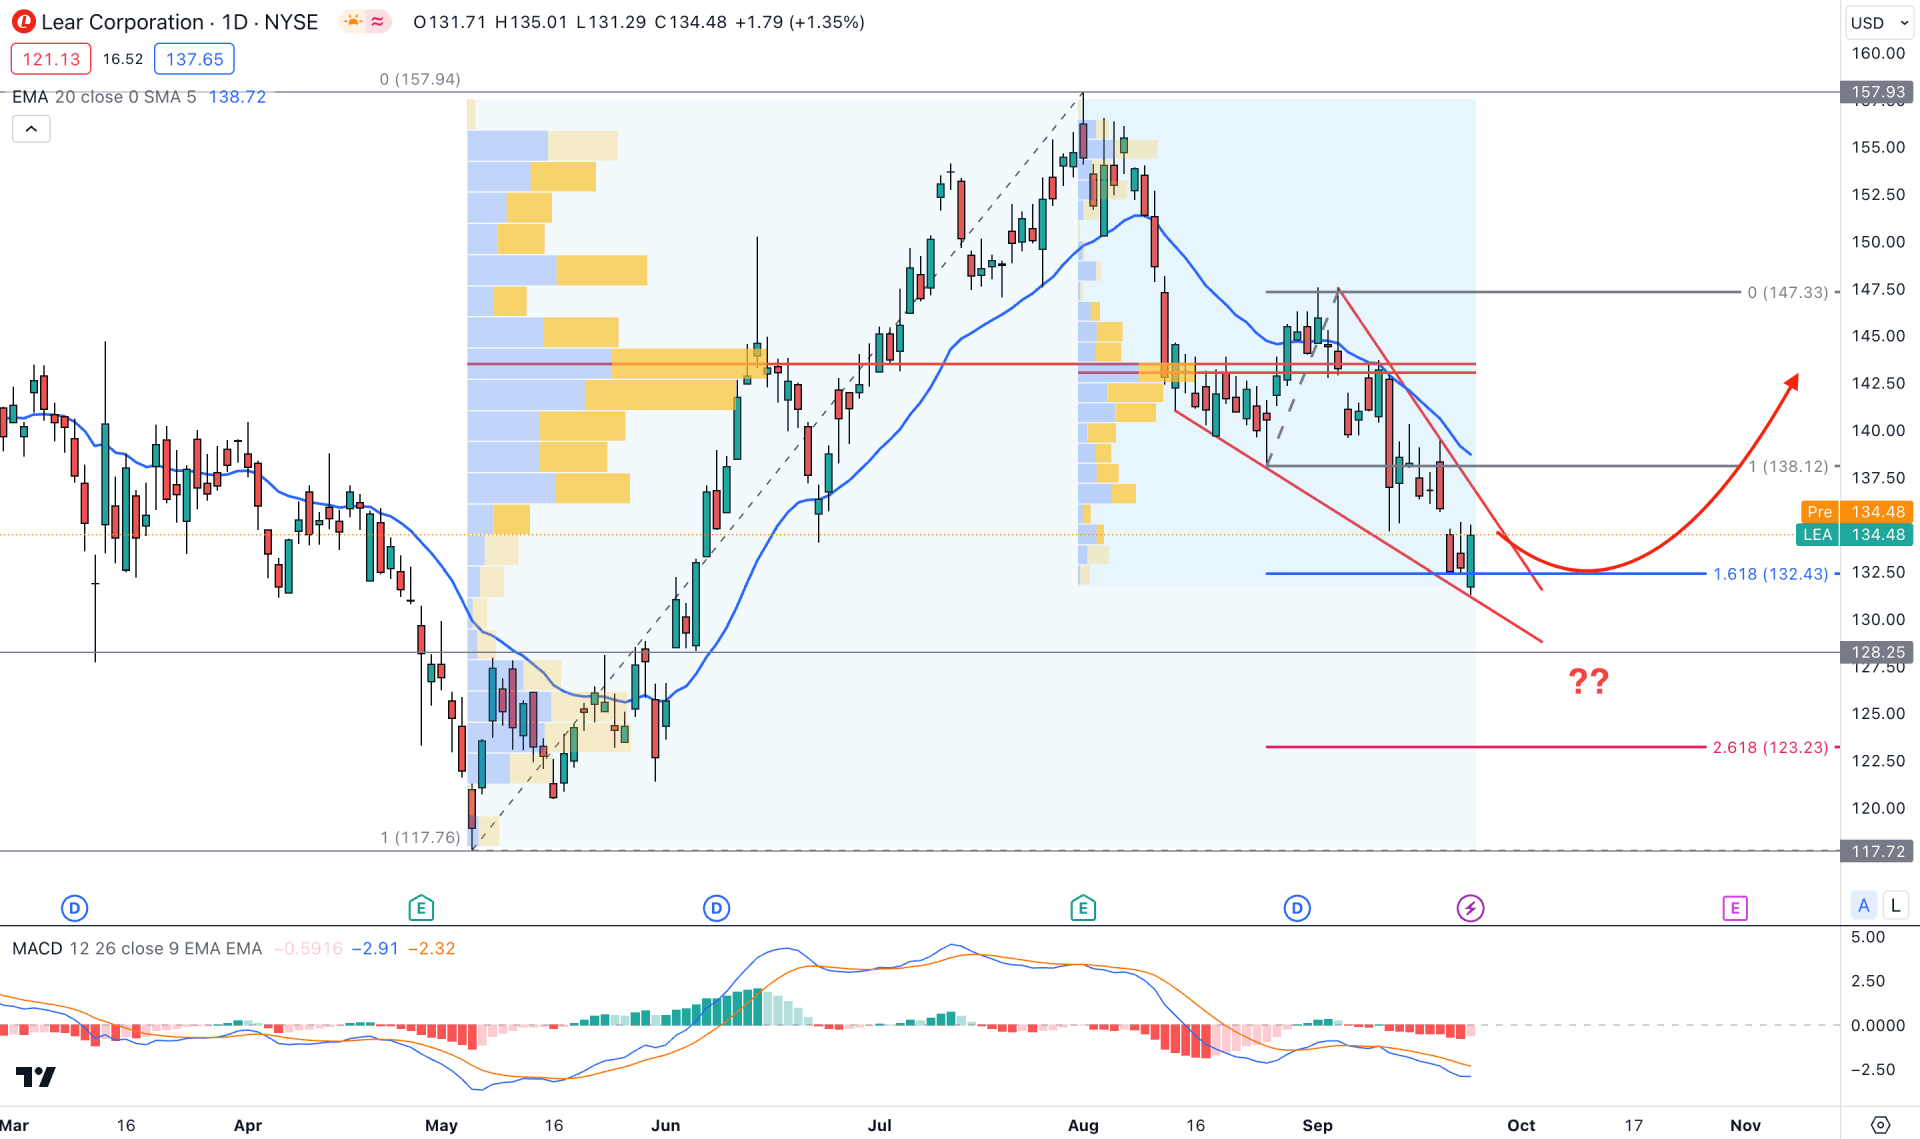
In the daily chart of LEA, the overall market momentum is corrective, but the most recent swing is trading at a critical demand zone from where a bullish reversal is possible.
In the macro outlook, a deep consolidation is available on the monthly chart, where the weekly timeframe shows a corrective downside pressure.
In the daily timeframe, the current price is trading within a falling wedge pattern, which might work as a major bullish reversal opportunity. Moreover, the location of the price pattern is solid as it is at the discounted zone from 117.76 low to 157.94 high. In this context, a bullish recovery with a valid breakout from the pattern is needed before opening a long position.
If we look at the volume structure, we would see the 143.32 level as a significant area. As the current price is trading in the dry area, below the significant level, we may expect any bullish opportunity to work well in this instrument.
In the secondary window, an upward slope in the MACD Histogram is present, which is yet to reach the neutral level. Moreover, the 20-day Exponential Moving Average is above the Wedge resistance, which needs to be overcome before forming a conservative bullish opportunity.
Based on the daily market outlook, the overall market direction is corrective. However, a minor bullish range extension could see the 157.93 level, which is 17% higher than the current price.
As the current price is trading at the 161.8% Fibonacci Extension level from the 138.12- 147.33 swing, a bullish reversal from the 133.00-128.00 area could indicate the first sign of a bullish pressure. However, breaking below the 117.70 level could be an alarming signal to bulls, which could lower the price towards the 100.00 psychological level.
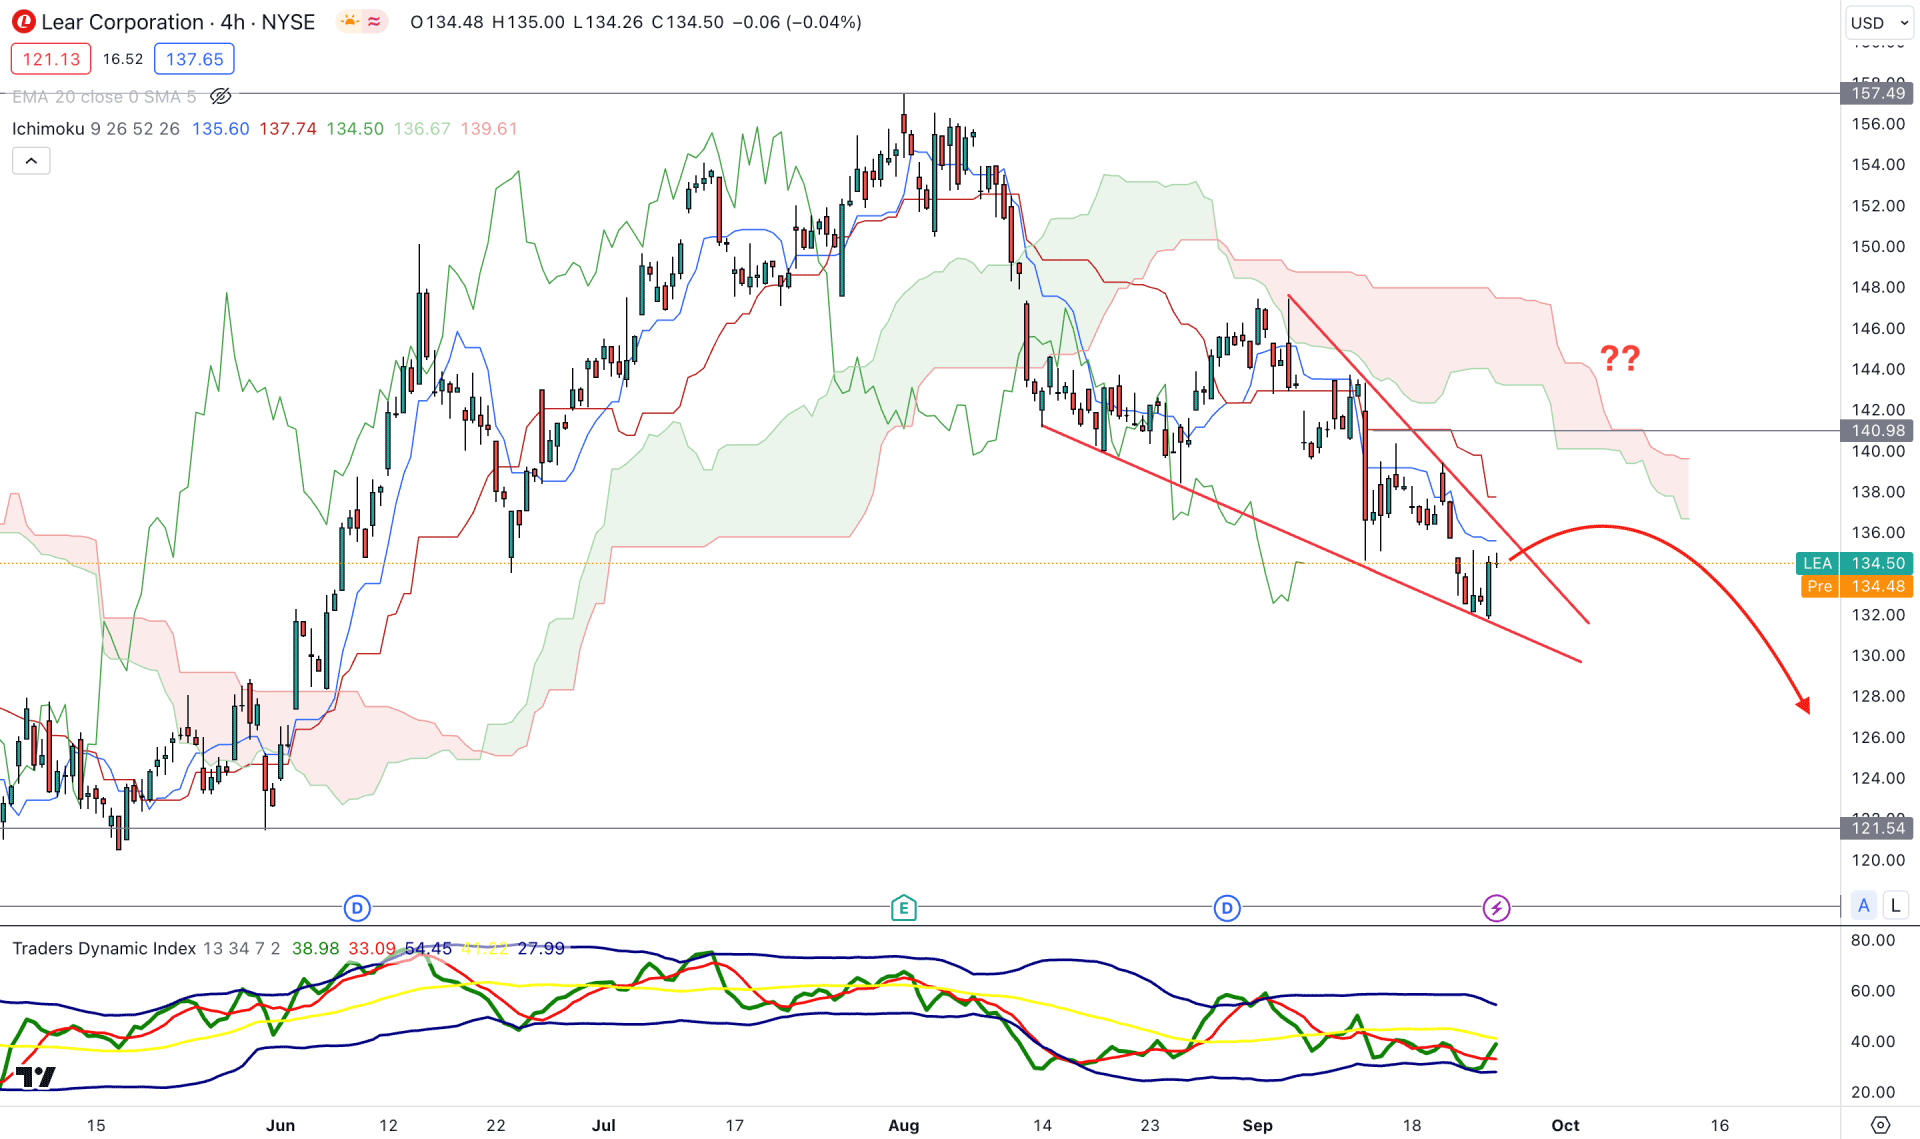
In the H4 timeframe, the overall market pressure is bearish, but a better view of the Falling Wedge pattern could limit the downside pressure. In other ways, the future cloud is supportive of bears, while the crucial Kijun Sen level is above the current price.
In the secondary window, the Traders Dynamic Index (TDI) has reached the oversold zone, which is a sign of a minor bullish recovery.
Based on the structure, an upward pressure with a bearish rejection from the dynamic Kijun Sen level could offer a strong bearish opportunity in this pair, targeting the 121.54 level.
The alternative approach is to wait for the price to move above the 140.98 critical resistance level, which could increase the price towards the 157.49 resistance level.
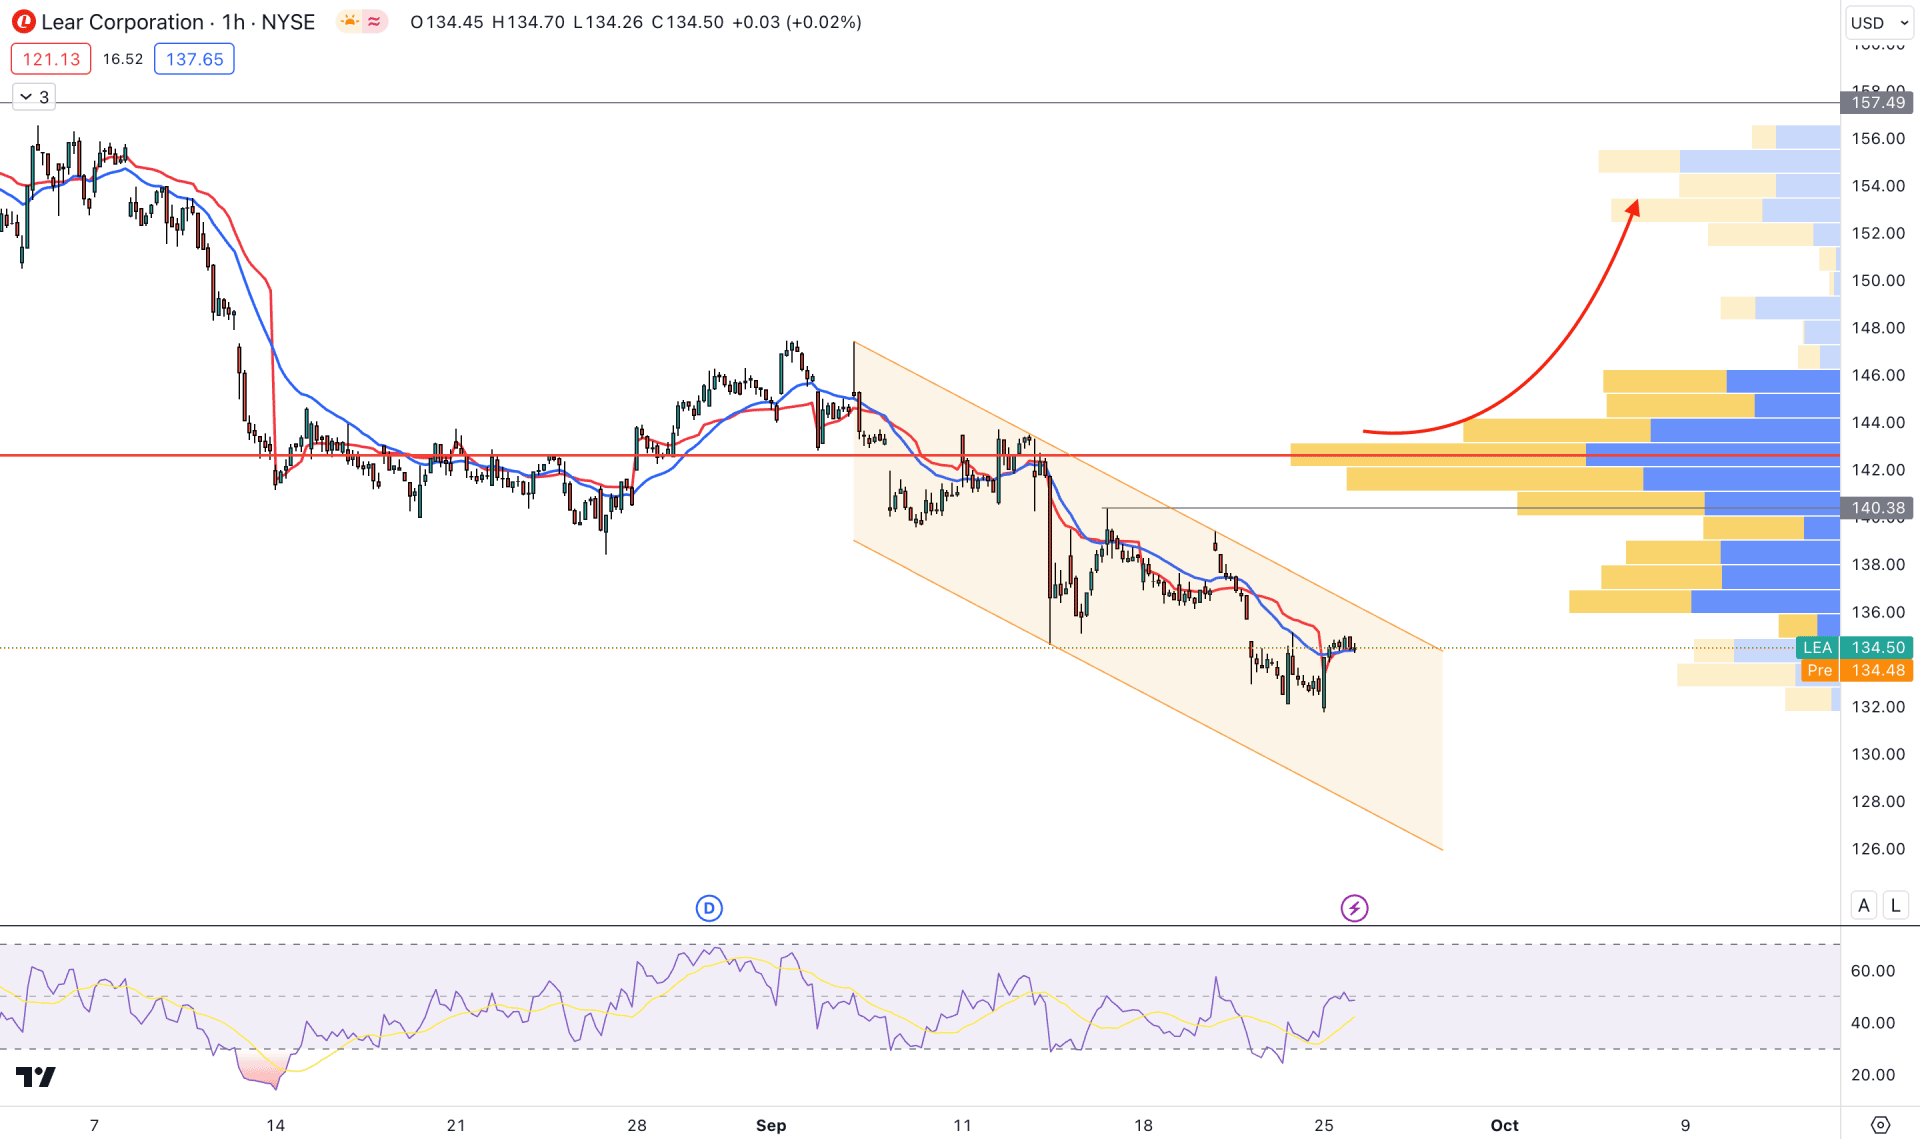
In the H1 chart, the overall market pressure is bearish as the current Visible range High volume level is above the current price. Moreover, a descending channel is visible, where the price is yet to reach the bottom.
In the indicator window, the relative Strength Index (RSI) rebounded from the 30.00 level and reached the 50.00 neutral area, which signals an upcoming bullish recovery.
Based on this structure, a valid upward pressure and a stable price above the 143.37 high volume level could be a long signal, targeting the 157.00 level. On the other hand, a bullish channel breakout and an immediate bearish pressure from the 140.38 level could be a bearish opportunity towards the 126.00 level.
Based on the current market outlook, LEA's bullish opportunity needs a solid rebound from the daily Wedge breakout, which could extend the price towards the monthly consolidation’s high. On the other hand, the intraday price is still bearish, and could move even lower before forming a bottom.