
Published: April 8th, 2026
LayerZero (ZRO), a Vancouver-based company founded in 2021, initially concentrated on developing technology to link the vast array of blockchains. A $120 million fundraising round from Andreessen Horowitz (a16z) and Sequoia in 2023 priced the startup at $3 billion, making it a favourite of the last bull market.
Additionally, the former declared in April of last year that it had purchased another $55 million value of LayerZero's proprietary coin, ZRO, which is today valued at over $500 million.
In an effort to improve enterprise cross-chain payment security, Worldpay and Global Payments have introduced the Payments DVN on LayerZero. As global finance shifts to blockchain rails, there is an increasing need for enterprise-grade, accountable infrastructure, which this launch fills.
Based on the LayerZero protocol, the Payments DVN is a decentralised validator network. It enables cross-chain message verification for apps before execution. In this network arrangement, Worldpay and Global Payments function as independent verifiers.
The DVN was designed specifically for cross-blockchain payment operations. Teams can now choose to use Worldpay-secured verification while working with tokenised assets, stablecoins, and other on-chain transaction flows.
Given the innovation and collaboration, ZRO has attracted significant investor attention in recent days.
Let's see the complete price outlook from the ZRO/USDT market analysis:
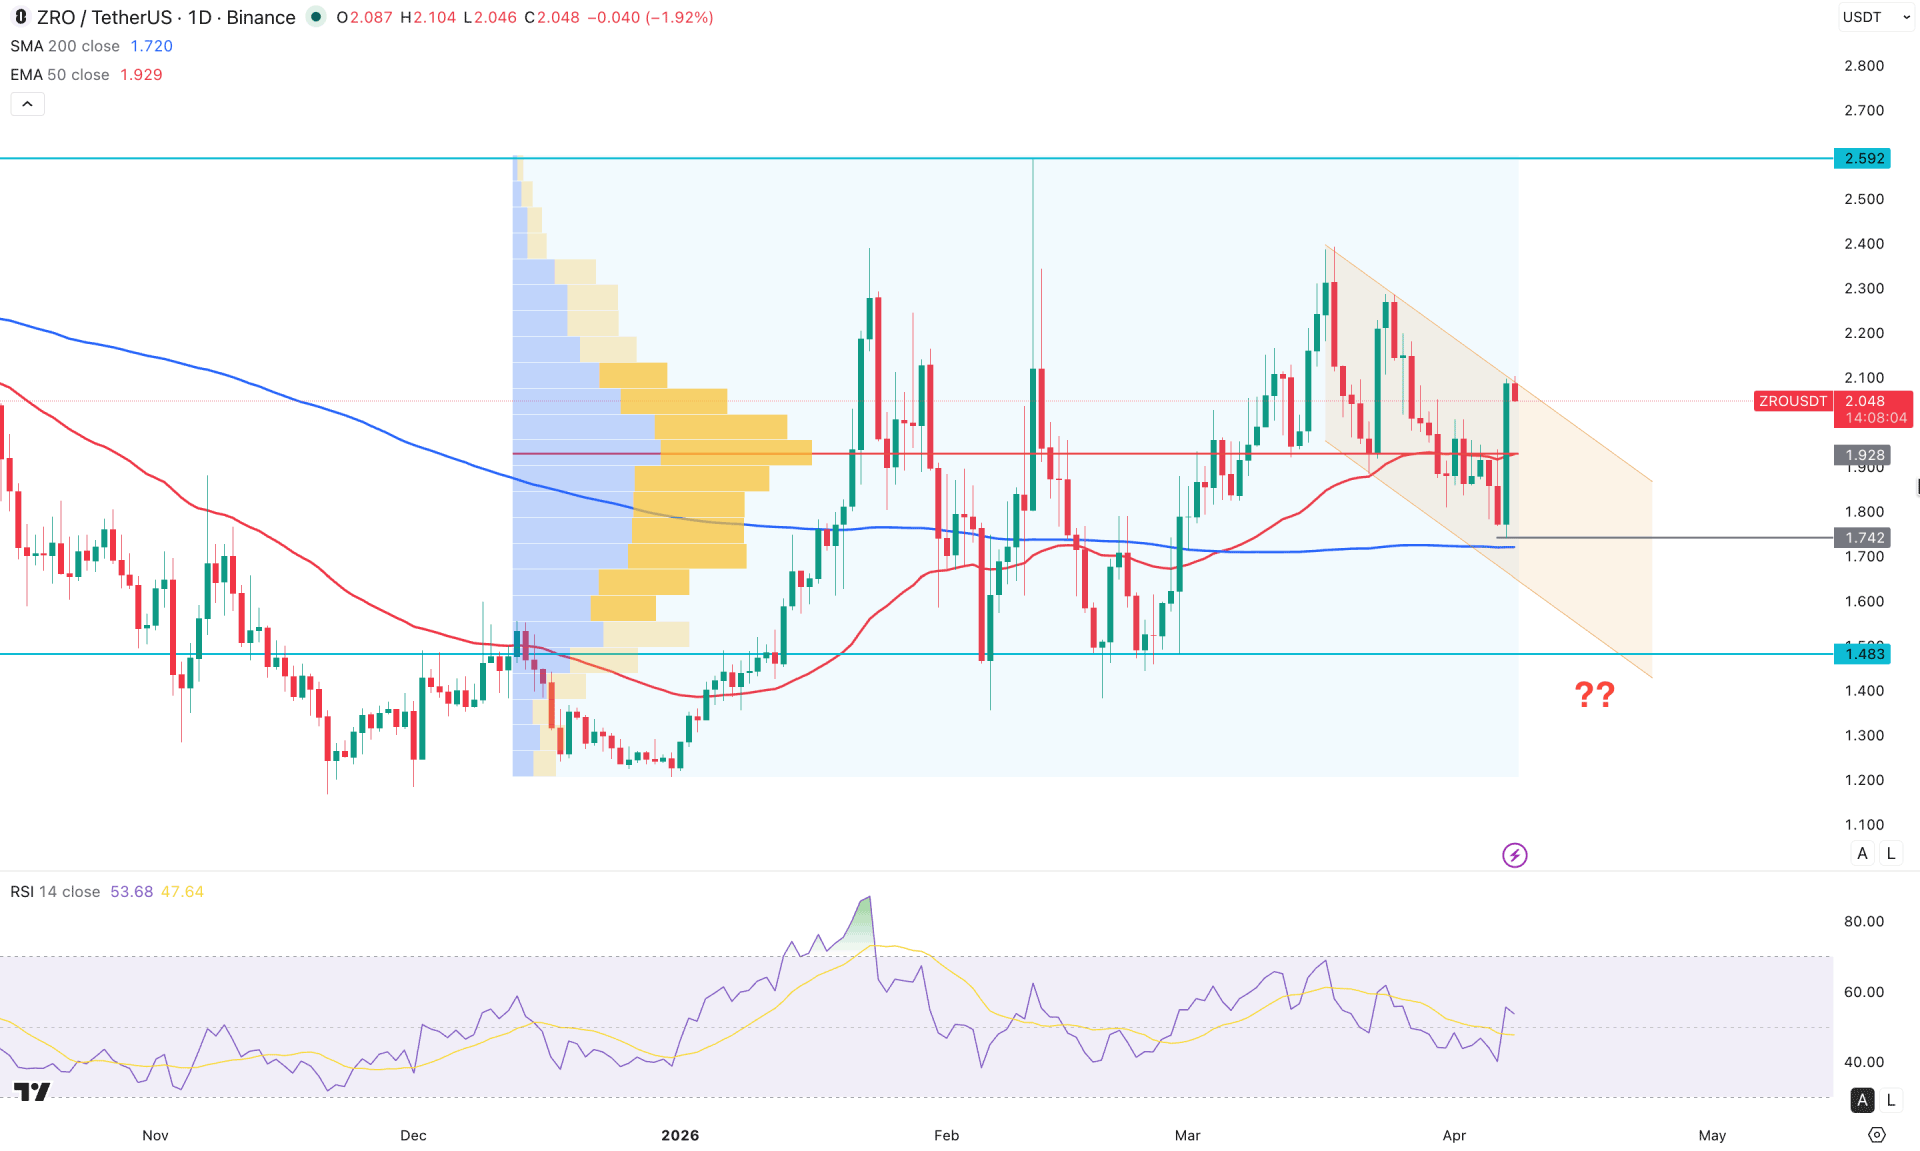
In the daily chart of ZRO/USDT, the recent price action shows a solid bullish recovery after having a massive liquidity crash in 2025. The price created momentum days before a new swing high at the 2.592 level, then moved sideways. As the most recent price is showing a bullish reaction from the dynamic support, a strong bullish continuation is possible.
Looking at the higher timeframe, three consecutive bullish months are visible, even though the price remains extremely volatile. However, extended consolidation is seen in the weekly timeframe, with the most recent price trading within a strong range, indicating a bullish breakout is needed.
In terms of volume, buying pressure remains valid even if the price remains within a consolidation phase. The latest daily candle has closed above the high-value support level. We need more confirmation to see how the price reacts at the trendline resistance.
In the main price chart, a strong daily close is seen above the 50-day EMA, while the 200-day SMA is the major support below the 1.742 static level. As long as these dynamic lines are below the current price, the primary aim for this pair would be to look for long trades only.
On the other hand, sideways market momentum is evident, with the most recent price facing strong rejection from the descending channel. The Relative Strength Index remains on the buying side, as the most recent value is around the 60.00 level. However, the strength of the trend needs attention, as the Average Directional Index is hovering below the 20.00 threshold level.
Based on the overall daily market structure, a conservative bullish scenario requires a stable price above the 2.592 level to validate the long-term breakout. As the most recent price is facing selling pressure from the channel, a brief correction to the 50-day EMA could increase buying possibilities. In that case, any bullish signal from the 1.928–1.600 area could create a high-probability long opportunity, targeting the 2.590 level.
A minor bearish correction is possible based on the current price action, with the primary aim to test the 1.740 level. However, a failure to hold the price above the 1.483 support level opens the room for testing the 1.200 area.
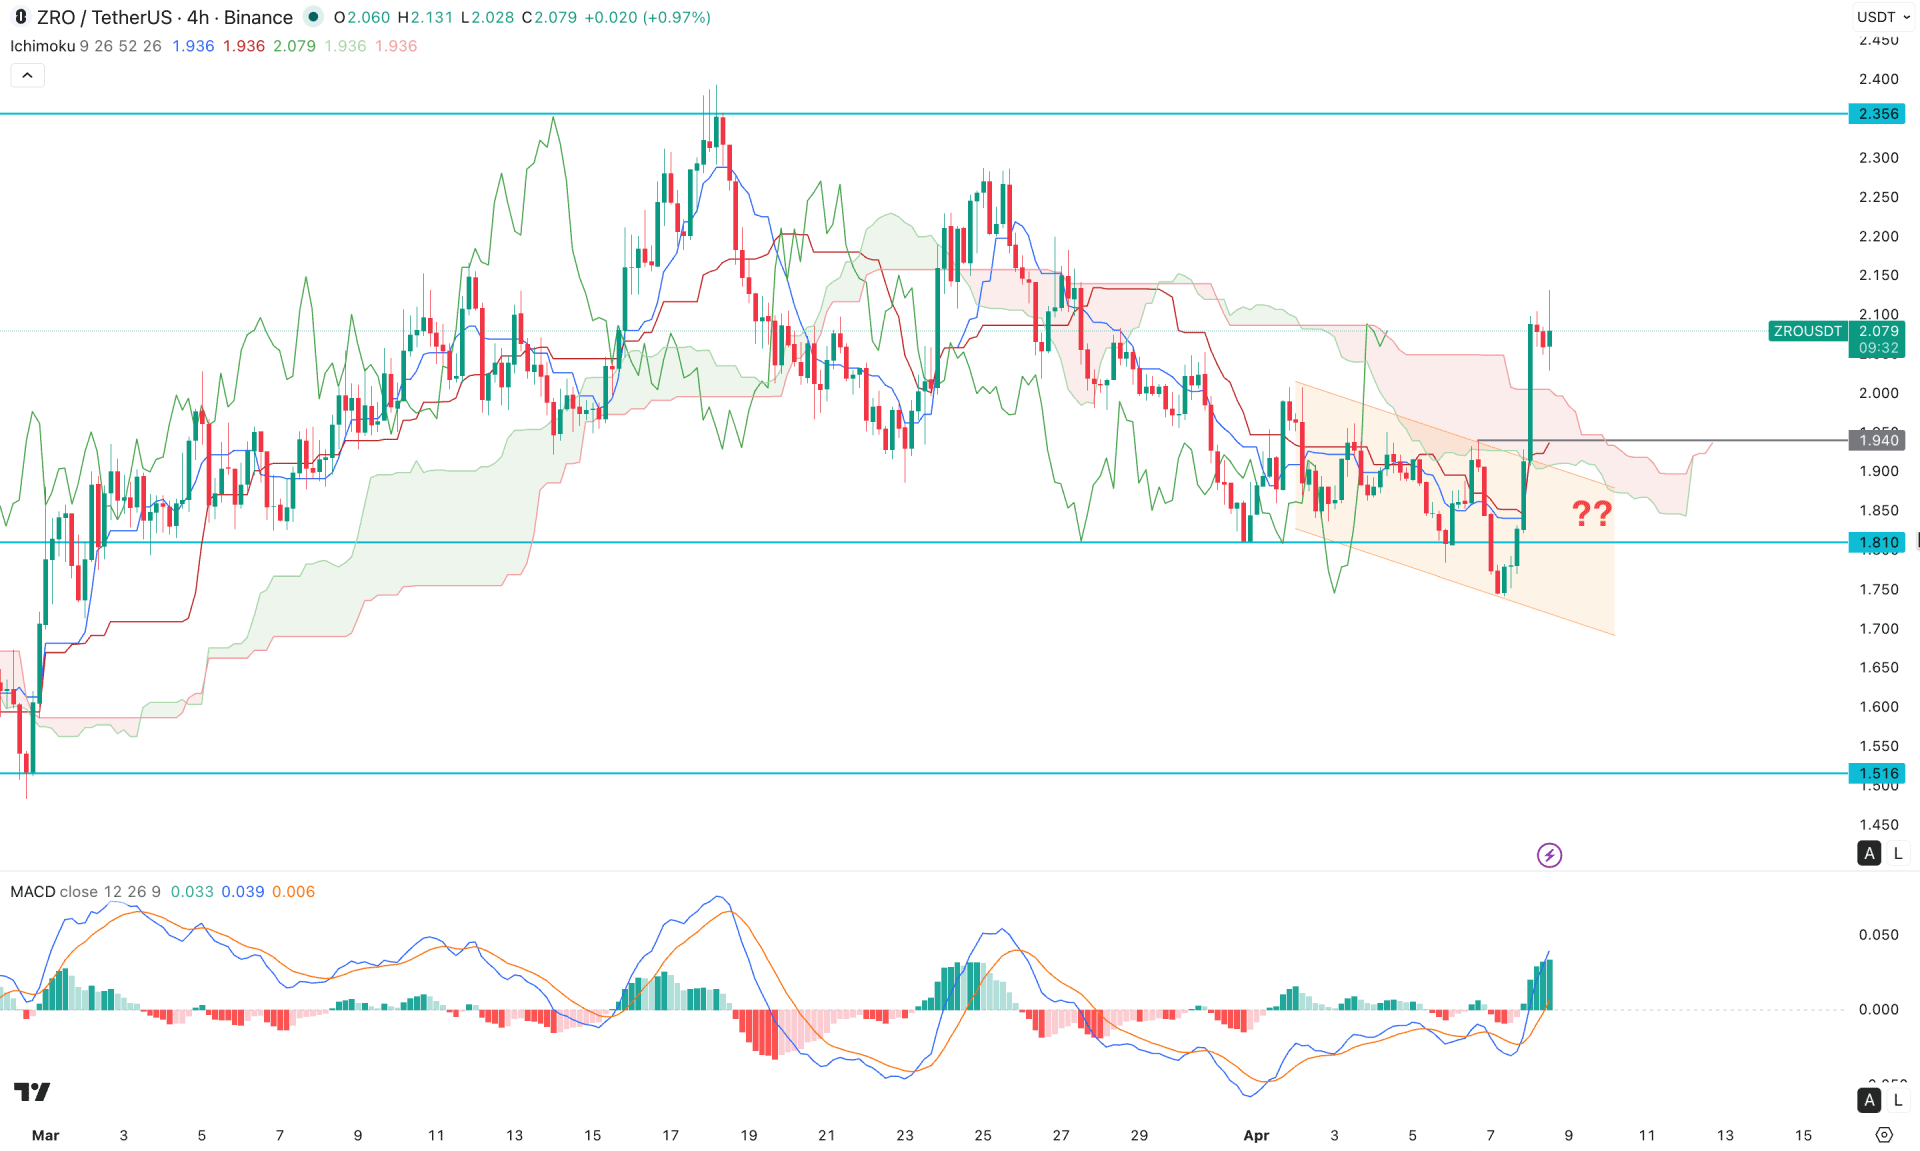
In the H4 timeframe, strong buying pressure is evident with a bullish cloud breakout, signalling a primary bullish move from the bottom. However, it is not the right time to consider it as a trend reversal, as investors should monitor how the price reacts after the breakout. Primarily, the price is consolidating above the 1.810 support level, from where a decent bearish correction is ending.
Moreover, the future cloud is flipping position, but both lines are close together, which is not sufficient to validate a trend reversal. Also, the gap between the current price and the dynamic lines has expanded, creating room for a decent downside correction.
In the secondary indicator window, the MACD histogram shows buying pressure across multiple periods, with the signal line suggesting strong buying pressure in the market.
Based on this structure, investors should keep a close eye on the 1.940 bullish flip area, as the price could reach this level in the coming hours. Any bullish reversal signal at the dynamic Kijun-sen level could open a long opportunity, with the primary aim to test the 2.356 resistance level.
On the other hand, the price is trading above the Kumo cloud after a pump-and-dump move, but a four-hour close below the 1.810 level would eliminate the buying opportunity and expose the 1.516 support level.
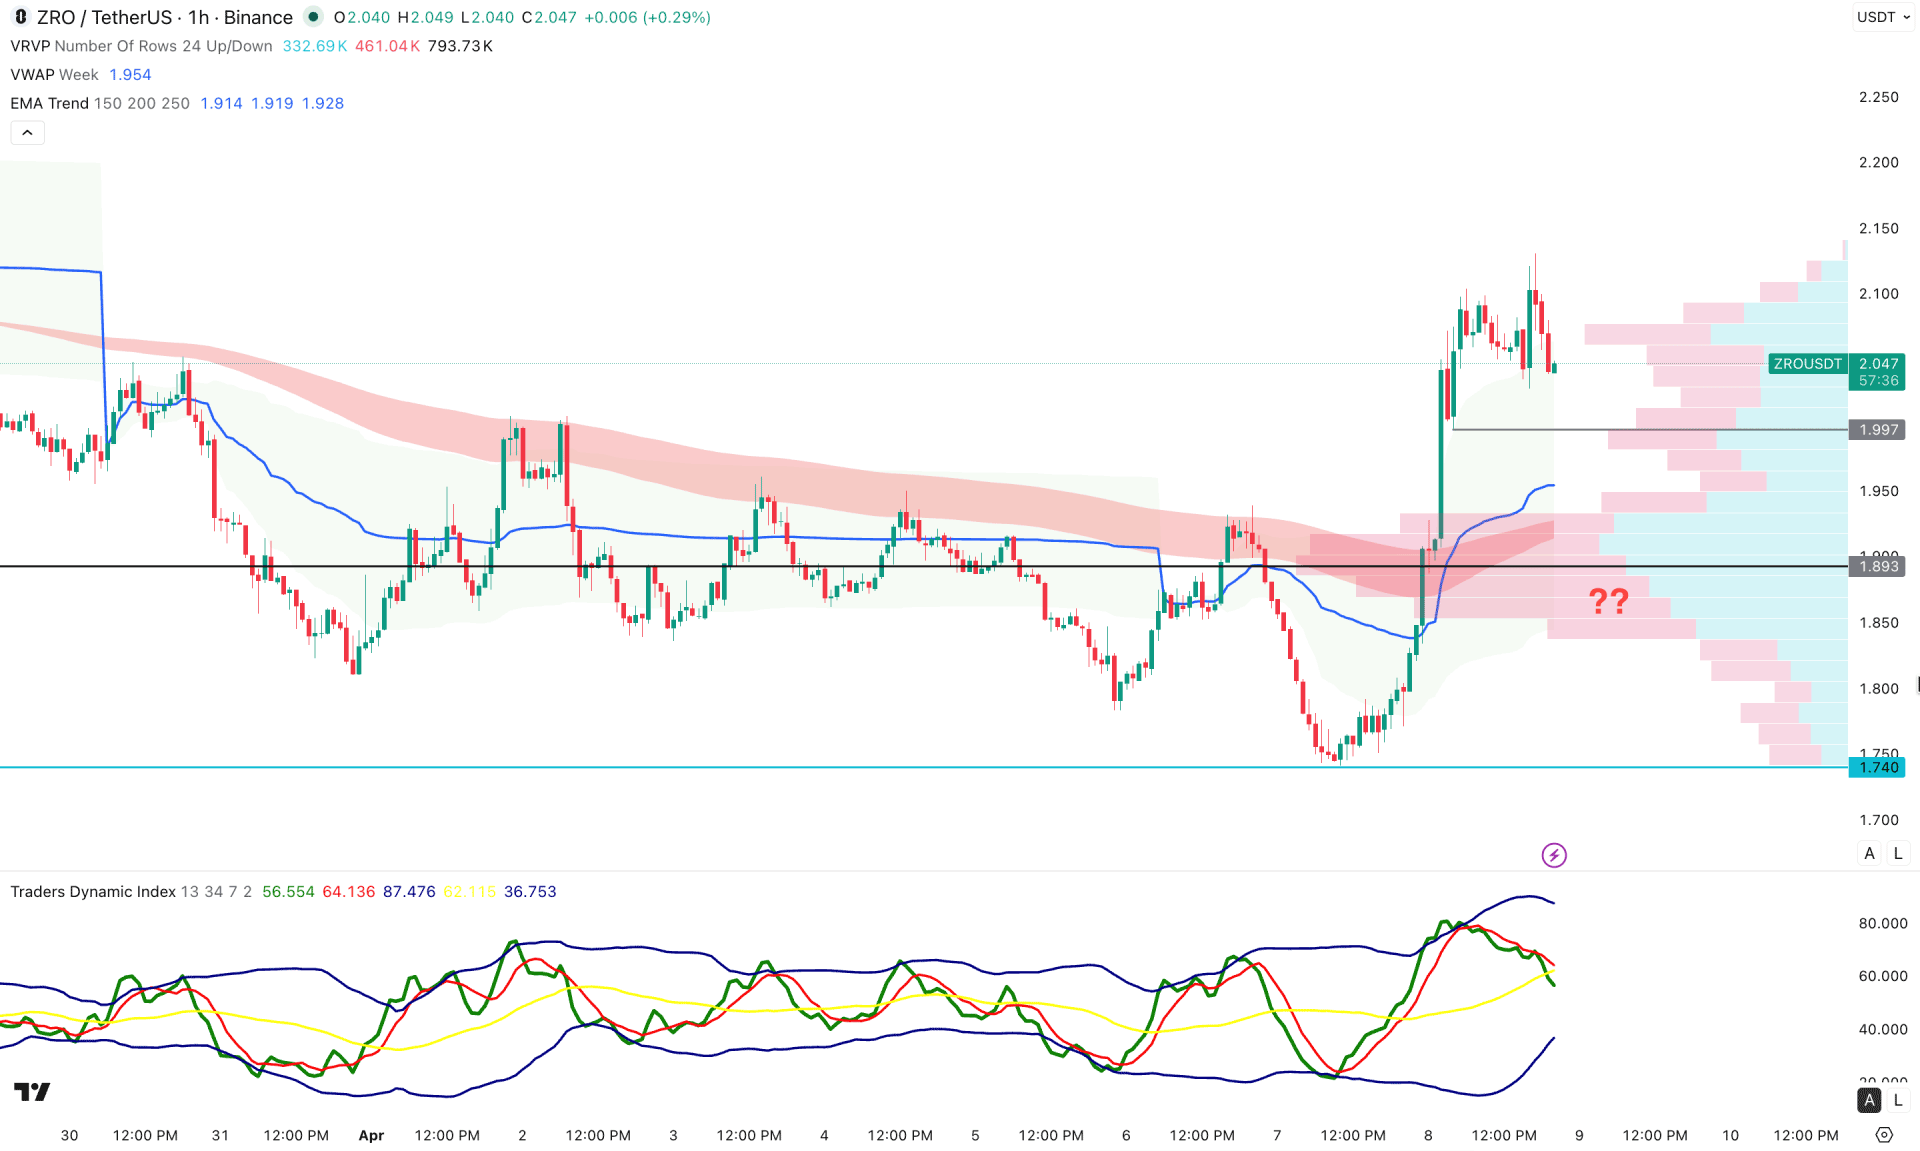
On the hourly timeframe, extreme bullish pressure is evident, pushing the price above the range high and forming a new swing high around the 2.140 level. As a result, impulsive buying pressure is visible above the exponential moving average wave and weekly VWAP.
In the secondary indicator window, corrective bearish momentum is present in the Traders Dynamic Index line, which followed a peak at the 80.00 level. It is a sign of a minor correction within a major trend, where the overall market direction remains bullish.
Based on the hourly market structure, a decent downside correction is possible, with immediate support at 1.997. A bearish break below this level may find support from the EMA wave, from where a bullish reversal candle could offer a long opportunity.
On the bullish side, the next resistance level to watch is the 2.200 level, before heading towards the 2.500 area. However, an impulsive counter-bearish pressure below the 1.950 level would increase the possibility of testing the 1.800 area.
Based on the overall market outlook, ZRO/USDT is trading within a bullish market structure on the daily chart. The current price remains bullish, from where a decent downside correction could offer a long-term bullish continuation opportunity from a reliable price area.


