
Published: June 20th, 2024
Kroger Co (KR) is likely to disclose its next report for the first quarter of 2024. The current estimate for earnings per share is $1.33, which is 11.9% down from the same quarter last year. Nevertheless, Kroger has consistently exceeded earnings estimates by an average of 8.5% in the last four quarters.
Kroger is confronted with a challenging operating environment characterized by reduced consumer expenditure, decreased savings, and fewer government benefits due to increased interest rates. Furthermore, the grocery industry is experiencing increased competition as retailers reduce prices and broaden their selection of budget-friendly foods.
Kroger anticipates a sales growth of 0.25% to 1.75% in fiscal 2024, except fuel. The company anticipates sales will increase throughout the year, surpassing the initial obstacles of low inflation rates and SNAP benefit reductions in early 2024. The first quarter will have the lowest inflation, with gradual increases anticipated. This will result in identical sales that begin at or slightly below the lower end of the annual forecast.
Kroger's strategic initiatives, such as "Accelerating with Digital" and "Leading with Fresh," have been advantageous. Programs such as Delivery Now, the Boost membership, and expanded customer fulfillment centers have propelled the digital business to prominence as a significant growth sector. Additionally, Kroger has been enhancing its inventory management and supply chain to guarantee exceptional customer satisfaction. These initiatives are anticipated to affect Kroger's forthcoming results advantageously.
Let's see the further aspect of this stock from the KR technical analysis:
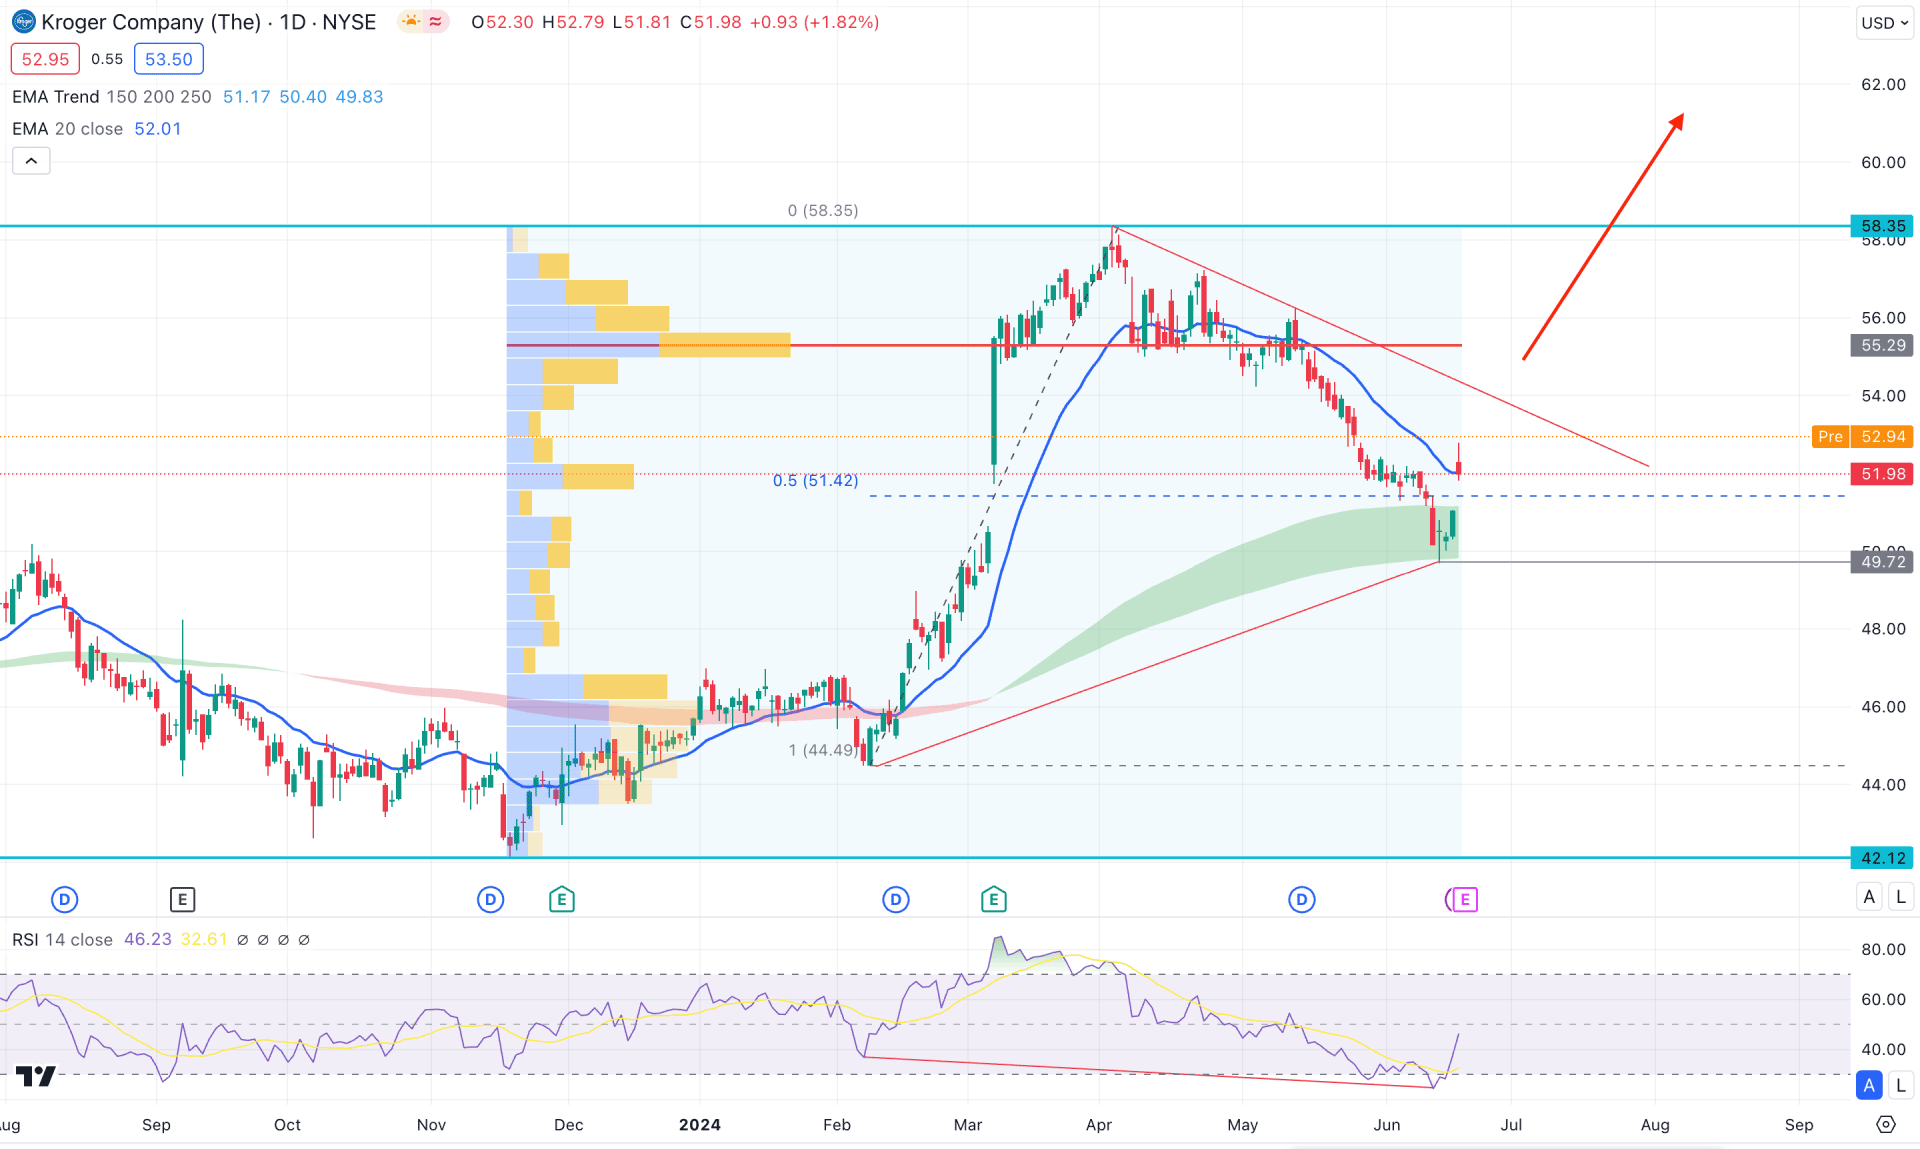
In the daily chart of KR, the ongoing price action indicates a strong bullish trend initiated from the 44.49 low. If we draw a Fibonacci retracement level from 44.49 to 58.35, we will find the 50% level at 51.42. As the most recent price shows a bullish reversal from this Fibonacci level, we may expect buying pressure in the coming days.
Looking at the volume structure, the most active level since November 2023 still suggests an active sellers' presence in the market. According to the fixed volume high-volume indicator, the crucial level is marked at 55.29, which is above the current price. Primarily, we may expect a conservative bullish approach once the price overcomes this level with a valid daily close. On the other hand, a failure to overcome this line and a bearish rejection from the following trend line resistance would be a challenging factor for bulls.
In the higher timeframe, the current monthly candle aimed lower and reached its opening price, while the last three month's price still trades within the March 2024's body. Moreover, the weekly price still trades below the 20-week EMA line, suggesting no valid bottom formation.
However, the daily price found is at the bottom of the Moving Average wave, where MA 150-250 remains below the current price, working as a crucial support. Therefore, the primary outlook for this stock is bullish as long as it trades above the MA wave area.
In the indicator window, the Relative Strength Index (RSI) has reached the bottom and formed a valid bullish reversal from the 30.00 level.
Based on the daily market outlook of KR, a bullish trendline breakout could open a high probable long opportunity, aiming for the 80.00 level. However, a failure to maintain the buying pressure above the dynamic MA wave with a daily candle below the 49.72 level would lower the price toward the 42.12 support level.
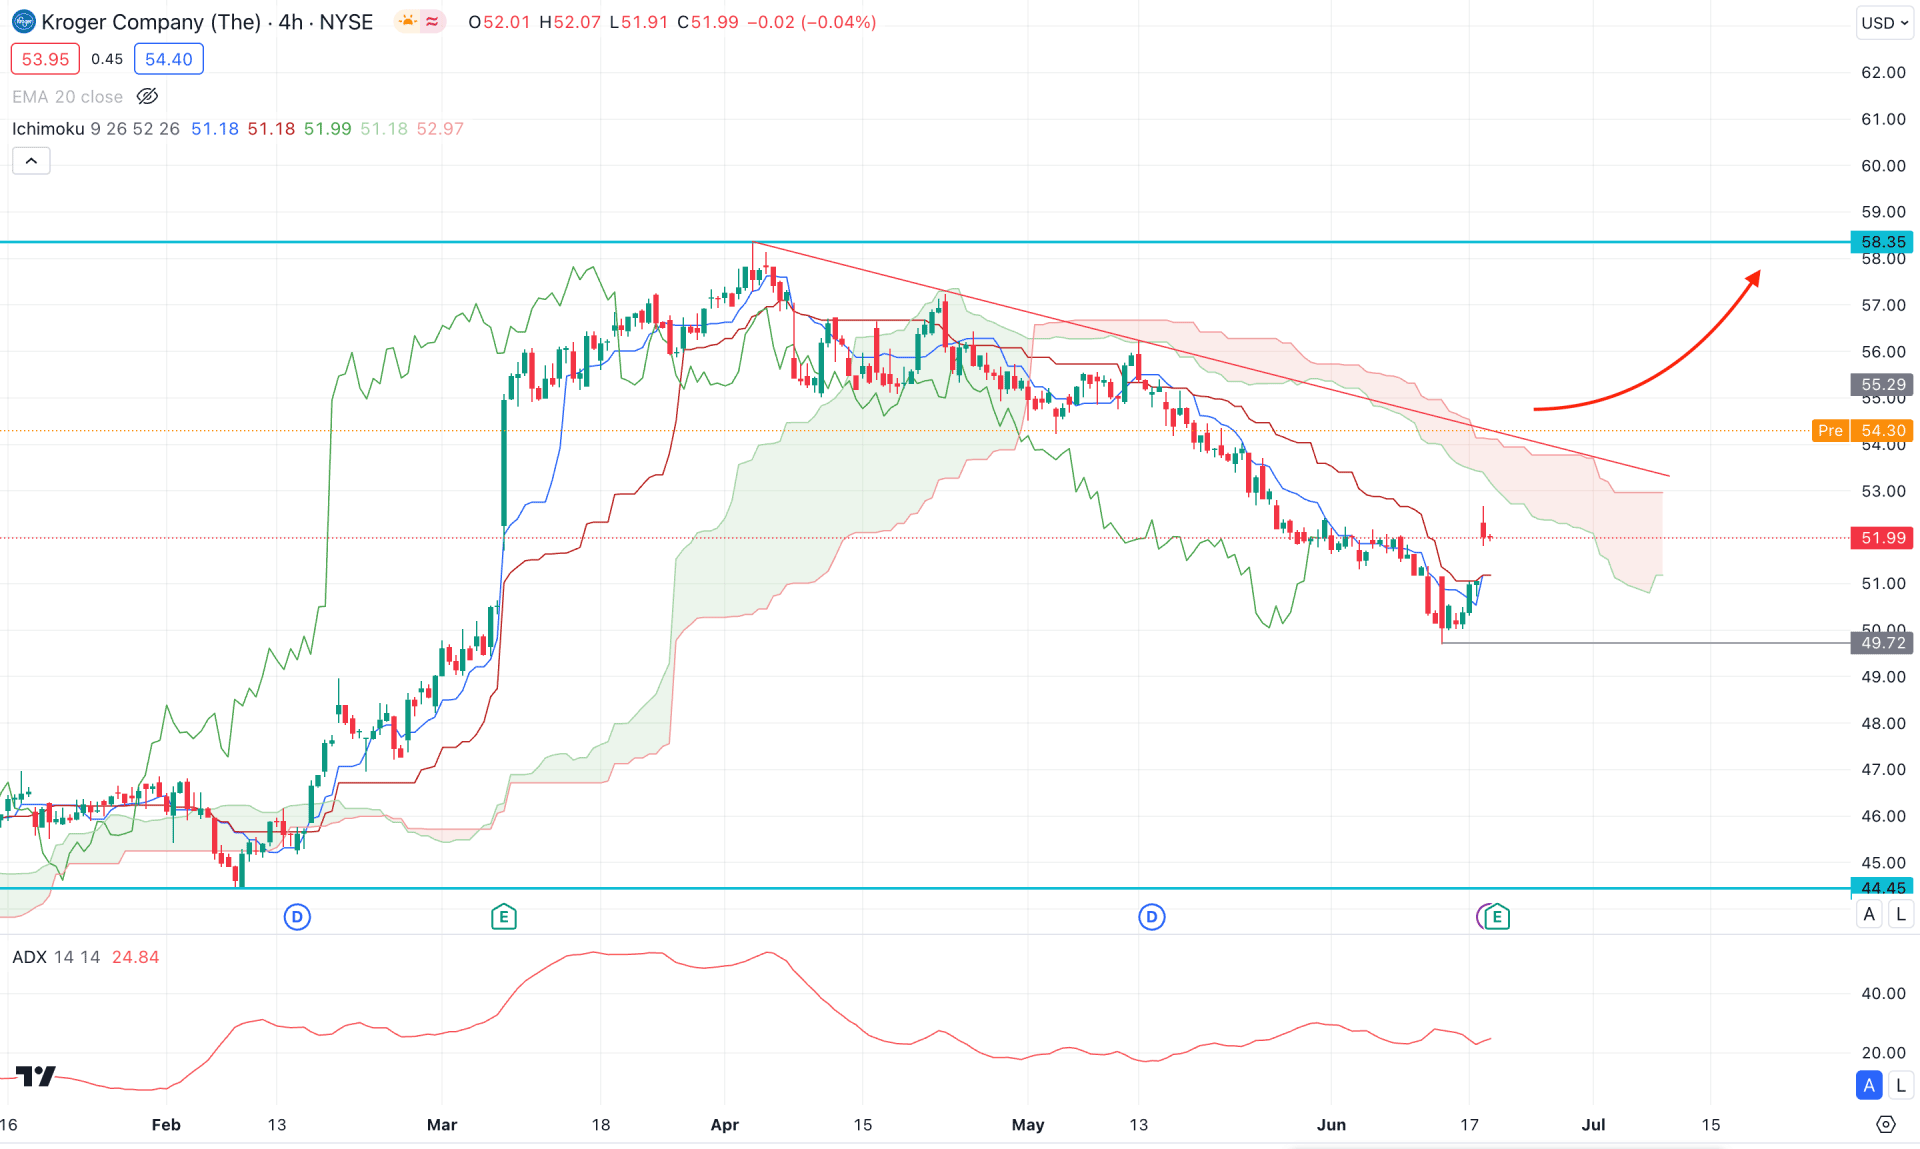
In the H4 chart, the recent price trades below the Ichimoku Kumo cloud, suggesting a minor bearish correction. Moreover, the future cloud suggests a limit to the selling pressure where the current Senkou Span A aimed higher. However, the Senkou Span A is still below the Senkou Span B level, from where a bullish crossover could initiate conservative long approach.
In the Indicator window, the Average Directional Index (ADX) remained steady above the 20.00 line, suggesting a stable market trend.
Based on the ongoing market structure, a bullish trendline breakout with an H4 candle above the cloud resistance could be a long opportunity. In that case, the long-term bullish trend might initiate, aiming for the 62.00 resistance level.
On the bearish side, the dynamic Kijun Sen is the immediate barrier, where a break below this line could lower the price towards the 44.48 support level.
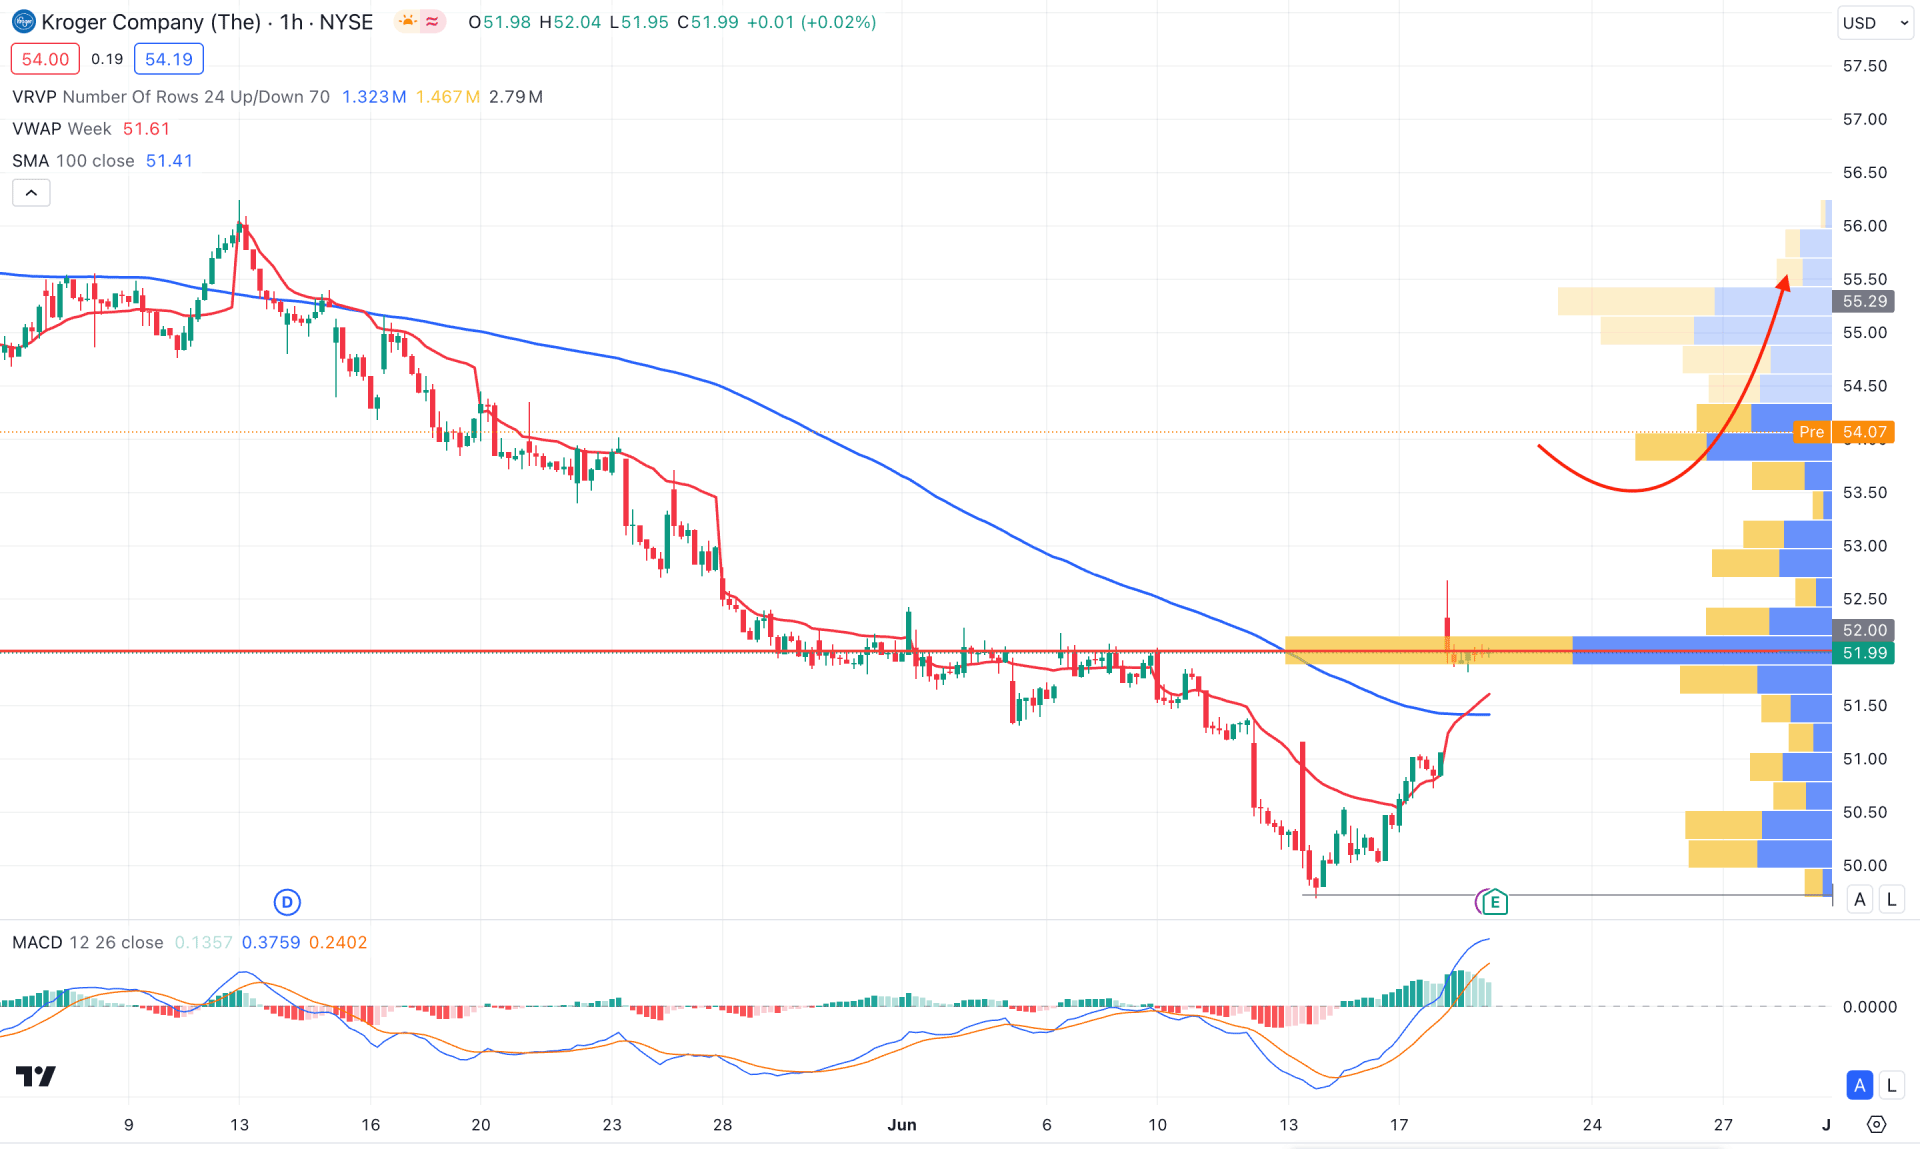
In the hourly chart of KR, the recent price action showed a bullish V-shaped recovery and aimed above the visible range high volume level, which is around the 52.00 area. As the current price trades above this crucial high-volume line, we may expect a bullish continuation in the coming hours. Looking at the major structure, the 100-period simple moving average is below the current price and is aimed higher, while the weekly VWAP has crossed above the dynamic line.
In the indicator window, the MACD histogram maintained upward momentum while bullish pressure was seen from the signal line. In this case, we may expect the buying pressure to extend as long as the signal line stays above the neutral point.
Based on the hourly market outlook for KR, a bullish continuation is likely, with the main aim being to test the 60.00 psychological point. On the bearish side, any downbeat result with an immediate crash below the 100-period simple moving average line could activate a deeper discount towards the 48.00 to 40.00 zone.
Based on the current market outlook of KR, the ongoing buying pressure needs a valid break from the trend line resistance before anticipating a long term bull run. Investors should closely monitor how the price reacts at the current zone before finding a stable trend trading opportunity.


