Published: November 22nd, 2023
Kraft Heinz is a prominent multinational company operating in the consumer packaged food and beverage industry. It is recognized worldwide and is the controlling shareholder of renowned brands, including Maxwell House, Oscar Mayer, Kraft, and Heinz.
As per the analysis of Bryan Spillane, center-store packaged food companies have faced difficulties linked to declining sales volume trends. Nevertheless, he asserts that Kraft Heinz sets itself apart from its competitors by offering this industry's most enticing risk-reward ratio. As a result, there is the possibility of a surge in Kraft Heinz's output due to the restoration of the cream cheese supply chain. This would position the company advantageously compared to its competitors.
This week, a significant number of short positions are visible in this stock as a percentage of float. On average, 3.07 days are necessary to cover brief positions. According to MarketBeat, a short interest ratio between one and four signifies strong positive sentiment and a limited number of short sellers. On the contrary, a ratio surpassing 10 indicates a significant degree of pessimism. Currently, the short-interest ratio for KHC shares is 2.0, which suggests that investors hold a positive sentiment towards the stock.
Moreover, the current PE ratio is 13.96, while the liquidity position suggests a positive business operation. However, investors need more clues to buy this stock, which might be found in the price behavior.
Let’s see the upcoming price direction from the Kraft Heinz Stock (KHC) technical analysis:
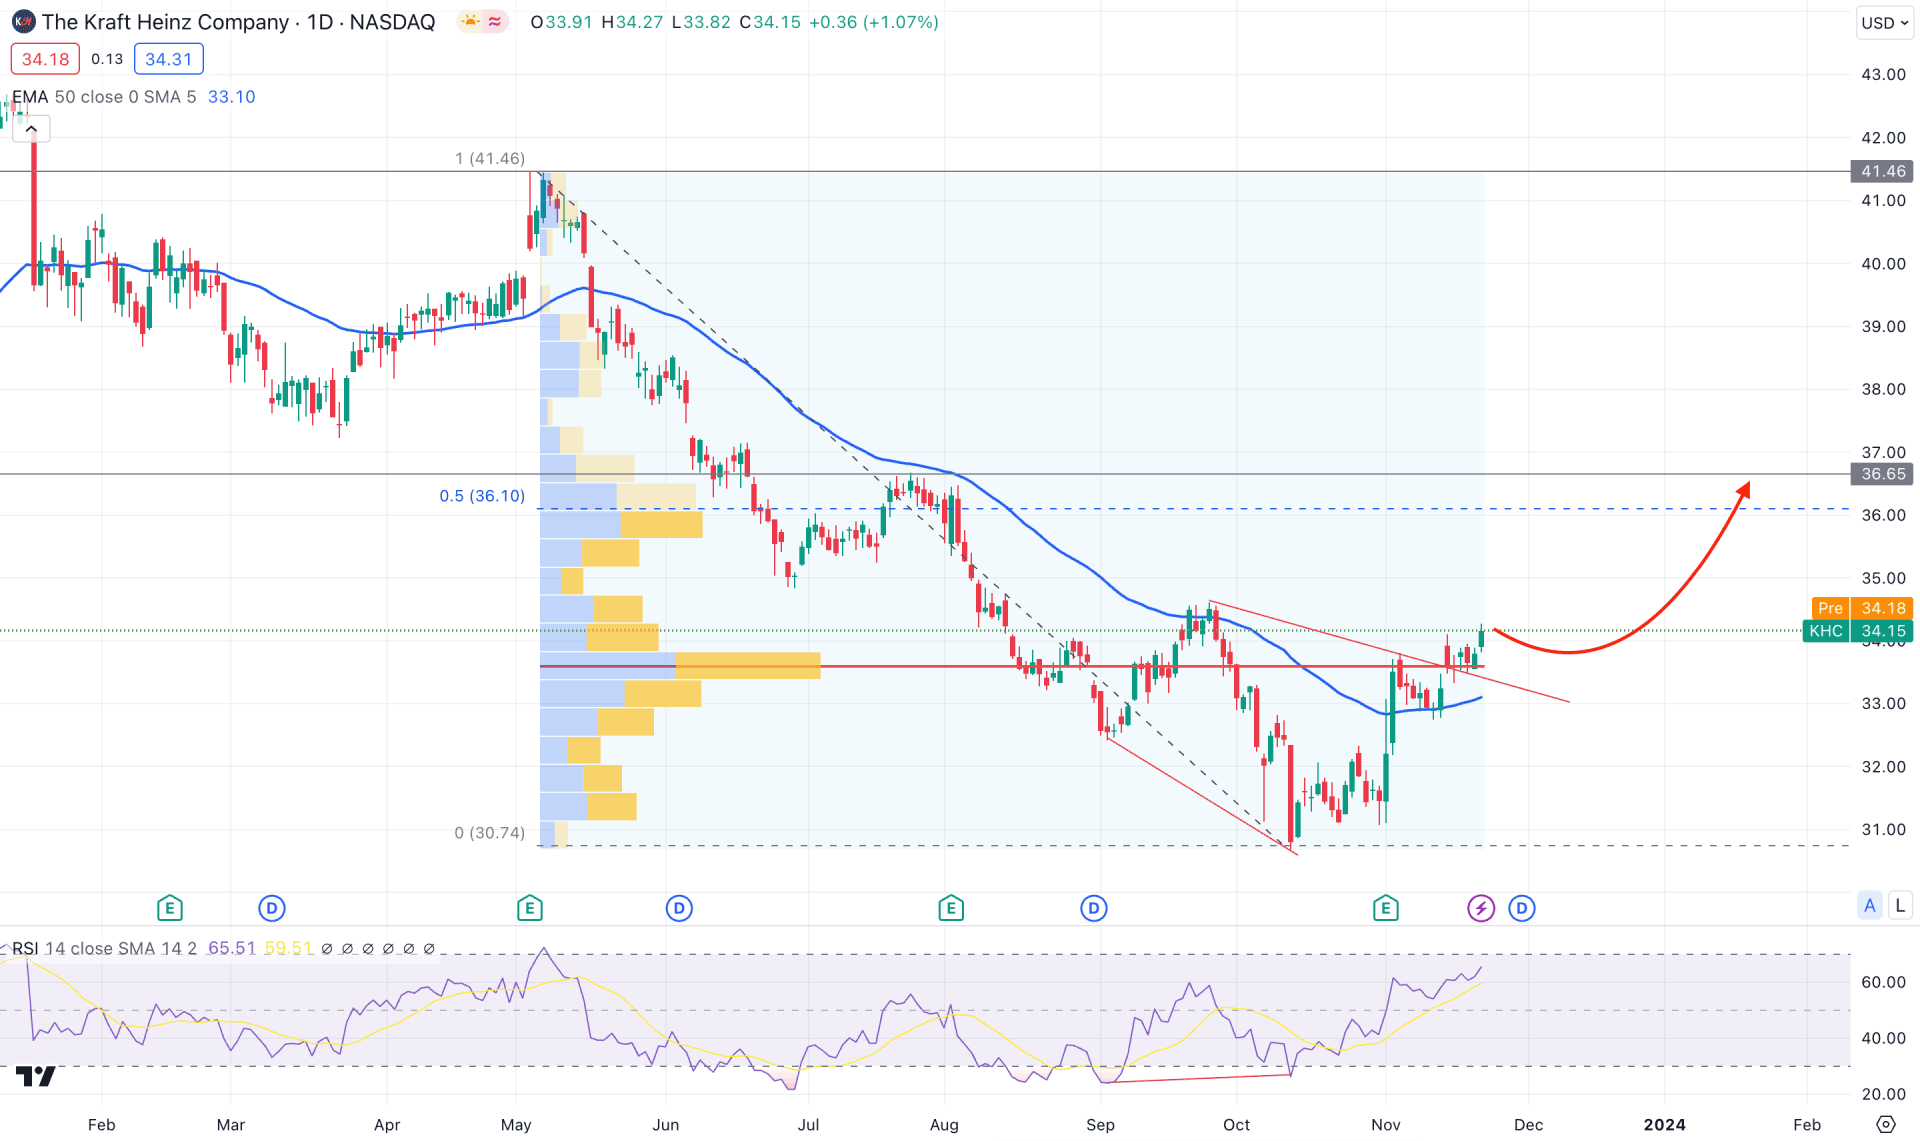
In the daily chart of KHC, the recent price shows a bullish reversal possibility as a stable market is visible above the dynamic 20-day EMA. Therefore, as long as the price consolidates above the dynamic support, investors might find a long opportunity from the discounted zone.
The immediate bullish reversal is potent in the monthly candlestick in the higher timeframe. However, a valid reversal might come if the November candle closes above the 33.61 October high. However, a bullish recovery is potent from the weekly chart, whereas the V-shape recovery is potent. Investors should wait to see how the price reacts at the 34.61 weekly resistance, as a bullish break above this level could initiate a trend reversal.
In the volume structure, the most active level since May 2023 is at 33.59 level, which is just below the current price. It is a sign that bulls have joined the market with a larger accumulation, which can result in a bullish trend continuation.
In the daily chart, a potential inverse “Head and Shoulders” breakout is visible, with a solid bullish daily candle above the neckline. It indicates a strong bullish reversal, supported by an upward sentiment on the Relative Strength Index.
Based on the daily outlook of KHC, a bullish trend continuation is possible as long as the price trades above the dynamic 20 EMA support. In that case, the primary price target would be the 36.65 level before reaching the 41.46 high.
On the bearish side, the existing bearish trend continuation is possible, where a daily close below the 32.00 level could be an alarming sign to bulls. In that case, a downside continuation might come, where the main aim is to test the 25.00 psychological level.
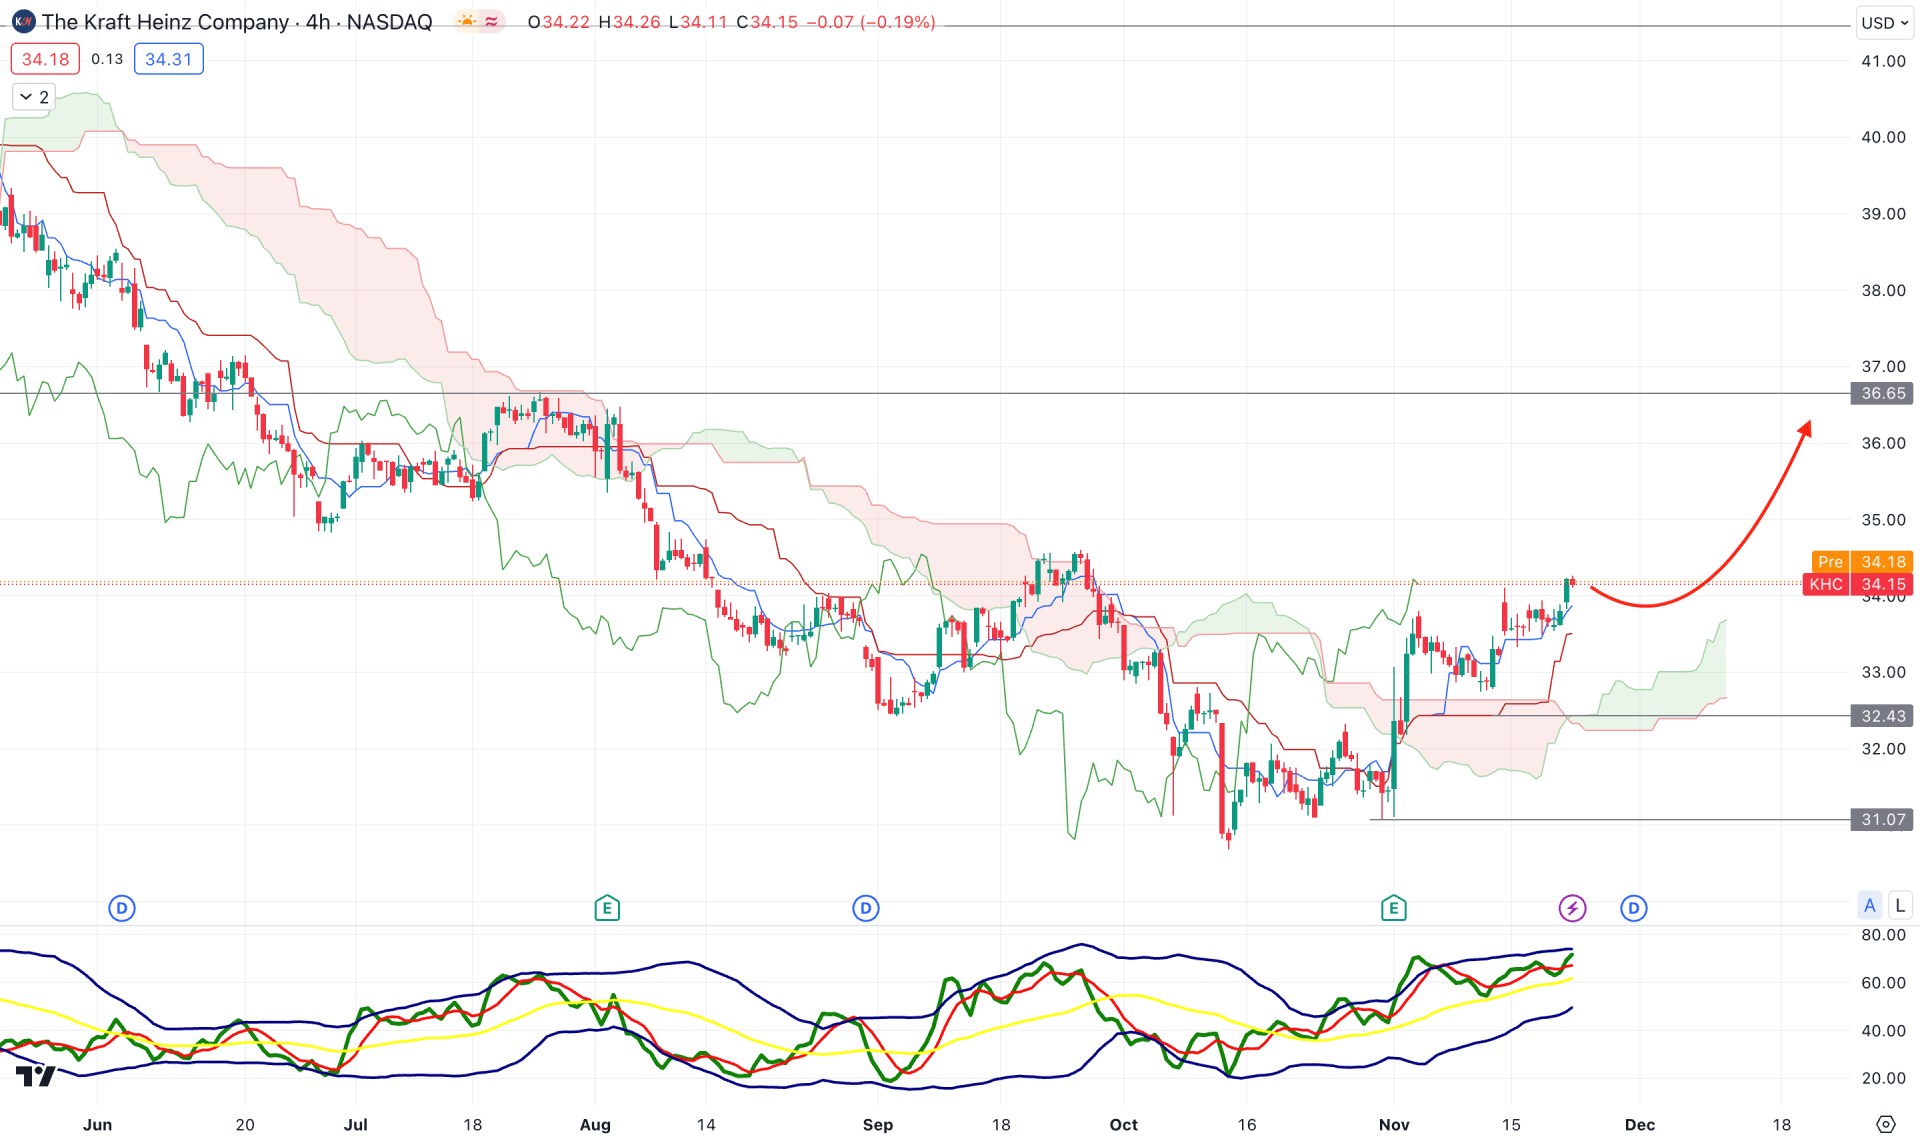
In the H4 timeframe, an extensive bearish pressure is visible below the dynamic Kijun Sen zone. However, the latest price shows an upward reversal with a bullish H4 candle above the cloud resistance for the first time since May 2023.
In the secondary window, the Traders Dynamic Index (TDI) shows an upward possibility as the recent reading shows a stable momentum above the neutral 50.00 line.
Based on the H4 KHC outlook, an upward possibility is valid as long as the price trades above the dynamic Kijun support. In that case, a valid bullish rejection from the 34.00 to 32.00 area could increase the price towards the 36.65 level.
On the bearish side, a sharp downside momentum with an H4 candle below the 31.07 support could be a short opportunity, where the main aim is to test the 28.00 level.
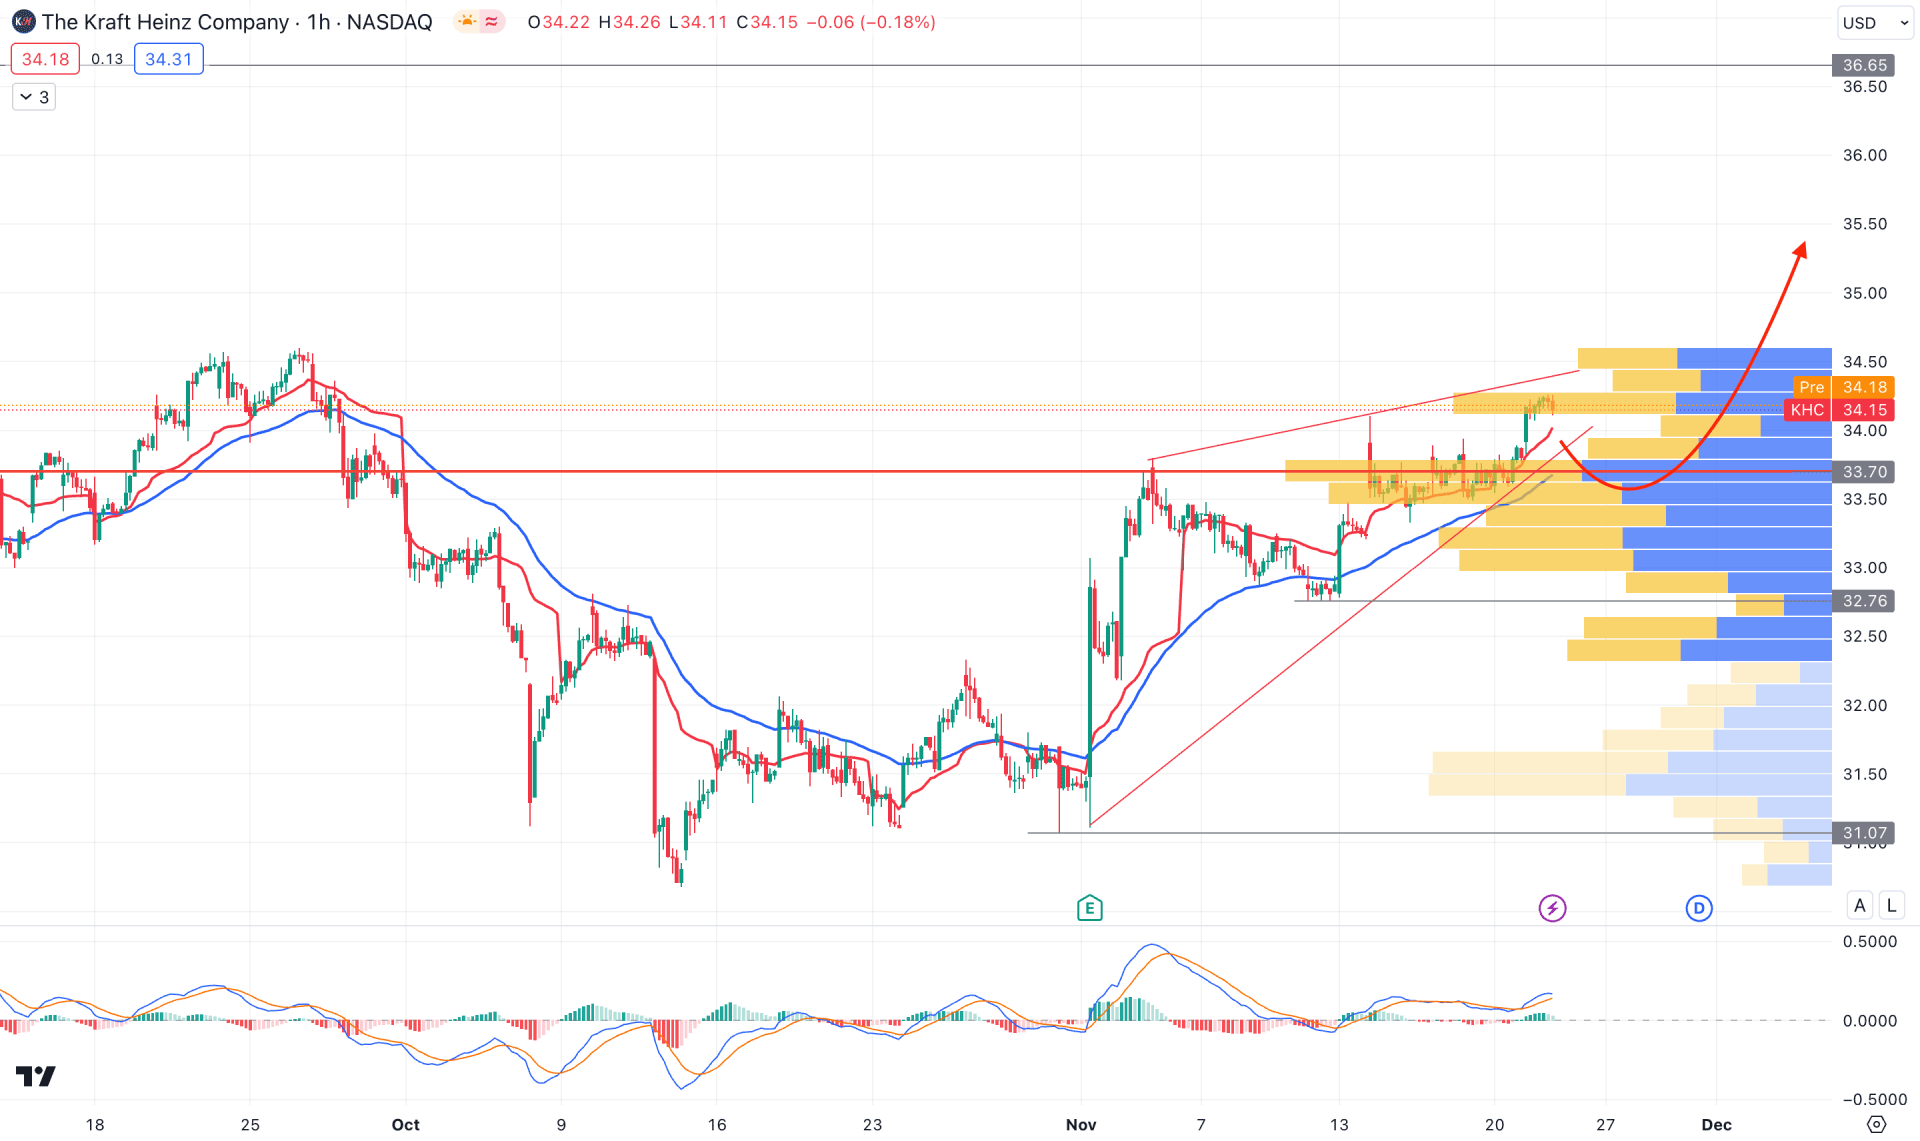
The hourly chart shows a bullish trend continuation as the visible range high volume level is below the current price. However, the rising wedge formation with a divergence with the MACD signal line suggests buyers' weakness in this trend, which could offer a short opportunity.
Based on the hourly chart, a bearish selling pressure might exceed the dynamic high volume level. However, a rebound is possible as long as bulls hold the price above the 32.76 static level.
A sharp downside pressure below the 32.00 psychological level could validate the wedge breakout, which could lower the price toward the 31.07 support area.
Based on the current multi-timeframe analysis, KHC stock faces strong buying pressure from the bottom, supported by the larger accumulation. Moreover, an early buying possibility is visible from the intraday chart, as the H4 chart shows a stable market above the Cloud support level.