Published: February 5th, 2025
An important step toward fusing blockchain technology with artificial intelligence (AI) has been accomplished by Kava, a layer-1 blockchain that is compatible with EVM and based on the Cosmos SDK. The network's ambitious aim to become an autonomous AI (DeAI) blockchain was laid out in its DeAI light paper, which was published in January 2025. In order to establish Kava as a pioneer in decentralized AI, this strategic shift places a strong emphasis on the creation of AI-driven items, a thorough 2025 path, and a rebranding campaign.
Kava's architecture, which is well-suited to meet AI's operational demands, makes possible decentralized data storage and computing for artificial intelligence algorithms and automated AI task execution within blockchain systems.
An important turning point in its development has been reached with Kava's publication of the DeAI light paper, which lays the groundwork for integrating artificial intelligence into a decentralized blockchain architecture. Thanks to its solid technological base, comprehensive roadmap, and ongoing rebranding initiatives, Kava is well-positioned to make a significant impact in the autonomous AI market.
As the project develops, Kava's dedication to creativity and openness may position it as a major force in the fusion of AI and blockchain.
Let's see the further outlook of this token from the KAVA/USDT technical analysis:
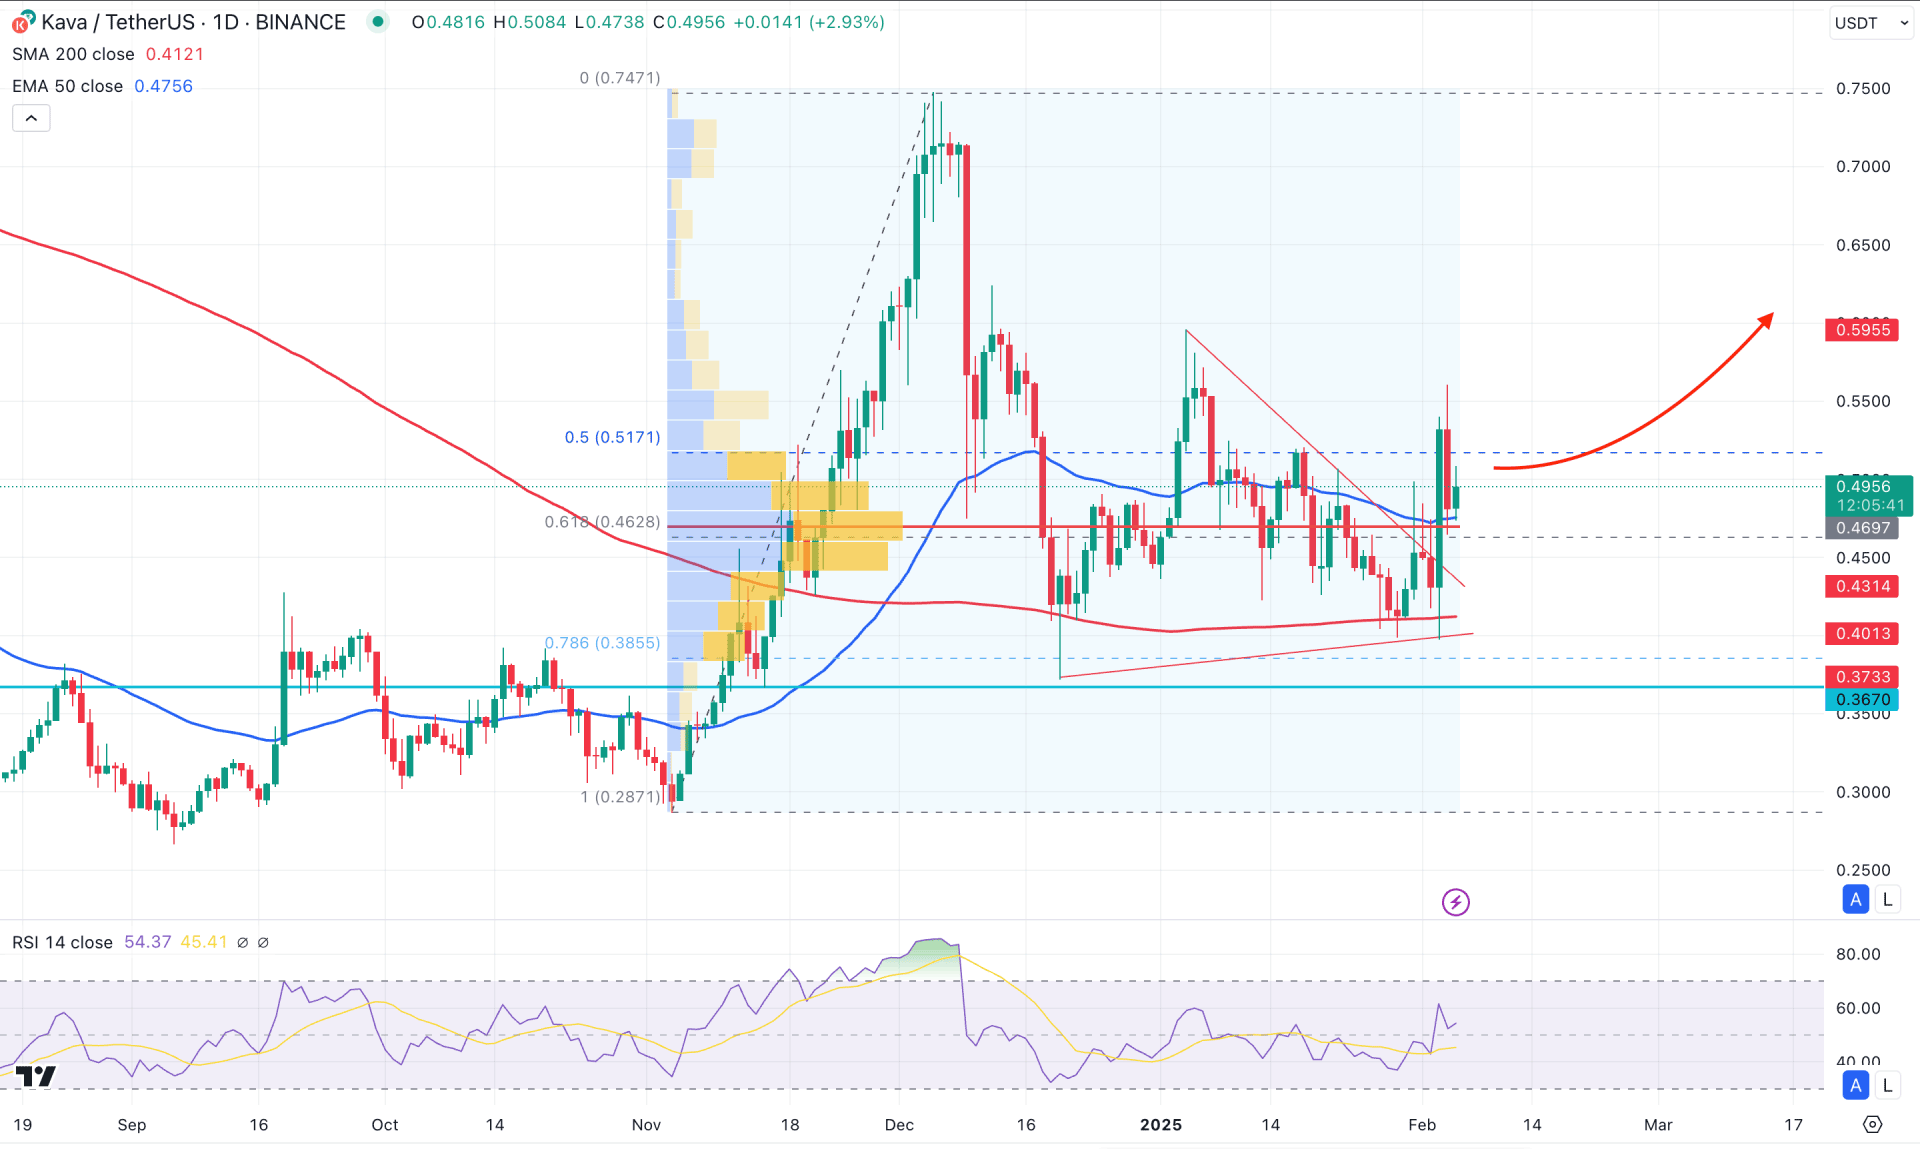
The current tradable range is clearly visible in the daily chart of KAVA/USDT. As the price formed a bullish break of structure from the November 2024 bottom, we may consider it a valid bullish trend. In this context, the primary aim for this pair is to look for long trades following the major market trend.
Looking at the higher timeframe, the price is trading at the bottom, as shown by the monthly chart. Moreover, a sideways momentum is present after the bullish wave in November 2024. As long as the price is trading within the November 2024 candle's body, we may expect a bullish continuation from a valid price reversal.
The weekly price shows a positive outlook as a strong bullish breakout appeared after two consecutive dozy candlesticks However, investors should monitor how the weekly candle closes before anticipating any long movement.
The volume structure shows a positive outlook, as the high volume level from November 2024 is below the current price. Moreover, the latest daily candle closed above the high volume line, with more than 50% of the candle's body in the bullish zone.
In the main price chart, the 200-day Simple Moving Average remains flat, suggesting a corrective wave after a long selling pressure. It signals that sellers become weaker, and the order-building process is activated from the bottom. However, a valid price reversal above the 50-day Exponential Moving Average could be a decent long opportunity as a golden Cross continuation pattern.
Based on the daily outlook of KAVA/USDT, a triangle breakout is visible, which is good work as a strong long signal. Moreover, the price formed a decent recovery and retested triangle support before going sideways in the chart. Also, the price tested the optimum trading entry zone, which is the 61.8% to 76.8% Fibonacci Retracement area of the bullish wave.
The upward signal is potent. The main aim is to test the 0.7000 level, which is a crucial psychological line.
On the other hand, a failure to hold the price above the 50-day EMA could be a bearish factor for this pair. I selling pressure below the 0.4316 level could lower the price toward the 0.3000 area.
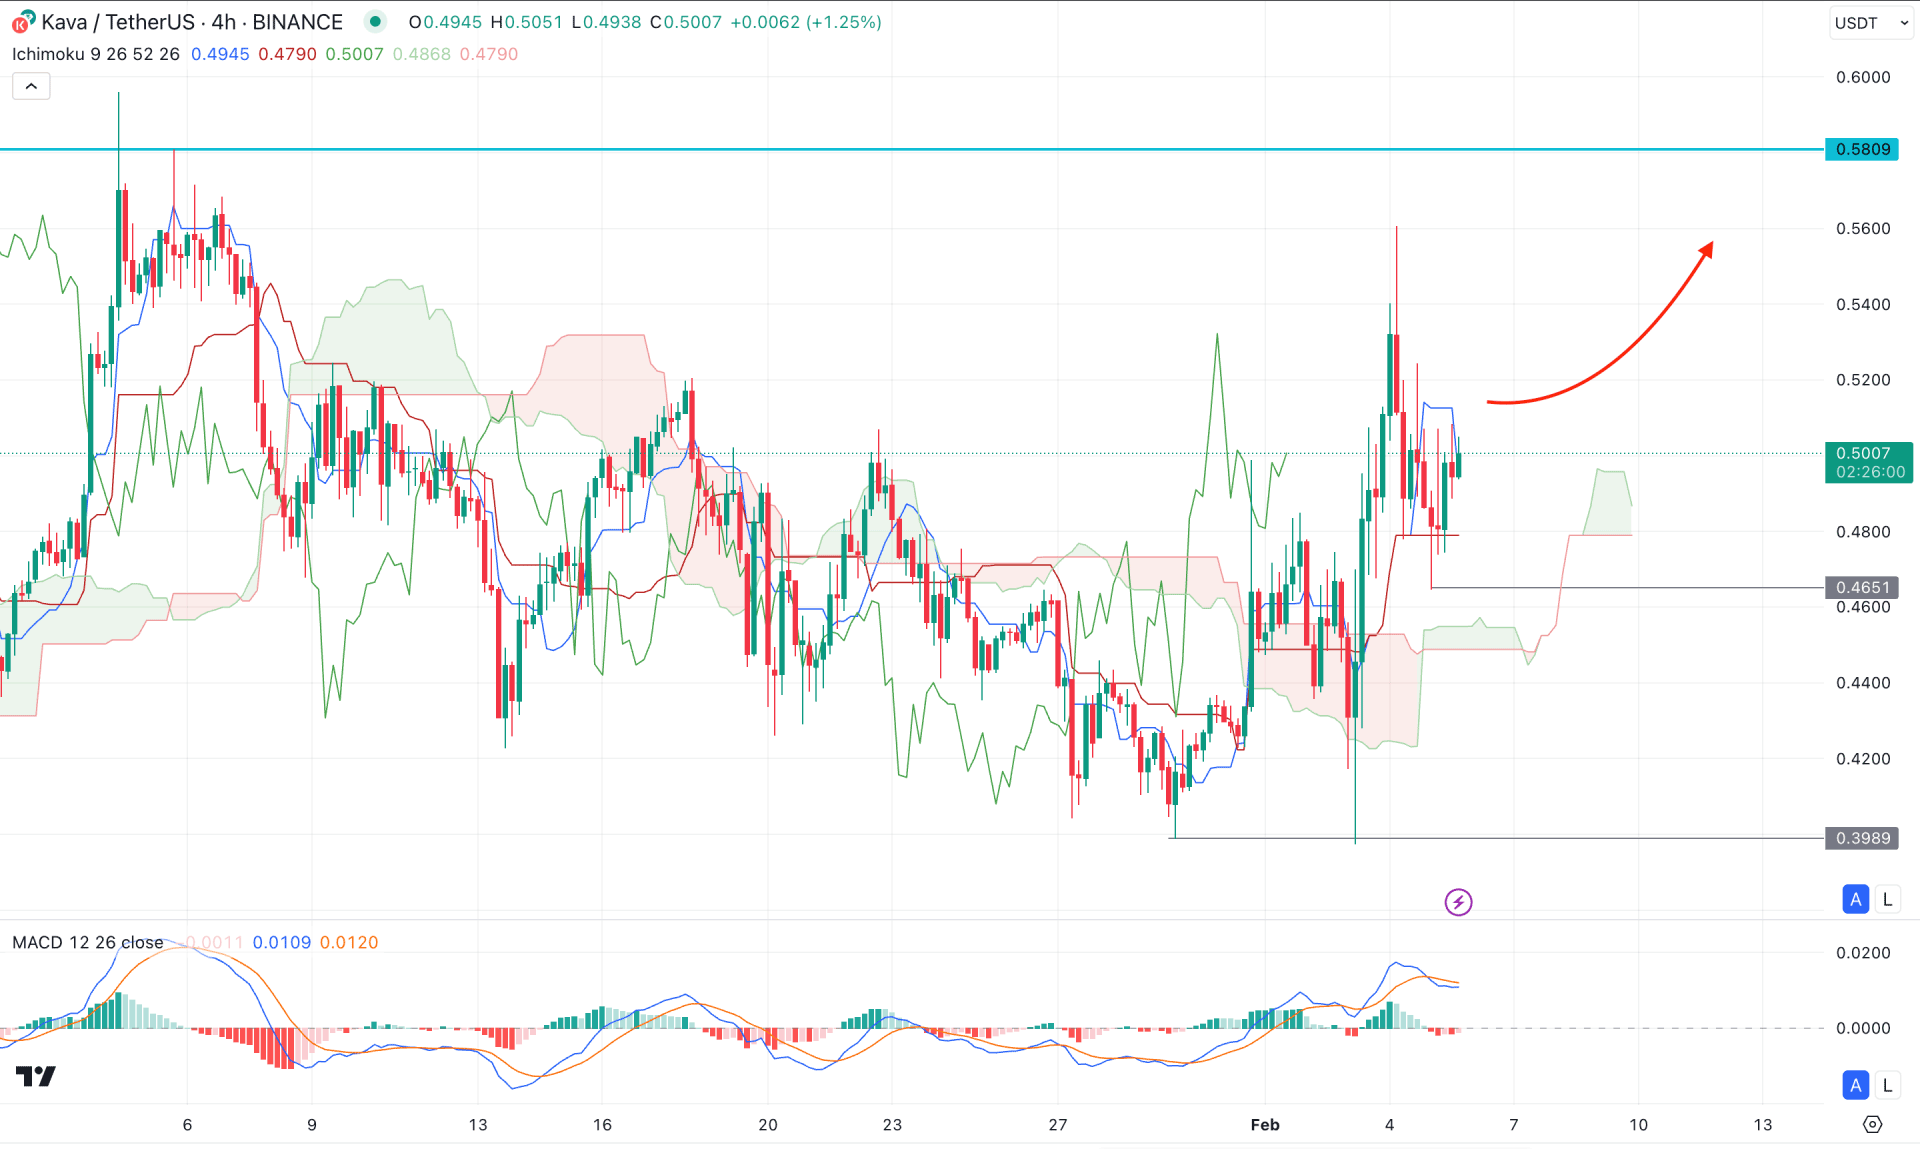
In the H4 timeframe, the KAVA/USDT price is trading within strong bullish pressure. The market momentum flipped from the bearish to the bullish zone with a cloud breakout. As a result, the Futures Cloud shifted its position, taking the Senkou Span A above the Senkou Span B.
At the bottom of the price showed a minor liquidity sweep from the 0.3989 low, which could work as a confluence of buying pressure. Although the MACD histogram remains in the bearish zone, from where the latest vertical line reached the neutral point.
Based on the current market outlook, investors might find bullish trend continuation momentum as long as the dynamic Kijun Sen is working as support. On the upside, the immediate resistance is at the 0.5809 level. Overcoming this line could extend the momentum above the 0.7000 psychological line.
On the bear side, investors should monitor how the price holds the momentum about the cloud level as an immediate selling pressure below the cloud low could initiate a range extension.
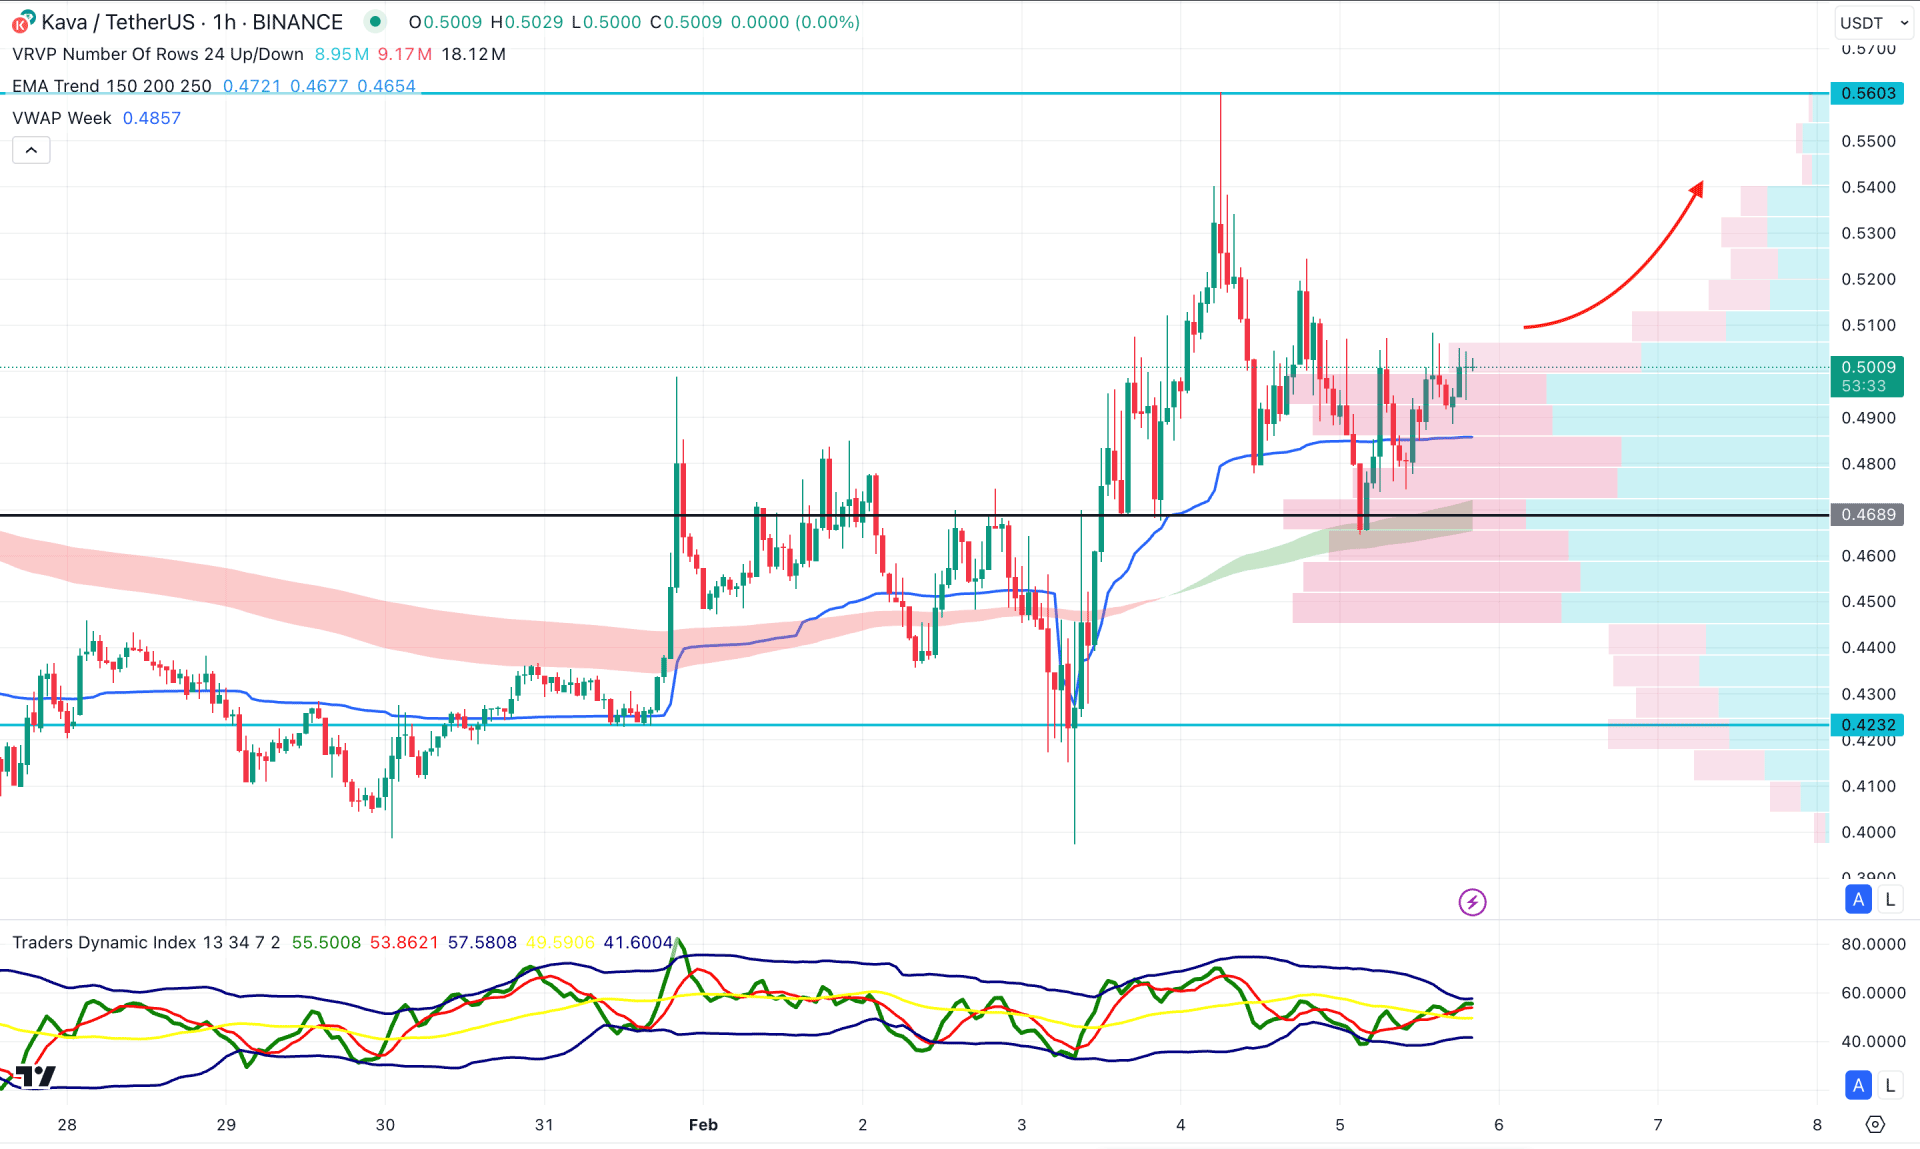
In the hourly time frame, a bullish V-shaped recovery is present, taking the price above in today's high volume line at the 0.4689 area. Moreover, multiple bullish candles are present above the dynamic weekly VWAP support while the Moving Average wave is in line at the bottom.
The indicator window shows a short squeeze where the TDI line is hovering above the 50.00 neutral point.
Based on the hourly outlook, a strong support continuation is present as long as the high volume line remains below the current price. As a train line, liquidity is building, and the price can rise after having a corrective momentum above 0.508011 before reaching the 0.5600 area.
On the other hand, any immediate selling pressure below the 0.4600 level might invalidate the bullish opportunity and lower the price below the 0.4000 area.
As per the current findings, USDT has a higher possibility of extending the current bullish pressure. However, the ongoing volatility in the broader crypto market needs to be considered. Any positive sign in the industry with a stable market above 0.5600 could be a highly probable long-term opportunity in this coin.


