Published: May 15th, 2024
KAS experienced an extraordinary surge after listing in Coinone, propelling it to position 38 among the top 33 cryptocurrencies by market capitalization. KAS surged from $0.05139 to its present all-time peak of $0.1545 on November 19, a span of several days. The more than 200 percent price surge exemplified the substantial influence that exchange listings can exert on the Kaspa ecosystem and its subsequent price movement.
If Kaspa successfully obtains listings on prominent exchanges such as Binance and Coinbase, it is possible to expect comparable or even greater market exposure and growth. This advancement would appeal to a wider range of investors and positively impact the coin's overall performance, which is in line with De Rover's assessment.
Kaspa has attracted considerable interest due to its utilization of the proof-of-work (PoW) consensus mechanism and its blockDAG (Block Directed Acyclic Graph) architecture. By implementing this architecture, numerous blocks can exist concurrently, thereby addressing elevated orphan rates frequently encountered in traditional blockchains.
Central to Kaspa's operation is the GHOSTDAG protocol, which enables the concurrent existence and consensus-based arrangement of blocks. This blockDAG methodology maintains high block rates while ensuring the security of operations. Kaspa, which is presently functioning at one block per second, endeavors to attain rates spanning from ten to one hundred blocks per second.
This scalability potential distinguishes Kaspa from many other blockchain networks, which may attract investors and contribute to its sustained price growth. In the past year, KAS has increased by 1471 percent.
Overall, Kaspa endeavors to establish a robust framework for diverse applications that necessitate secure blockchain solutions by tackling obstacles associated with orphan rates and embracing a decentralized, community-driven methodology.
Let's see the further aspect of this cryptocurrency from the KAS/USDT technical analysis

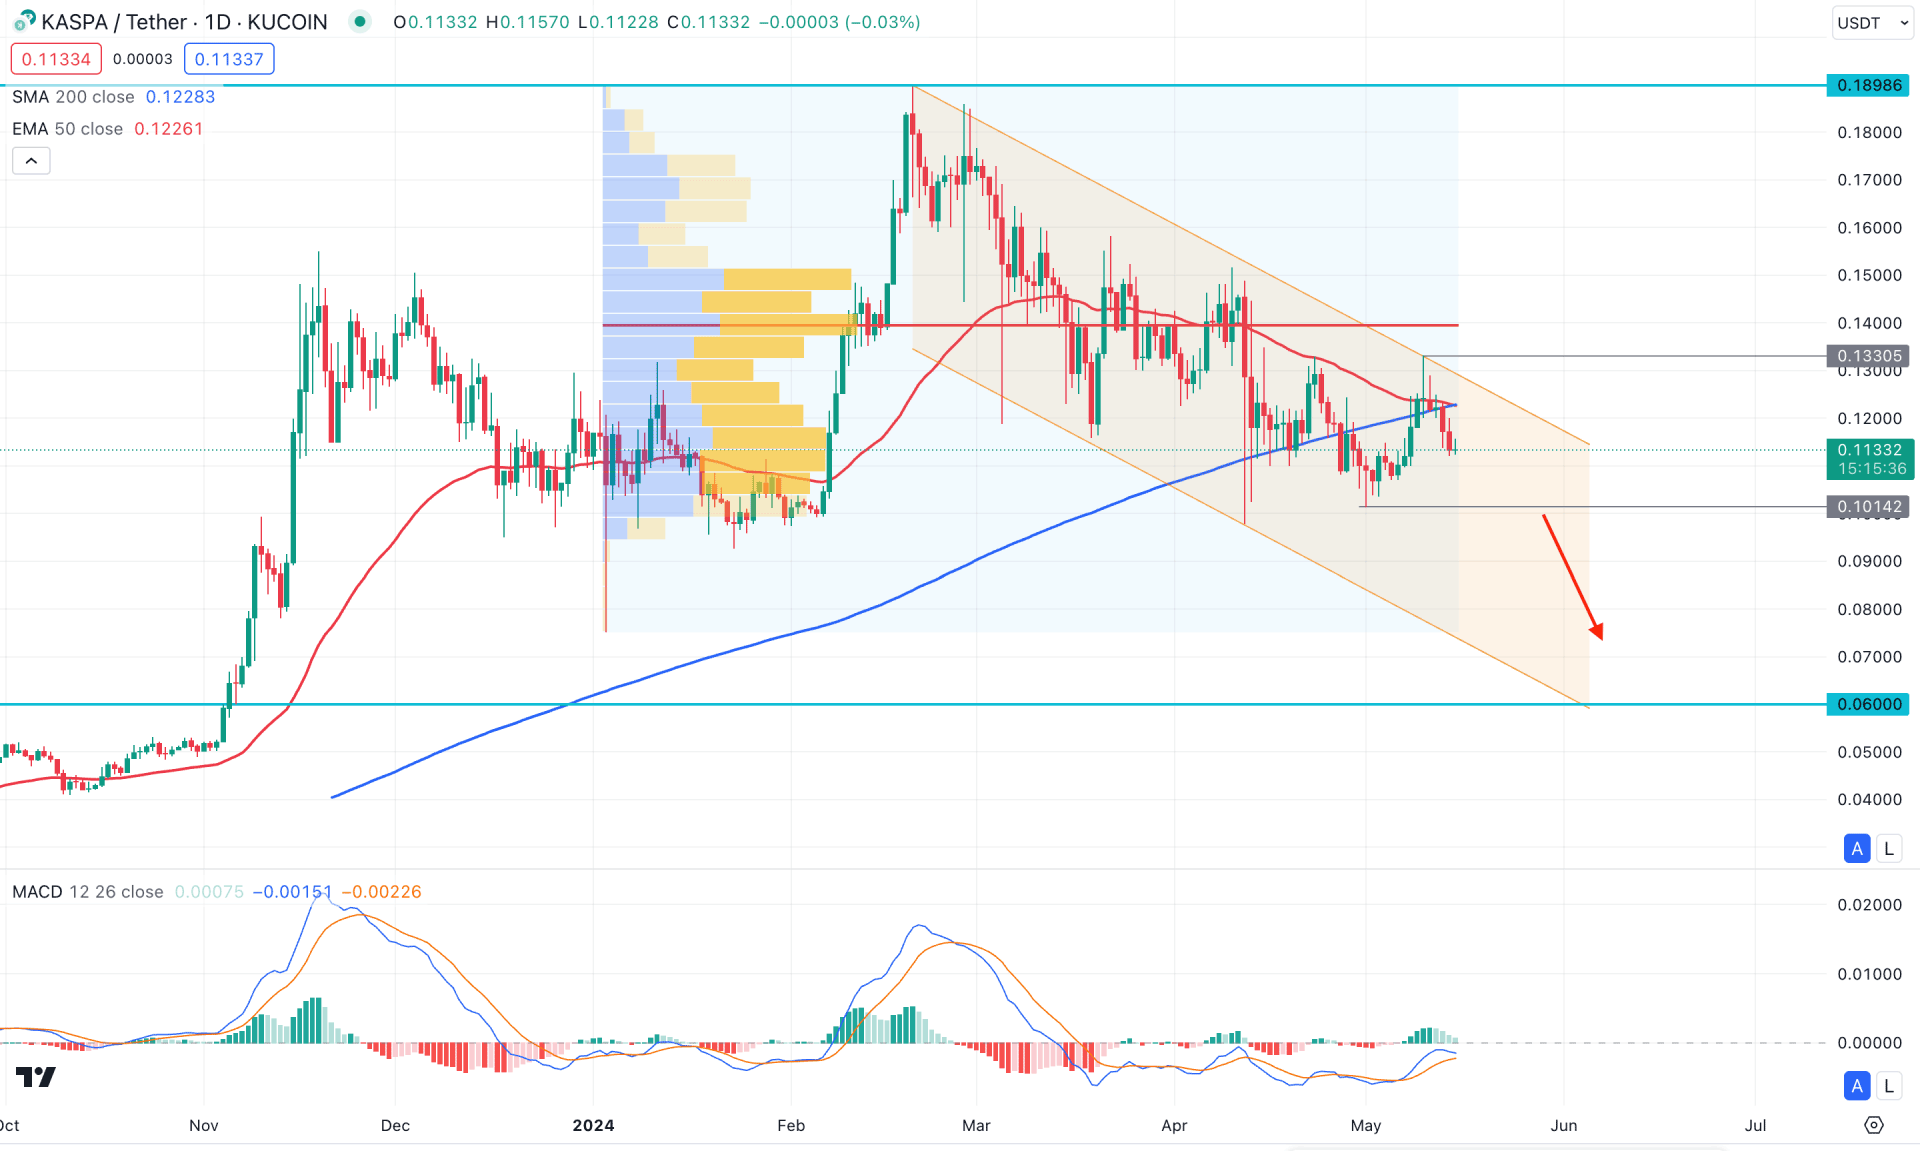
In the daily chart of KAS/USDT, the broader market outlook is bearish as the current price shows a selling pressure below the 50-day Exponential Moving Average. However, the descending channel formation is in play, which might create a long opportunity, after a valid breakout.
In the higher timeframe, the price showed a strong bullish monthly candle in February, suggesting a strong upward continuation. Later on, a selling pressure was seen in March and April, where the February low is still protected. Moreover, the weekly price shows an extreme corrective momentum after the impulse, suggesting a potential bullish opportunity after a valid price action.
In the volume structure, the largest activity level since the beginning of 2024 is at 0.1395 level, which is above the current price. Based on this outlook, the bullish momentum seen in February 2024 might resume after validating the high volume level. As the recent price hovers below the high volume line, we may expect the bearish pressure to be valid.
In the main price chart, the most recent price formed a swing high at the 0.1330 level before moving below the dynamic 50-day Exponential Moving Average line. Moreover, the 50-day EMA tapped into the 200-day SMA line, where a valid downside cross could signal a death cross.
In the indicator window, the MACD Histogram reached the neutral level after forming a top, suggesting a potential selling pressure. Moreover, the signal line failed to move above the neutral line, suggesting an additional bearish signal.
Based on the daily outlook of KAS/USDT, investors should closely monitor how the price trades above the 0.1014 swing low. As the descending channel formation is active, a bearish daily candle below this swing low could create a high probable bearish opportunity, targeting the 0.0600 psychological line.
On the bullish side, the first bullish signal might come from the valid channel breakout with a bullish daily close. Moreover, an upward continuation with consolidation above the 0.1395 high volume level could be a conservative long opportunity, targeting the 0.2000 psychological level.

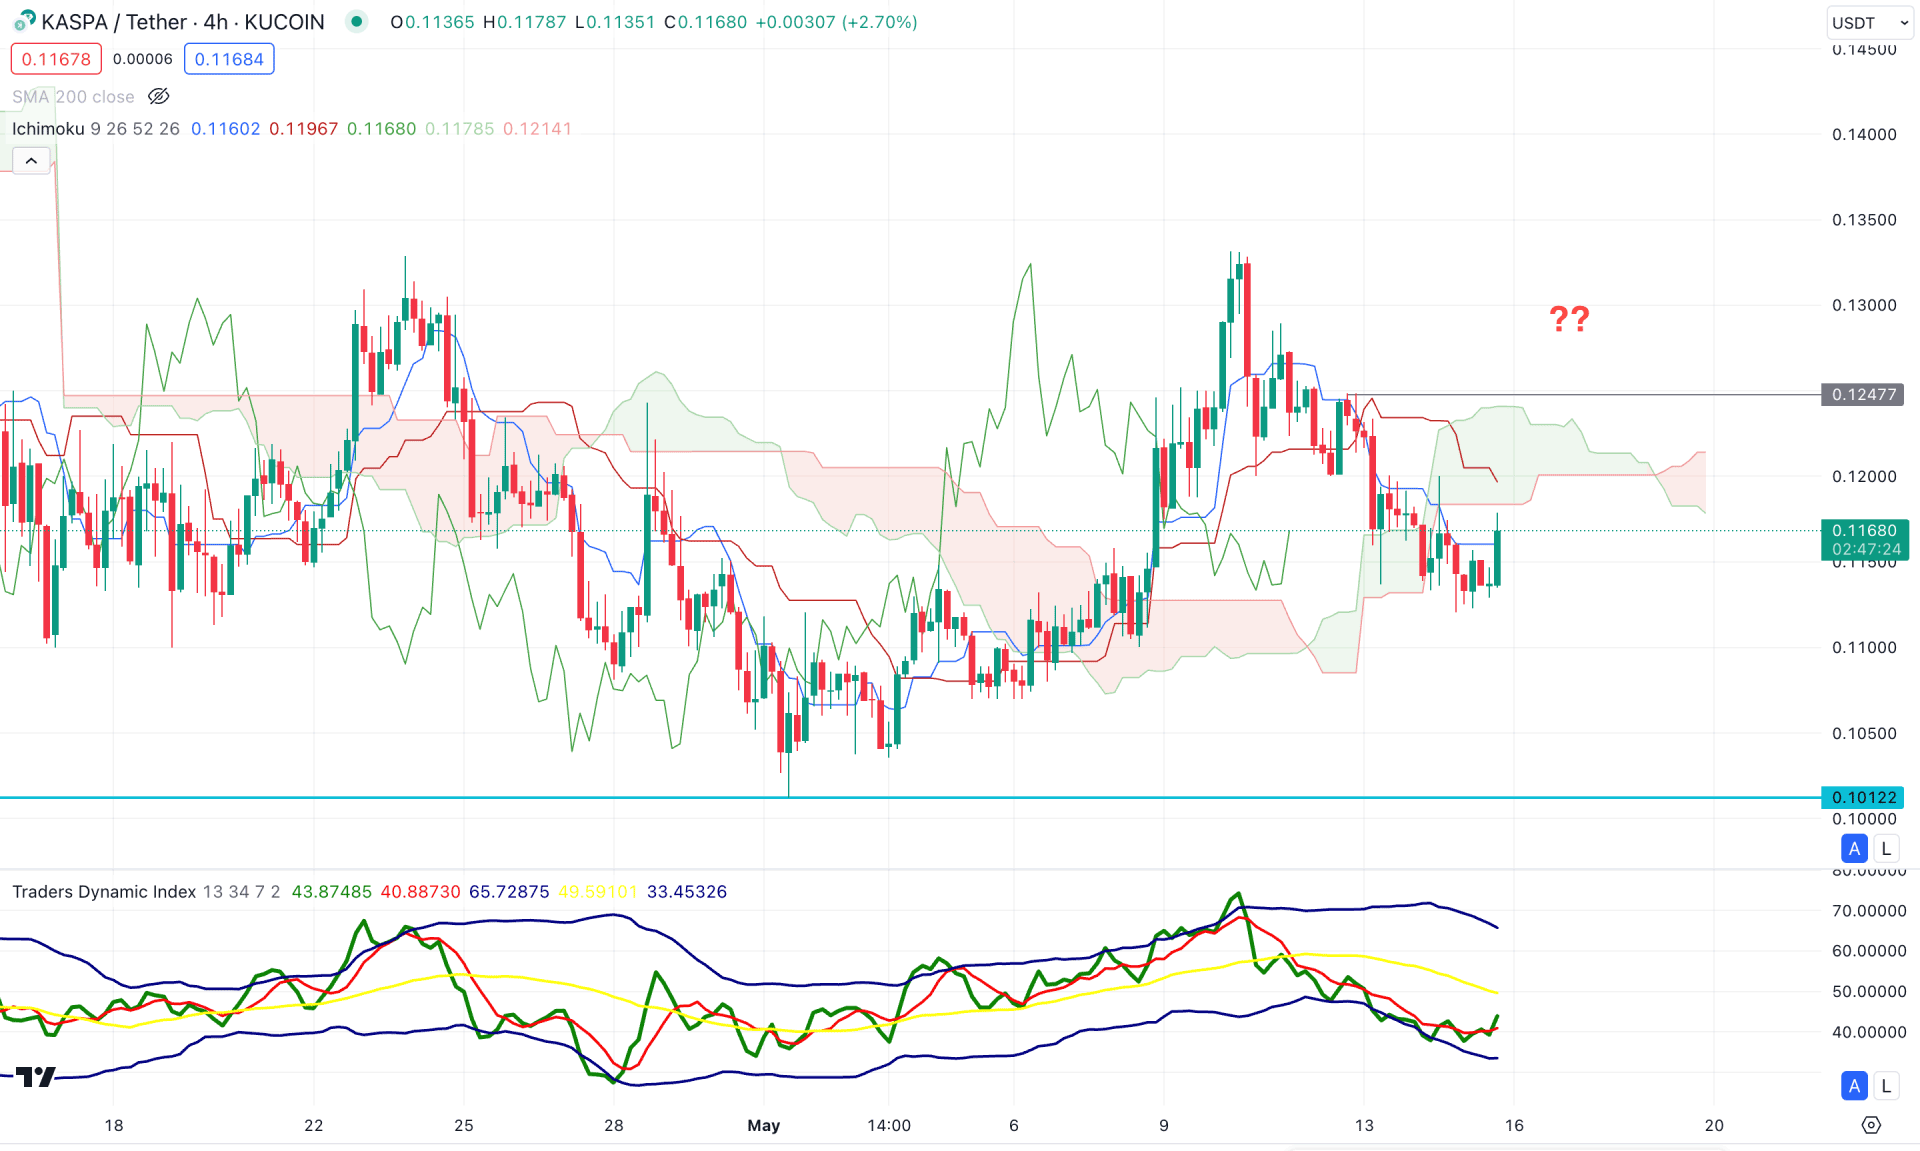
In the H4 timeframe, the current price trades below the dynamic Ichimoku Cloud zone, suggesting a bearish continuation. However, the most recent price became sideways below the cloud resistance, signaling a struggle to hold the bearish momentum. In the future cloud, the downside pressure is active as the Senkou Span A is below the B.
In the secondary window, the Traders Dynamic Index (TDI) found a bottom 37.16 level and formed a valid rebound. An upward extension above the 50.00 line in the TYDI could be an additional bullish signal.
Based on the H4 structure, an upward continuation with an H4 close above the 0.1247 level could be a potential long opportunity, targeting the 0.1450 level. On the other hand, any bearish rejection from the dynamic Kijun Sen line could signal a bearish continuation, targeting the 0.1012 level.

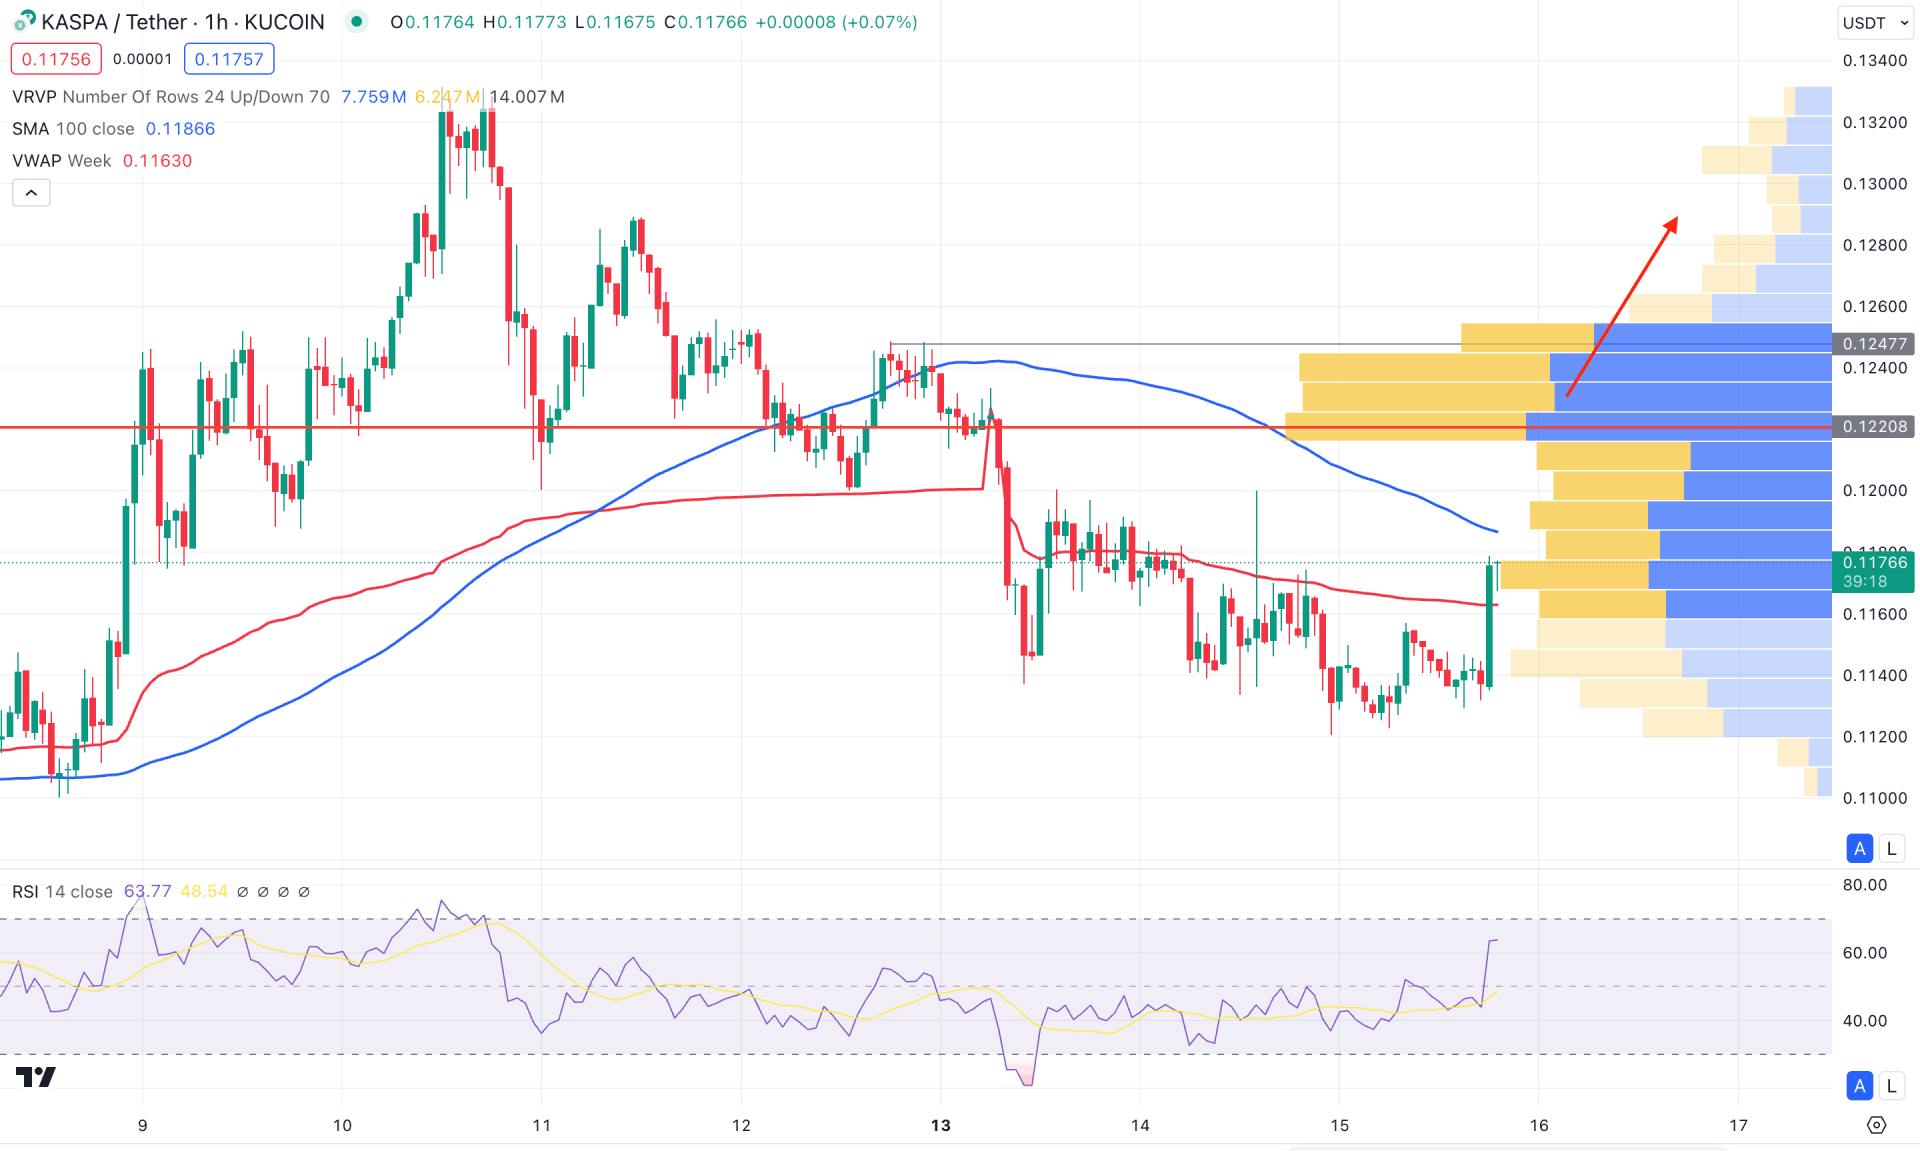
In the hourly chart, a strong buying pressure is visible in the most recent price, while the visible range high volume level is still above the current price. Moreover, the 200 Simple Moving Average is above the current price, working as a crucial resistance.
In the indicator window, an ongoing buying pressure is visible as the current RSI shows an upward pressure above the neutral 50.00 level.
Based on the hourly price prediction, a bullish continuation with an hourly close above the 0.1220 high volume level could validate the long opportunity, targeting the 0.1400 level. However, a failure to hold the price above the 200 SMA line with a bearish reversal could be a bearish opportunity, targeting the 0.1100 level.
Based on the current market outlook, KAS/USDT has a higher possibility of showing a bullish continuation, where a valid breakout in the intraday price could be a high probability of a long opportunity. However, the long-term trend is still bearish, and a valid bottom formation in the daily chart is needed to form a bull run.