
Published: June 24th, 2025
Kaia (KAIA) rose 85% from the lowest point of this year to a peak of $0.200. With a market valuation of more than $1.15 billion, it has been close to its highest level since January.
Because more assets are being invested in its DeFi apps, Kaia's price has increased. At $117.8 million, its total worth locked increased by 20% over the previous seven days and by 45% over the past 30 days.
Hundreds of millions of people in Asia may now access Web3 thanks to Kaia, an exceptionally well-publicized blockchain. With over 250 million users across the Kakaotalk and LINE messengers, Kaia is Asia's biggest Web3 ecosystem.
It was created by combining the Klaytn and Finschia blockchains, which were first developed by Kakao and LINE, respectively. Users can communicate, produce, collaborate, and bring value to the ecosystem using Web3 with the simplicity and rapidity of Web2 within their preferred messenger superapp.
The majority of dApps in the Kaia ecosystem, such as Lair Finance, Neopin, KlaySwap, and DragonSwap, saw their assets increase by 40% over the previous 30 days, coinciding with this boom.
Additionally, Kaia's stablecoin supply increased to almost $41 million, of which 60% came from Tether (USDT). Considering that its integration only started in May, USDT's quick rise on Kaia is noteworthy.
Let's see the further price direction from the KAIA/USDT technical analysis:
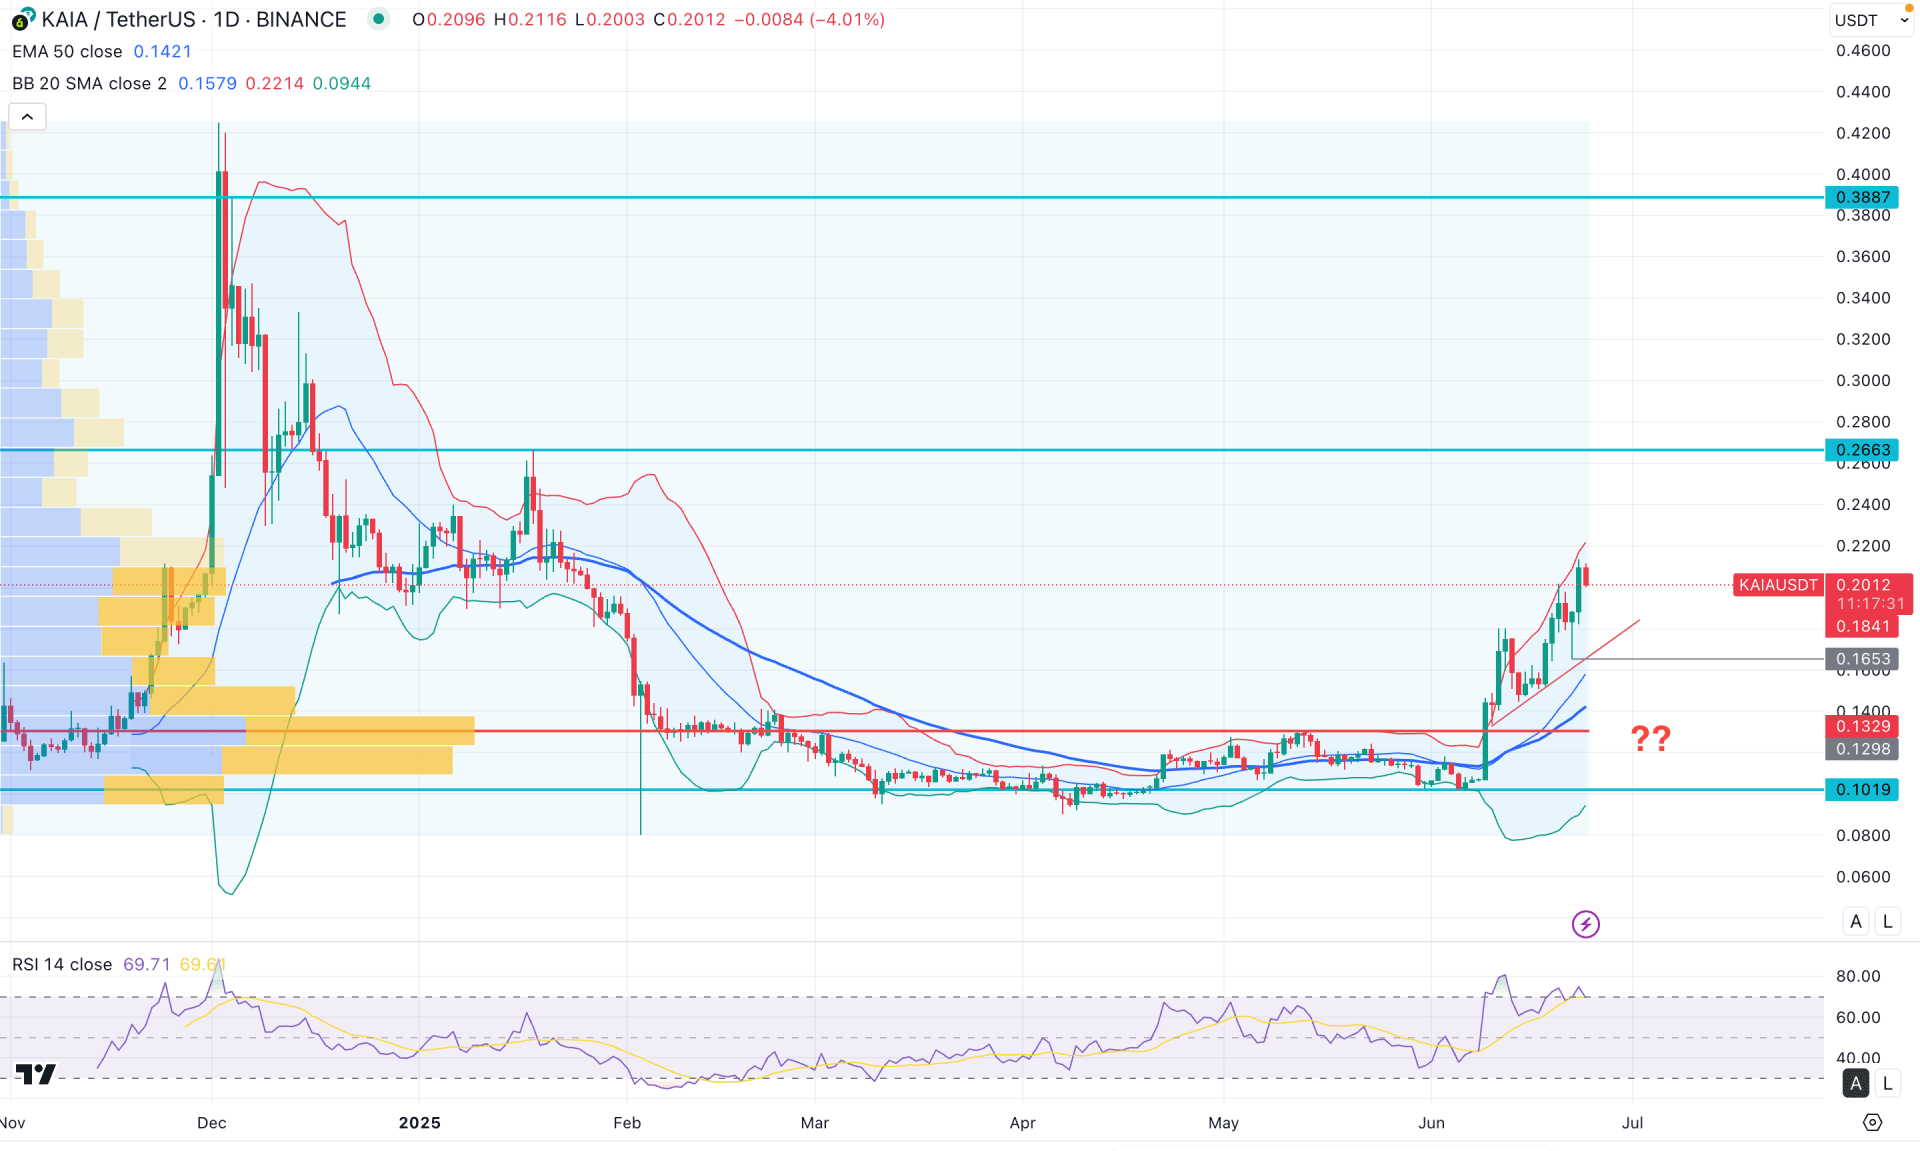
In the daily chart of KAIA/USDT, the recent price action showed a decent recovery from the bottom, reaching a 4-month high. As no significant selling pressure is visible at the top, investors might anticipate a bullish continuation once the current downside correction is completed.
On the higher timeframe, the sideways phase appears to be over, as the price has formed a strong bullish monthly candle following a 2-month consolidation. As long as the bullish momentum remains intact, further upward movement is likely. As the monthly close approaches, investors should closely monitor how the price ends the month, as a downside retracement is still pending from the weekly perspective.
In the volume structure, the price is trending upward, with bulls maintaining control since inception. As long as the price remains above the 0.1298 high, we may expect the bullish continuation to persist.
On the main price chart, the current bullish move has encountered resistance near the upper Bollinger Band. This suggests a possible short-term downside correction, even though the broader market trend remains bullish.
In the secondary indicator window, the Relative Strength Index (RSI) has moved above the 70.00 overbought level and is showing signs of bearish divergence. However, the RSI remains above 70.00; a confirmed downside correction would require a decisive drop below the 60.00 level.
Based on the daily market outlook, the ongoing bullish trend could continue after a corrective pullback. The current price is facing resistance, which could present short-term bearish opportunities. However, a bullish rebound from the mid-Bollinger Band support could offer a high-probability long entry, targeting the existing all-time high.
An alternative trading approach would be to watch for a bullish breakout above the upper Bollinger Band, or a recovery from below the 0.1653 swing low. In that scenario, a bearish opportunity might emerge, with the ultimate target set at the psychological level of 0.1000.
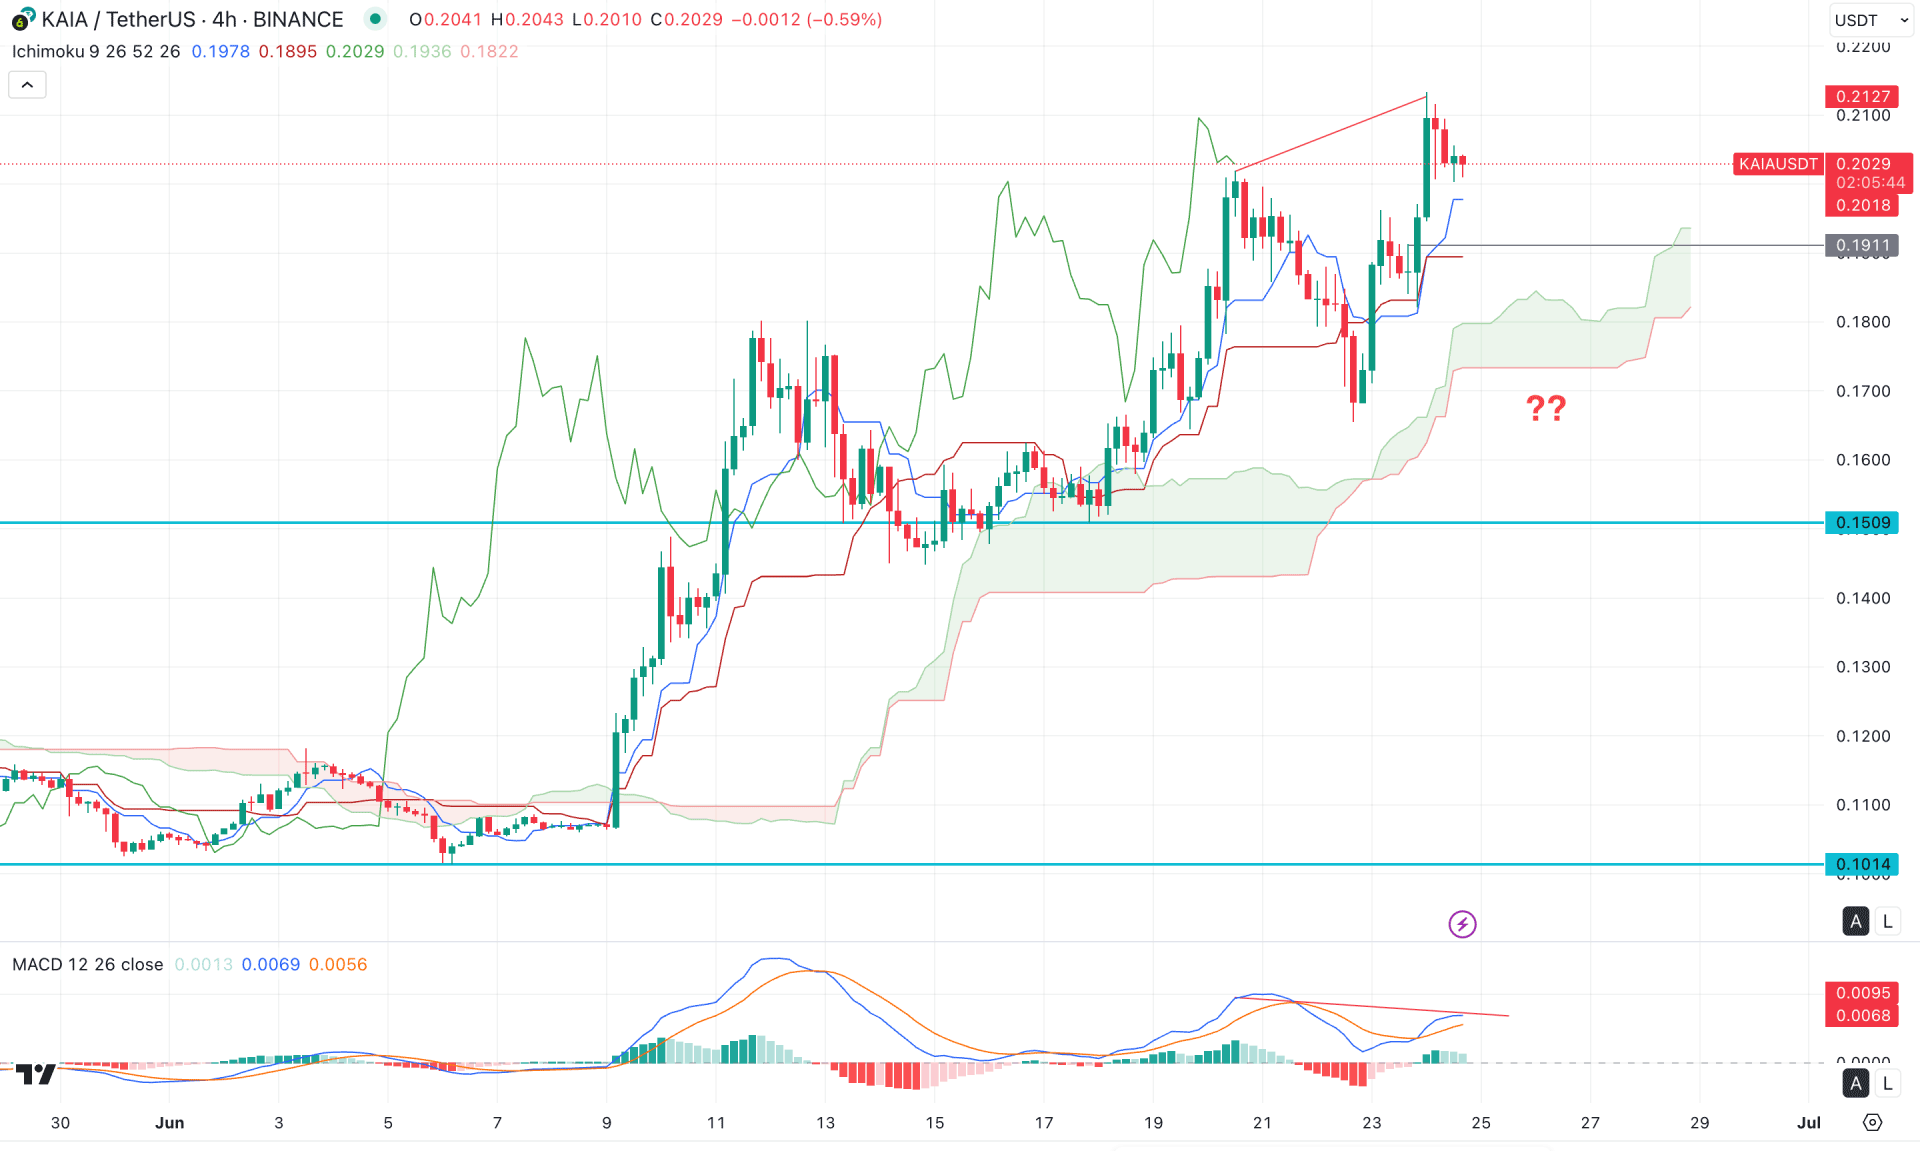
Based on the four-hour market outlook, the ongoing price action is bullish, as the recent price is holding momentum above the Kumo cloud level. The future cloud also looks positive, with both Senkou Span A and B lines heading upwards, signaling a potential bullish continuation.
In the secondary indicator window, the MACD histogram has moved near the neutral line, indicating the introduction of selling pressure in the market. Following this sentiment, the MACD signal line has formed a bearish crossover at the ceiling, suggesting a possible top formation in the intraday market.
Despite the bearish signals, the broader bullish stance may remain intact even if the price experiences a temporary decline. Primarily, we may anticipate a short-term correction if there is a bearish H4 candle close below the 0.1911 level. The ongoing divergence with the MACD indicator, along with weak price action below the dynamic level, could create a short-term bearish opportunity, with the main aim of testing the 0.1509 level.
On the other hand, the bullish approach would be to look for a price dip below the 0.1600 level, followed by a rebound above the Kumo cloud. In that case, the price might resume its existing bullish momentum, targeting the 0.2200 area.
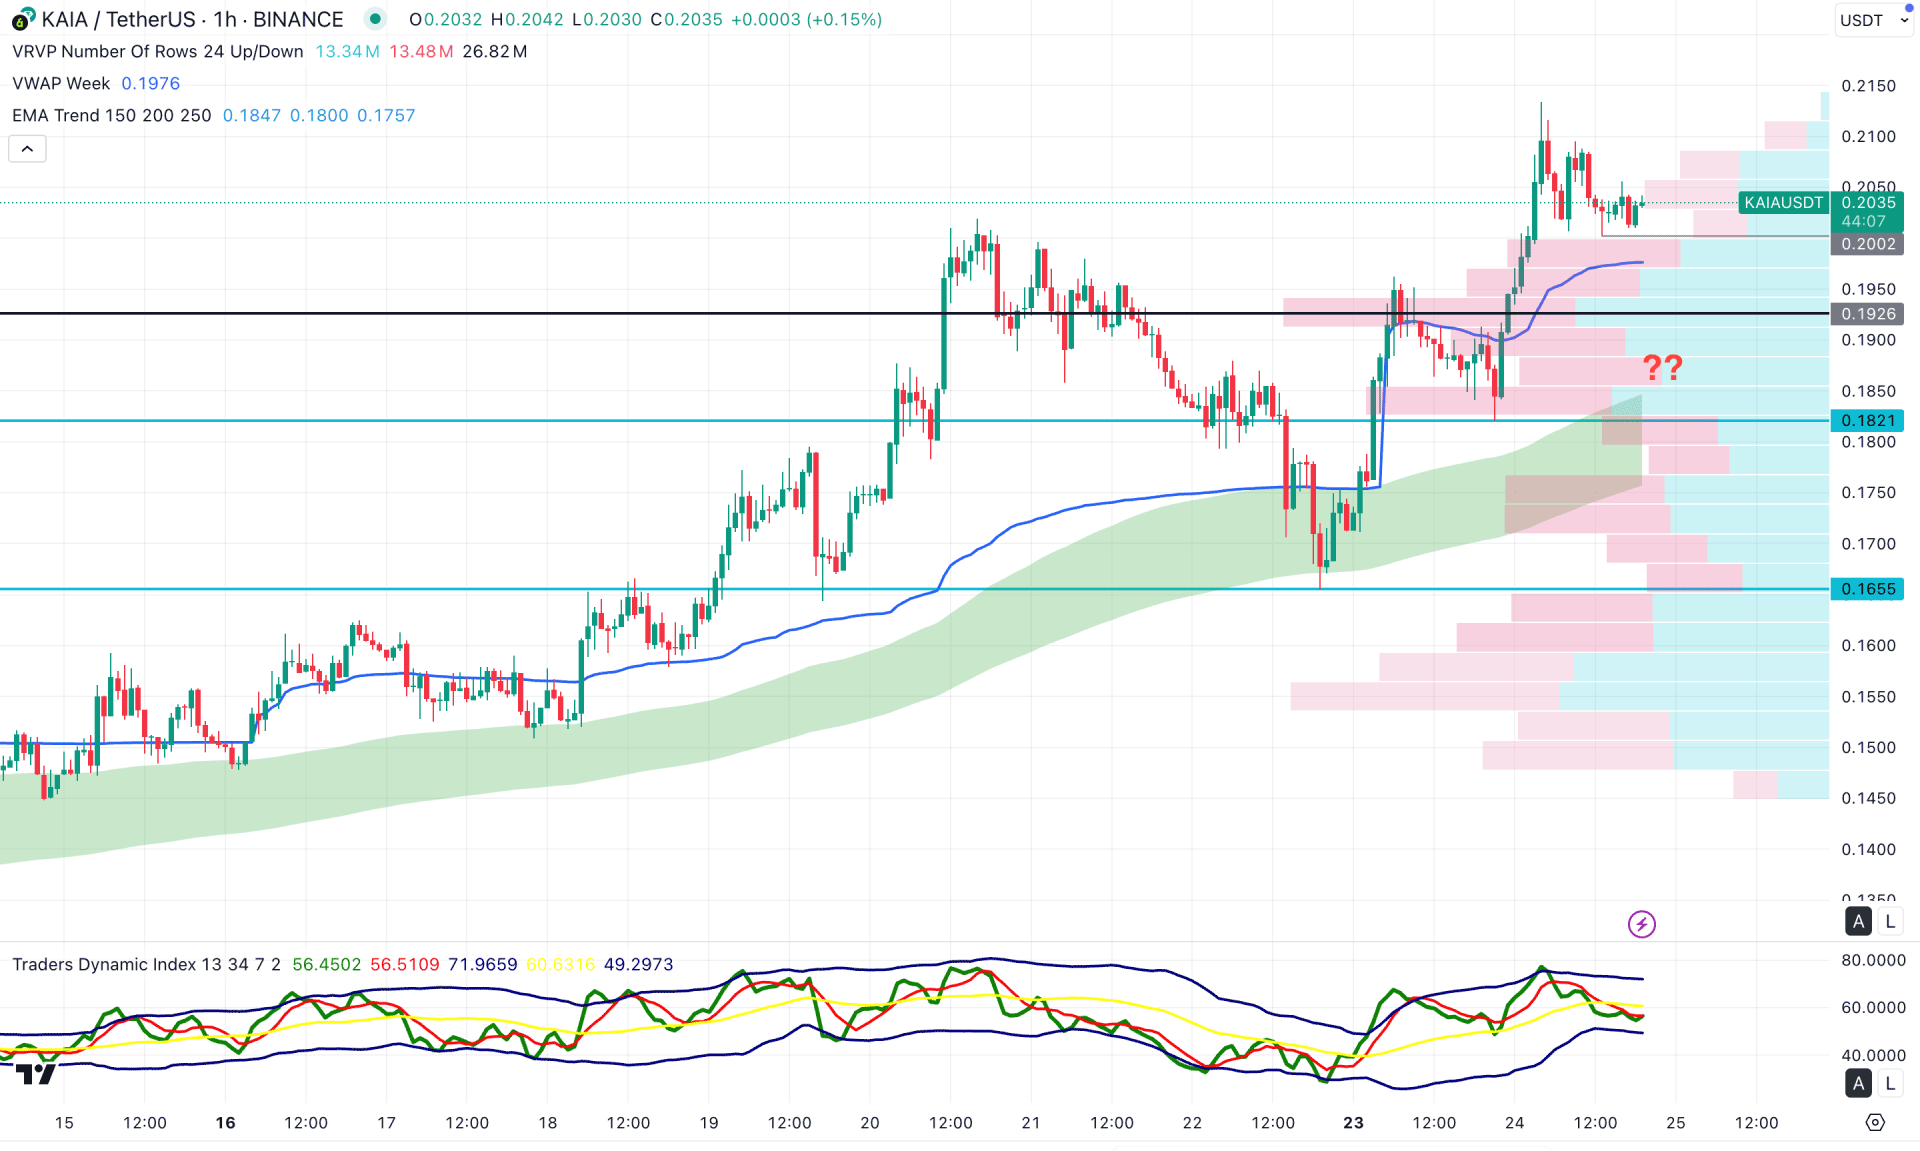
In the early timeframe, the recent price is trading higher after forming a bottom at the 0.1655 level. As the price moves sideways following the creation of a new swing high, investors should monitor how it reacts at the weekly VWAP level. Primarily, the broader momentum remains bullish as long as the 0.1926 high stays below the current price.
Moreover, the moving average wave is trending upward and currently acting as a major support above the 0.1821 level. On the other hand, the Traders Dynamic Index (TDI) has flipped downward and reached the lower band area, from where a bullish crossover bar could validate a potential long opportunity.
Based on the overall market outlook, a downside move below the 0.2000 level followed by a bullish rebound from the VWAP line would be a primary long setup, targeting the 0.2200 level.
Alternatively, an immediate short opportunity may arise if the price fails to sustain buying pressure above the VWAP level. In that case, a bearish engulfing candle below the 0.1900 level could provide a temporary short setup, targeting the 0.1655 level. However, a break below the 0.1655 level could serve as a warning sign for bulls, as the price might revisit the 0.1400 area before forming a potential rebound.
Based on the broader market outlook, KAIA/USDT is trading with bullish momentum, as the recent price action has shown a strong breakout from a ranging market. While a new swing high has been confirmed, a considerable downside correction is likely before a valid bullish continuation signal forms.


