
Published: October 29th, 2025
With one of the biggest perpetual exchanges, Jupiter is a major participant in the Solana ecosystem. In recent months, it has introduced several solutions, including a projection platform in partnership with Kalshi and a financing network with assets exceeding $800 million.
Jupiter's price has increased by almost 14% in the last week, and I've watched it make headlines. This comes after the market for its forecast beta was announced. For starters, the team's projected waste of 121 million JUP coins is valued at around 42 million, and Jupiter's Q3 revenue jumped to $45 million.
Add to that the excitement surrounding the November launch of Jupiter's new ICO system on Solana. It is now evident why both long-term and short-term investors are closely monitoring this initiative.
Let's see the complete price projection for this coin from the JUP/USDT multi-timeframe analysis:
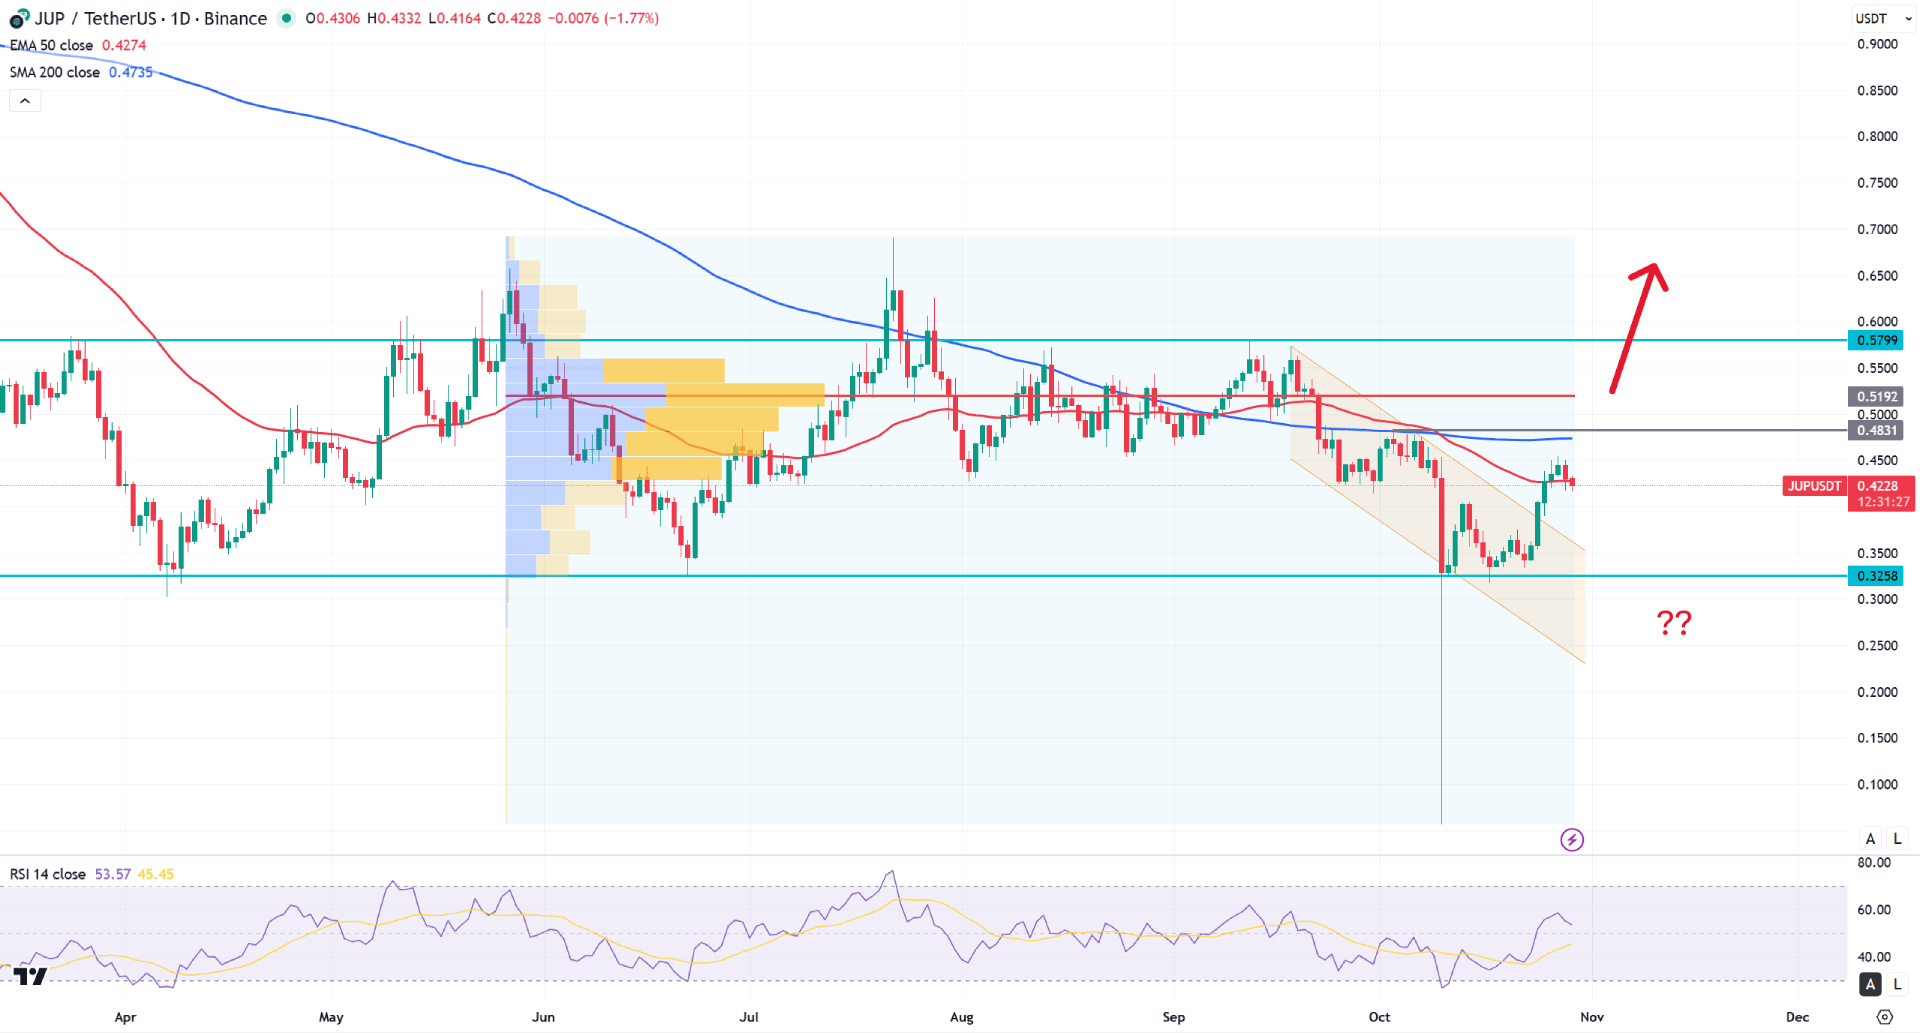
In the daily chart of JUP/USDT, the recent price shows massive exhaustion after wiping out the liquidity from the record low level. Later on, the price demonstrated an immediate bullish recovery with stable momentum above the 0.3500 level. As long as the price remains sideways above this crucial line, the primary anticipation for this pair would be to look for long opportunities.
In the higher timeframe, the price has been moving sideways for a considerable period. Later, a liquidity sweep from the 0.389 level signalled a strong exhaustion. The monthly chart shows a clear sign of buying pressure — a close above the 0.4818 high would be a crucial confirmation for buyers.
On the weekly chart, a bullish engulfing pattern is visible, with the current price testing the 0.4382 weekly resistance. As long as the price holds above this significant high, a bullish continuation remains possible.
In the main price chart, a descending channel breakout is underway, while the 50-day Exponential Moving Average serves as a crucial dynamic barrier. Currently, the price is trading below both the 200-day Simple Moving Average and the 50-day EMA. In this case, a short-term downside correction could occur to validate the recent breakout.
In the indicator window, the Relative Strength Index (RSI) is positioned above the 50.00 line, with more room to move toward the 70.00 overbought area.
Based on the overall market structure, there are multiple barriers to monitor before entering a long position. The primary high-volume line is located near the 0.5192 level, which needs to be broken before targeting the 0.6000 area.
On the other hand, a failure to extend the buying pressure could allow bearish momentum to resume toward the psychological support level.
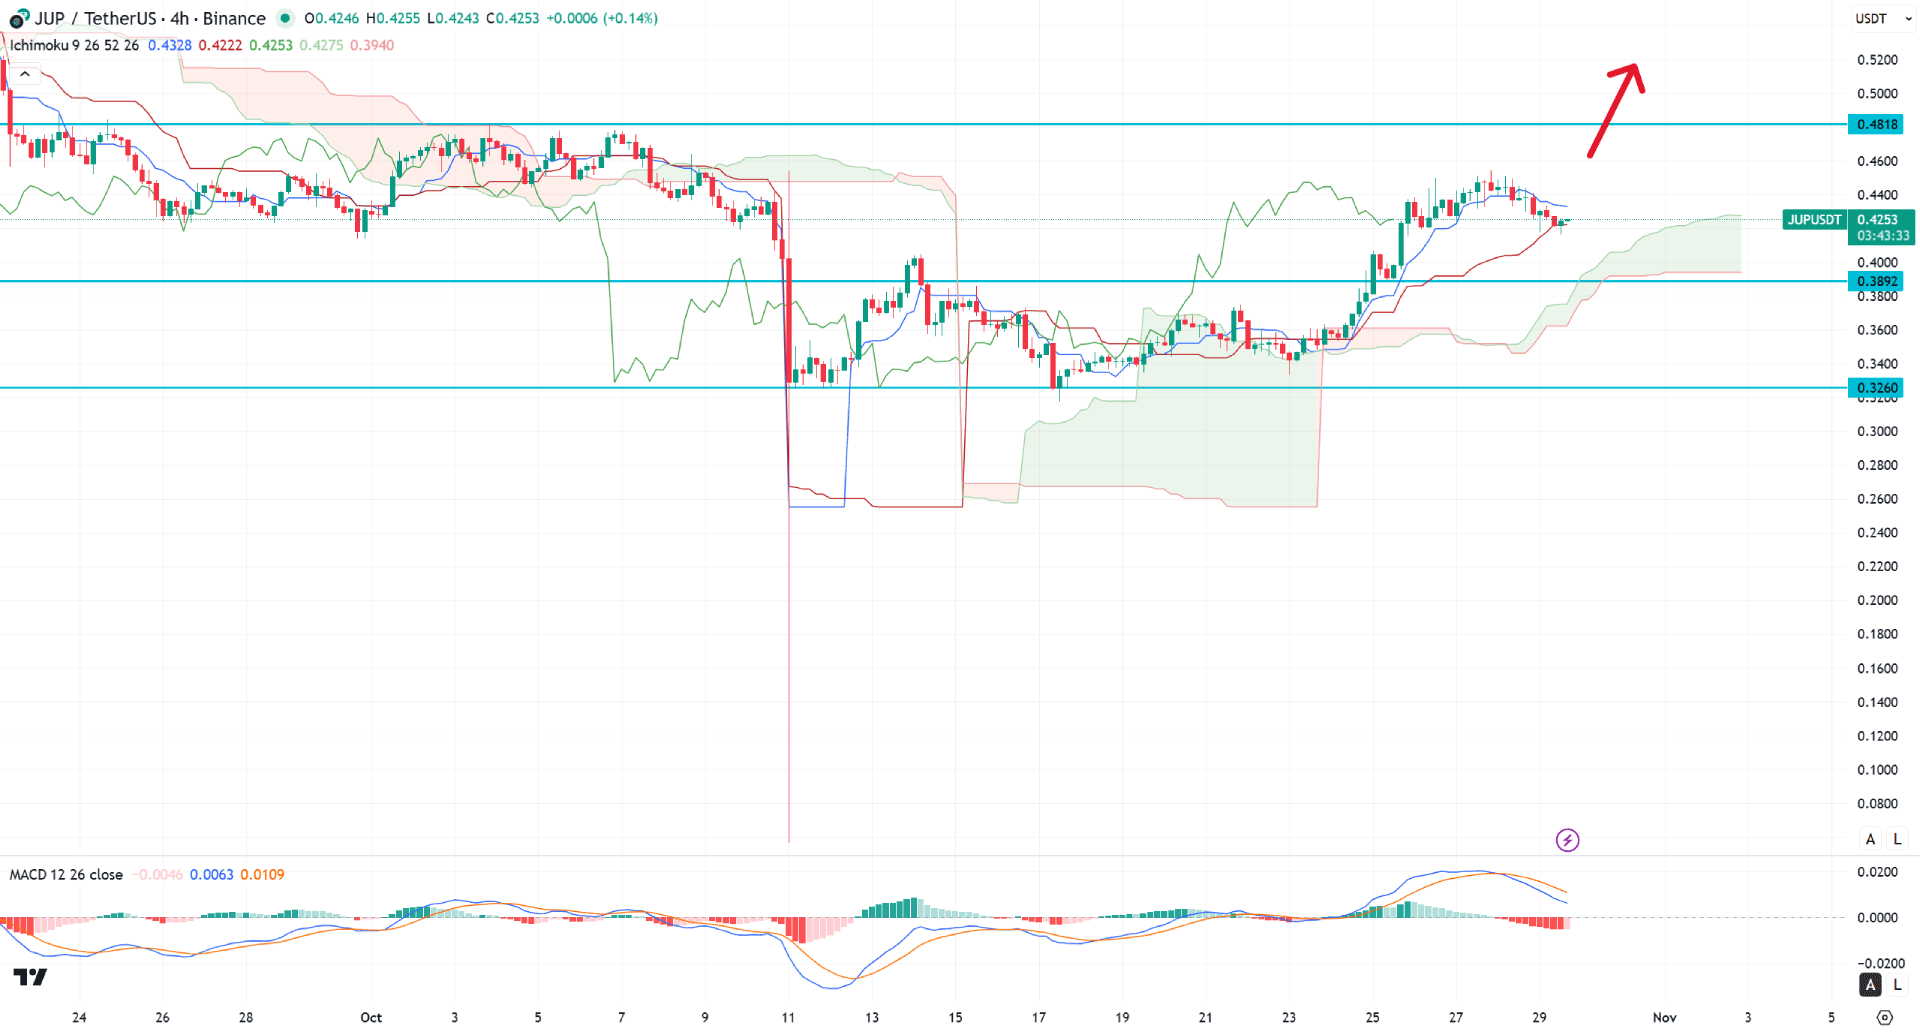
In the four-hour timeframe, the ongoing price action remains bullish, as the recent price is trading higher above the Ichimoku Cloud area with strong continuation momentum. Primarily, the price is expected to hold its buying pressure above the near-term dynamic support level, signalling a potential bullish continuation opportunity.
In the future cloud, both the Senkou Span A and Senkou Span B lines are heading upward with a wider gap, indicating a strong bullish continuation signal.
In the indicator window, the MACD histogram failed to sustain the bearish momentum and rebounded from the bottom. Moreover, the signal line is hovering above the neutral zone, indicating a bullish crossover.
Based on this outlook, a bullish continuation is likely, with a rebound from the dynamic Kijun-sen providing a long opportunity targeting the 0.5000 level.
On the other hand, a bearish continuation with a confirmed H4 close below the 0.3892 level might trigger a minor downside correction, targeting the 0.3260 area.
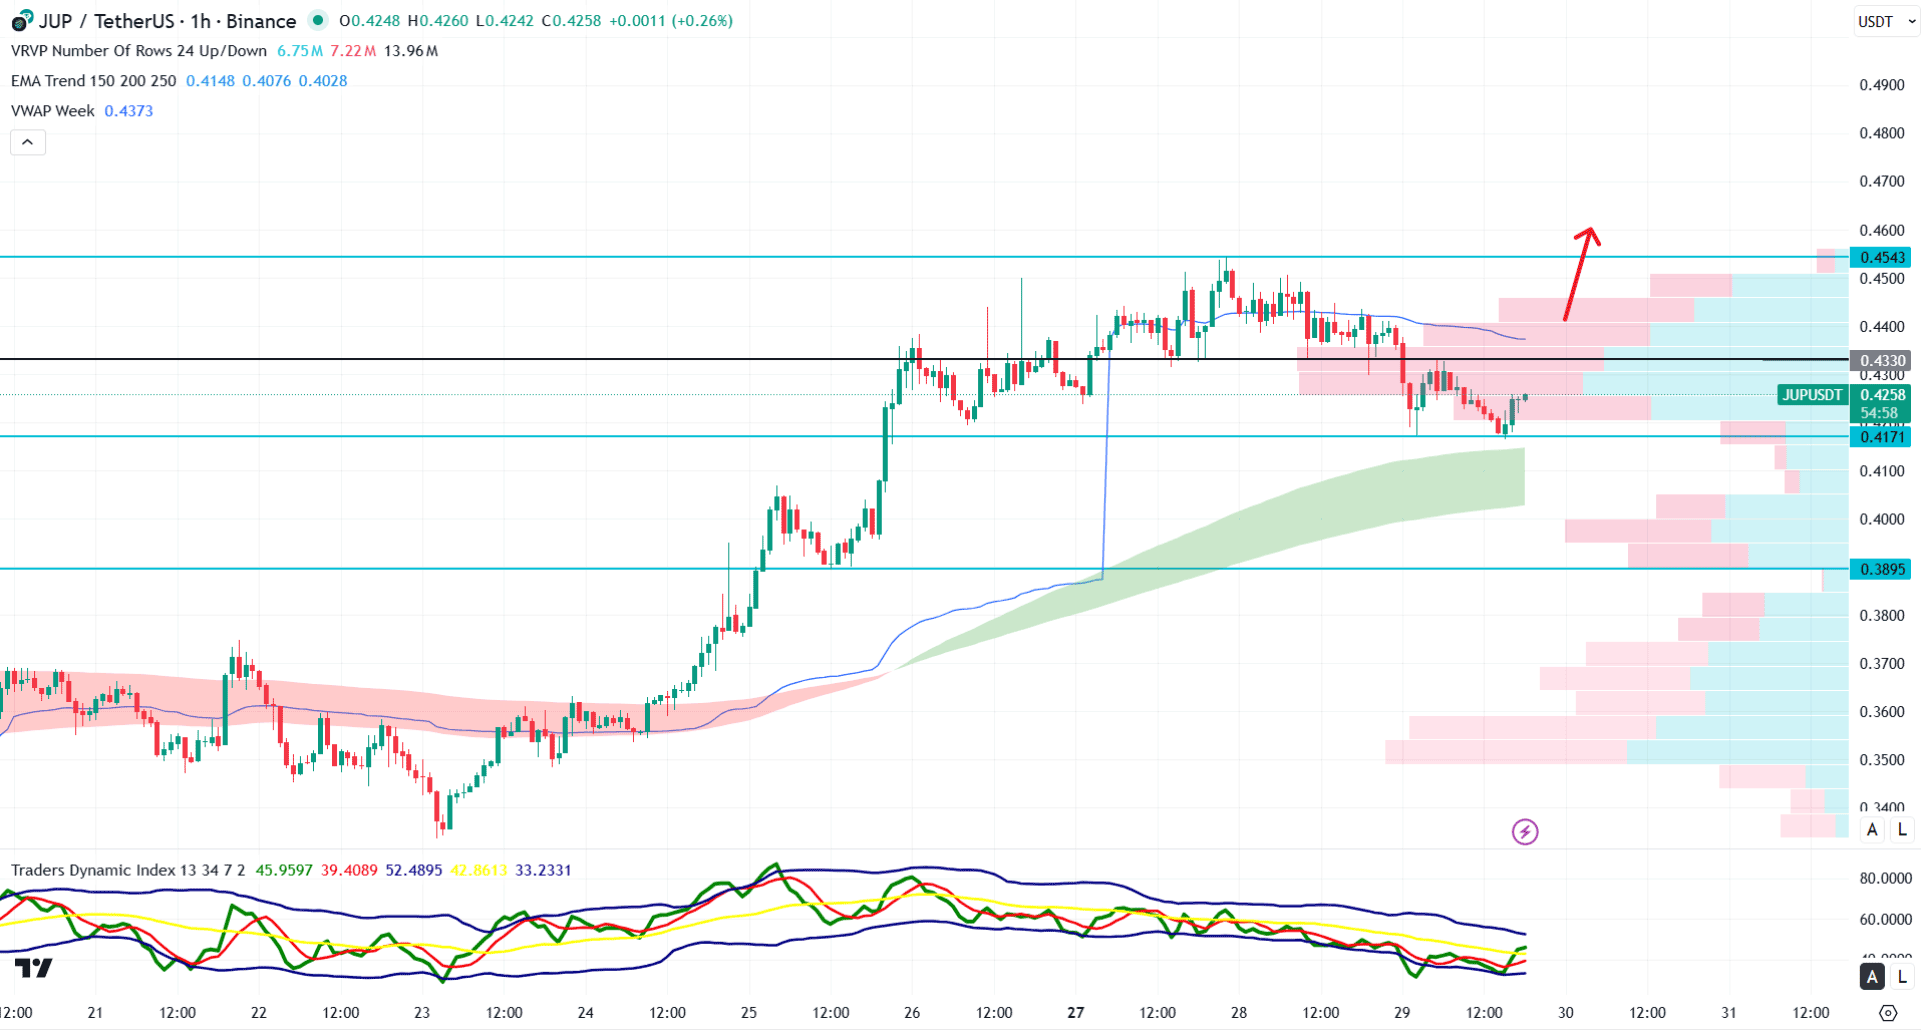
In the hourly timeframe, the JUP/USDT price is trading within a corrective momentum, with the recent intraday high volume line at the 0.4130 level. Primarily, the current price is trading below the high volume line, and a valid bullish recovery is pending before opening a long position.
On the other hand, the Exponential Moving Average wave is providing immediate support, with a strong barrier on the downside.
In the indicator window, the Traders Dynamic Index has rebounded above the 50.00 neutral line, which suggests a potential bullish recovery.
Based on this market outlook, a bullish continuation is likely for the JUP/USDT price, with an hourly close above the 0.4330 line a highly probable long opportunity targeting the 0.5000 area.
On the other hand, a downside recovery with a bearish H1 candle below the 0.4100 level might extend the loss and find support from the 0.3895 level.
Based on the overall market structure, JUP/USDT is trading in a bullish momentum, with a valid downside recovery pending from the channel breakout. As sellers' are already wiped out from the exhaustion, a potential upward pressure might come from the intraday confirmation.


