
Published: October 11th, 2022
Since the second half of 2021, the same has turned around since starting this year after witnessing the normalization of trading activities. In this way, in the third quarter of 2022, JPMorgan’s trading revenues have been dazzling, as expected. Thus, the market revenue supported its earnings by compromising almost 20% of the company's total revenue before the opening bell, scheduled to be published on 14 Oct.
Daniel Pinto, the company COO, stated that fixed-income trading volume benefitted from mitigated depreciated equity trading and life market volatility. The market revenues of the bank are expected to gain nearly 5% year over year. Our estimated matric remained at $6.6 billion, a rise of 5.3%.
Market revenues of JPM are accounted for in the Corporate & Investment Bank segment. The total revenue estimation of $11.83 billion, as per analysts' expectations. Moreover, the higher interest rate is a bullish factor for JPMorgan & Chase stocks, as higher interest rates influence investors to deposit more money in the bank to grab a higher return.
Is JPMorgan Chase & Co stock a buy? Let’s see the future price of JPMorgan Chase & Co from JPM Technical analysis:
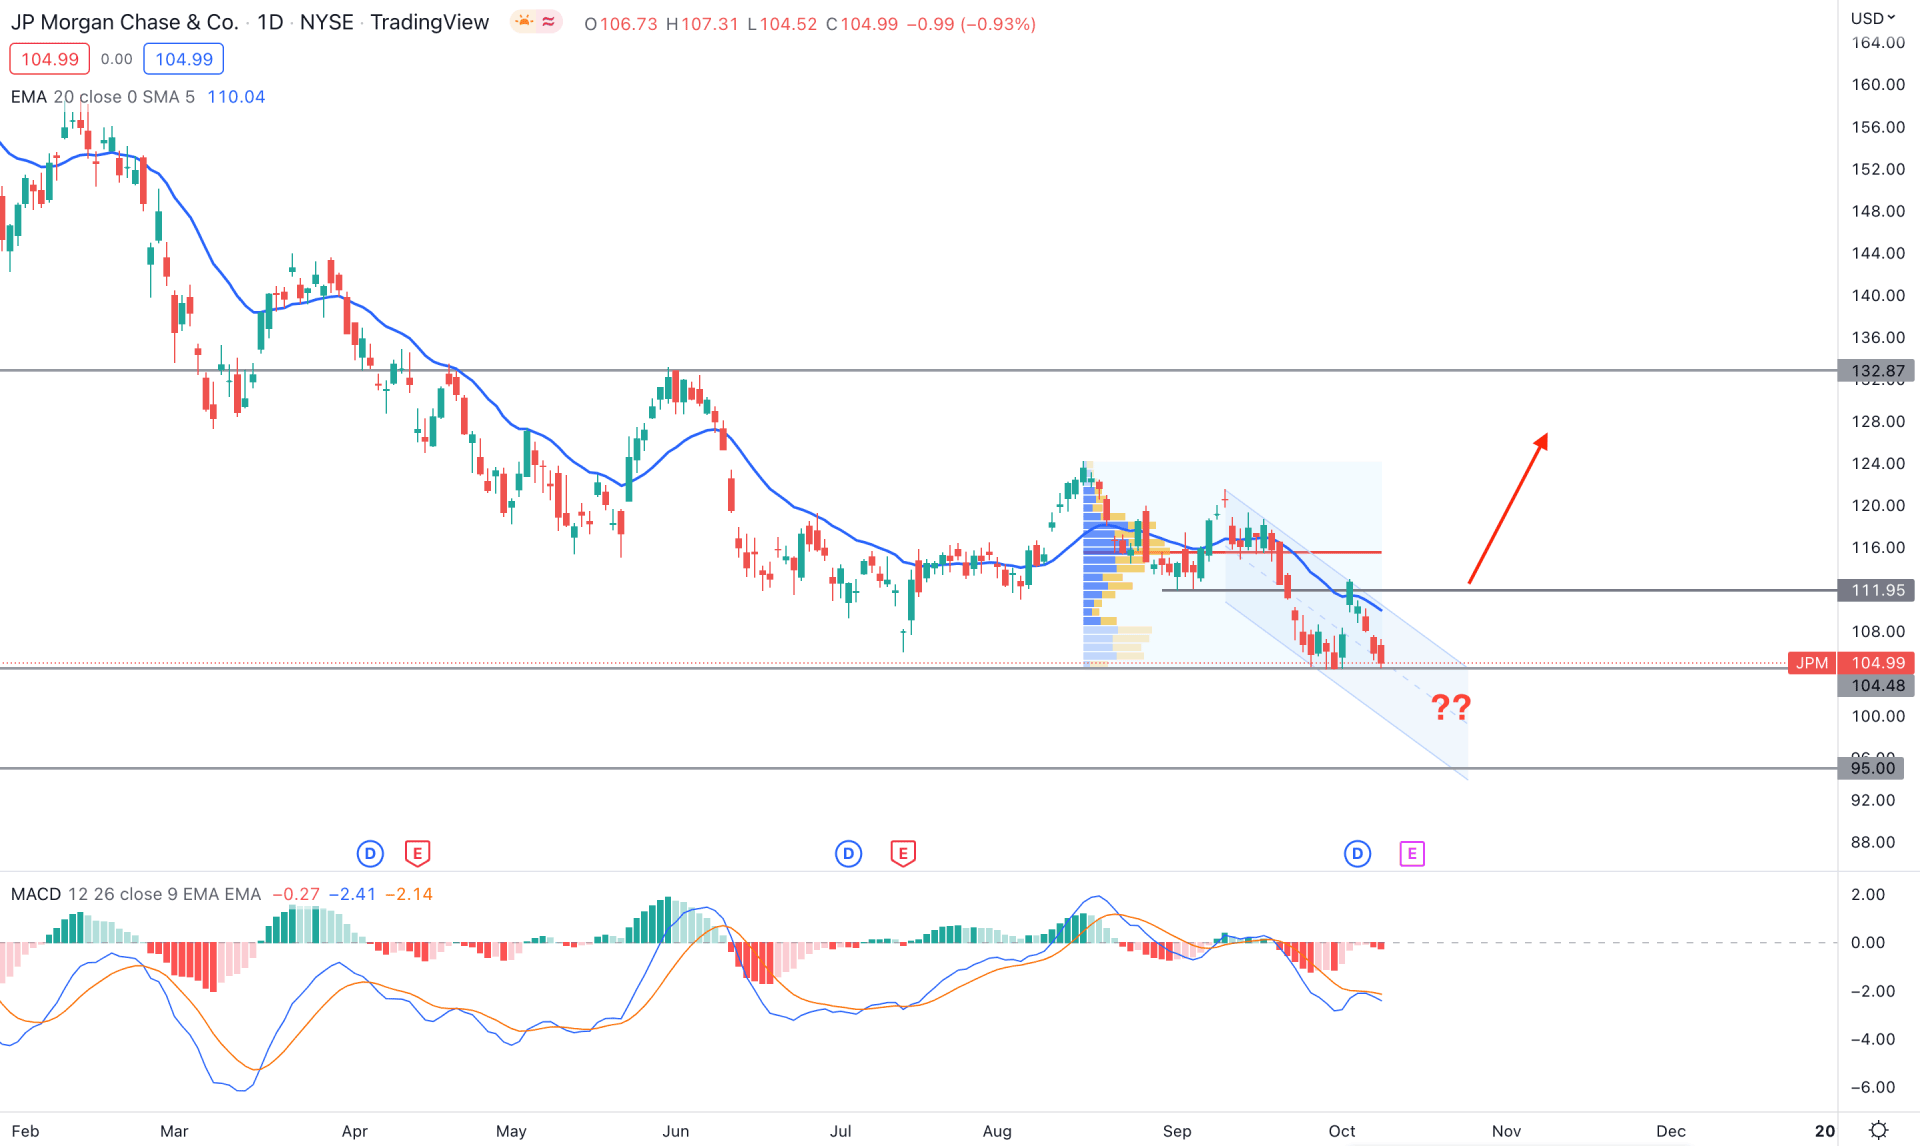
In the daily chart of JPM, the broader market trend is bearish as the price is trading 38% down from the yearly opening. Moreover, there were multiple lower lows and lower highs in the path, which provided multiple bearish trend trading opportunities.
In the latest swing from the August 2022 high to September 2022 low, the highest trading volume level is spotted at 115.58. It is clearly visible that the marked high volume level is above the current price, signaling a sellers’ presence in the market from the 115.68 to 121.58 area. Therefore, as long as the price trades below the 115.68 area, the bearish pressure may extend until a new high-volume area comes with a bullish daily candle.
The dynamic 20 DMA is above the price and working as an immediate resistance level besides the 111.95 static level. The indicator window shows a corrective price pressure from MACD, where the MACD Histogram is below the 0.0 neutral line.
Based on the daily price of JPM, a selling pressure with a daily close below the 95.00 key support level would open a bearish opportunity toward the 95.00 level.
The alternative approach is to wait for the channel breakout and have a daily candle close above the 20 DMA. In that case, the buying opportunity is valid towards the 132.87 resistance level.
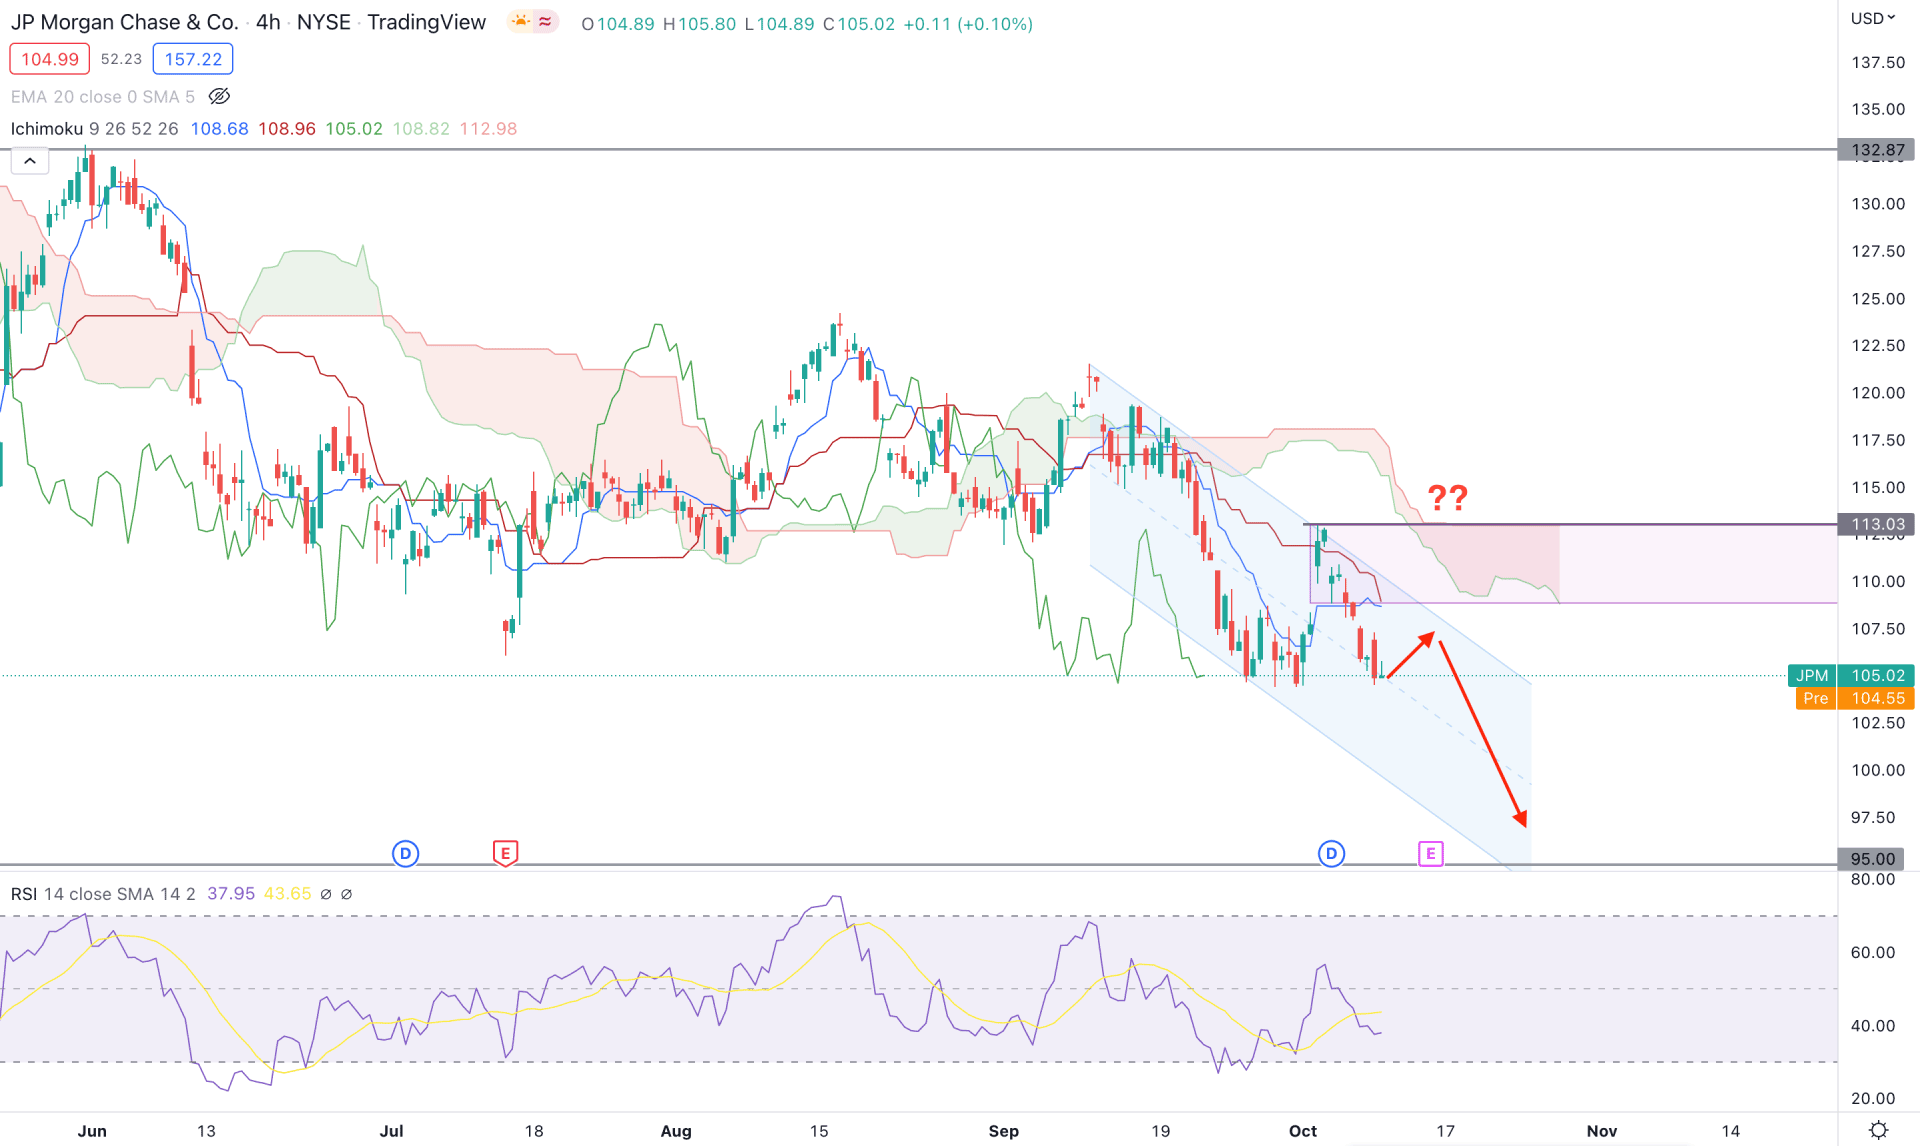
Based on the Ichimoku Cloud, the broader market context of JPM is bearish as the recent price remained stable below the Kumo Cloud for a considerable time. However, the situation is different right now as the important fundamental releases could increase the volatility to the price.
The future cloud shows a bearish signal as the Senkou Span A is steady below the Senkou Span B. Moreover, the dynamic Tenkan Sen is heading down above the Kijun Sen, where a bearish crossover could provide a short signal. The Lagging Span remained below the price, while the Relative Strength Index (RSI) is yet to reach the oversold 30 zone.
Based on the H4 price of JPM, the broader market direction is bearish, where a strong bullish breakout with an H4 candle above 113.00 would open a long opportunity. In that case, the main aim would be to test the 132.87 key resistance level.
The alternative trading approach is to find a reliable bearish rejection from the 109.00 to 113.00 area, which could lower the price toward the 95.00 level.
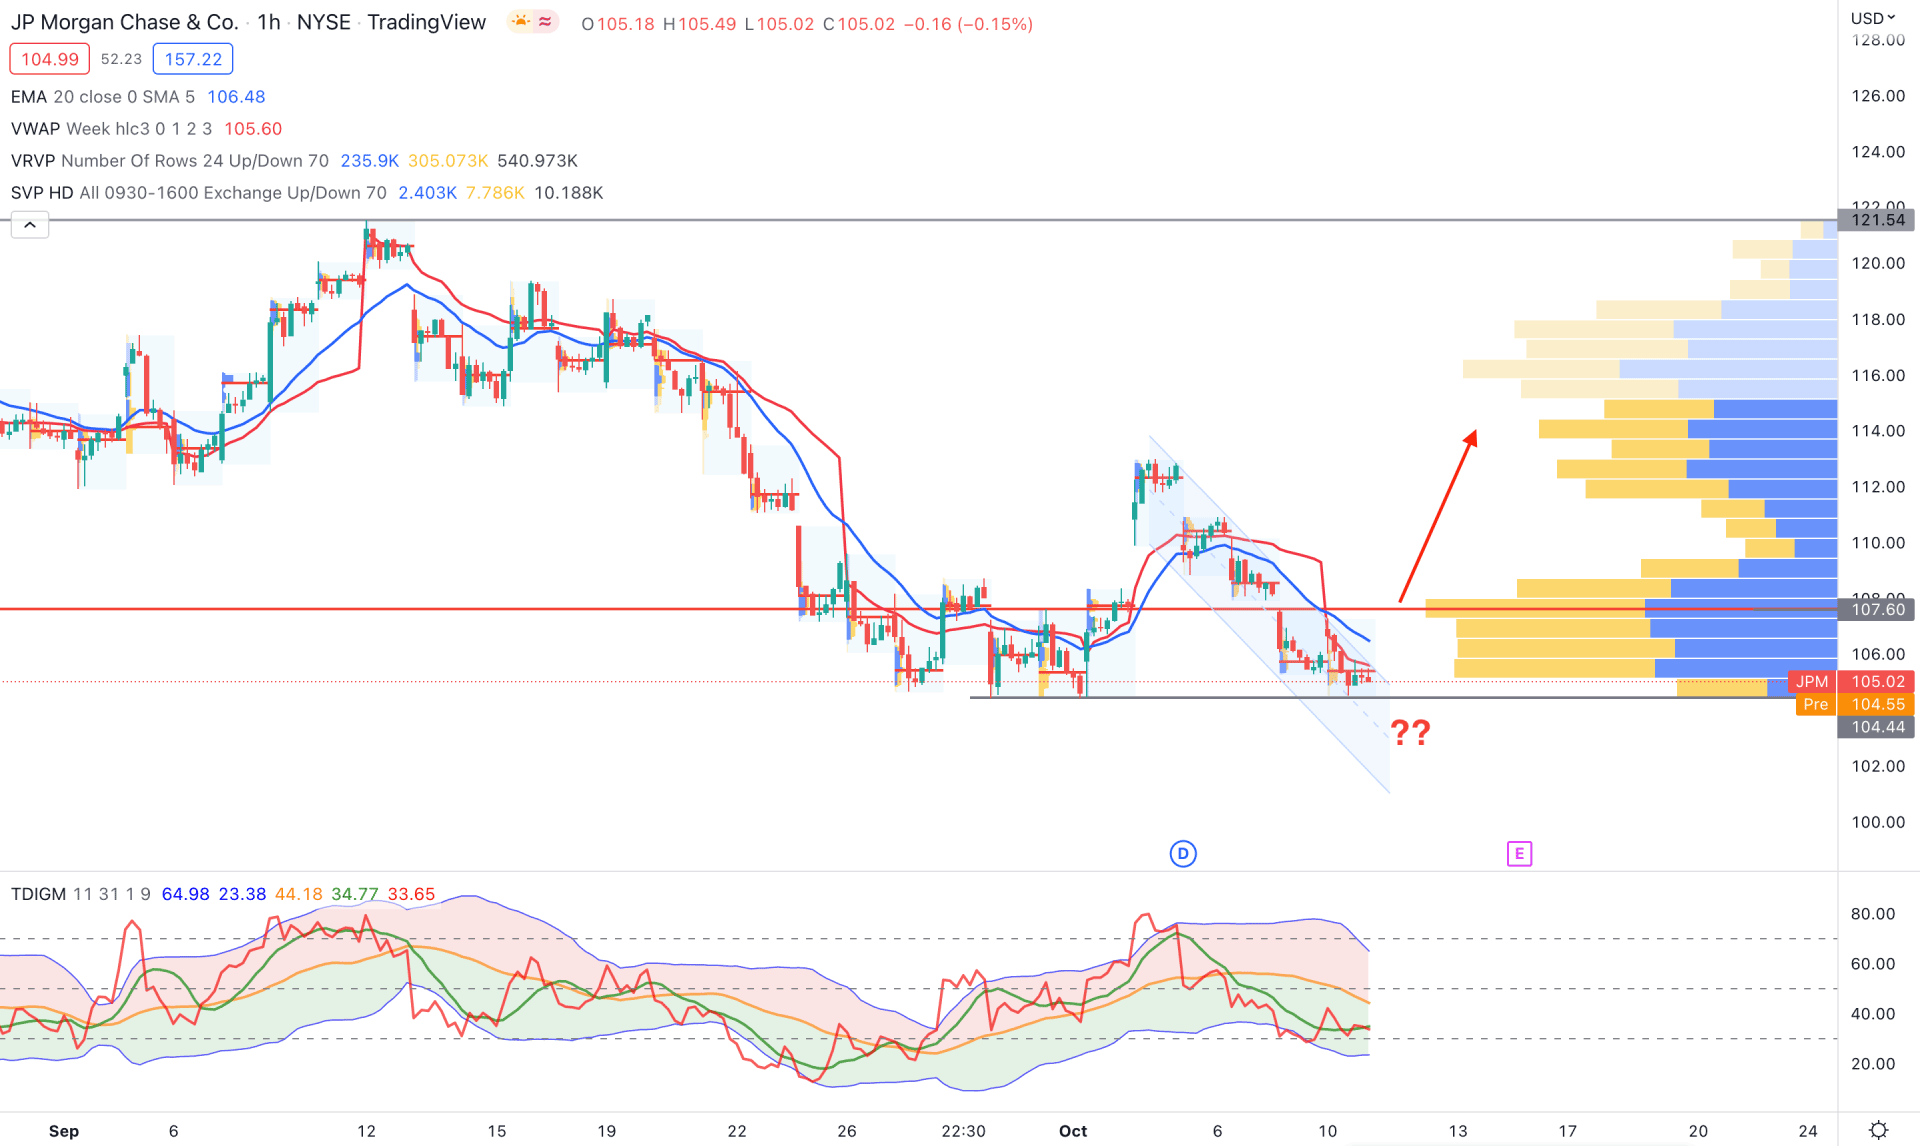
In the H1 chart of JPM, the current price is trading down within a minor descending channel, with the latest visible range high volume level at 107.60. Moreover, the dynamic 20 EMA and weekly VWAP are above the price, working as immediate resistance levels.
The Traders Dynamic Index is below the 50% neutral zone in the indicator window, where a strong bullish recovery would indicate a long opportunity. On the other hand, breaking below the 104.44 support level with a bearish H1 candle could open a bearish opportunity, targeting the 100.00 level.
As per the above discussion, upbeat data in the quarterly report with a bullish breakout could open a long opportunity in JPMorgan Stock. However, investors should closely monitor the near-term double-top pattern, as breaking below this level could open a short opportunity.


