Published: May 19th, 2022
The Fed raised the interest rate in the latest sitting and opened the possibility of cutting its bond holdings on 1 June. The main aim of raising the rate is to control the rampant inflation. On the other hand, the higher interest rate would positively affect bank stocks, although the shares of JPMorgan trades are still down this year amid the concern of inflation and the Ukraine-Russia war.
JPMorgan Chase is the biggest bank in the US, where its stock works as a pathfinder of the US economy. The disappointing factor for JPMorgan is that its stock opens the year with a bullish momentum but tumbles 28% to yesterday's close. The main reason for the selling pressure is stimulus money, supply-demand constraints, and rising inflation. The JPMorgan CEO downplayed the possibility of a recession this year where the increase in short-term and long-term rates would increase the bank’s profit.
As the recent price action has become highly corrective after the selling pressure, any sign of making a bullish break from the current channel would be a buying sign. Let’s see the future price direction from the technical analysis of the JPMorgan Chase Stock (JPM).

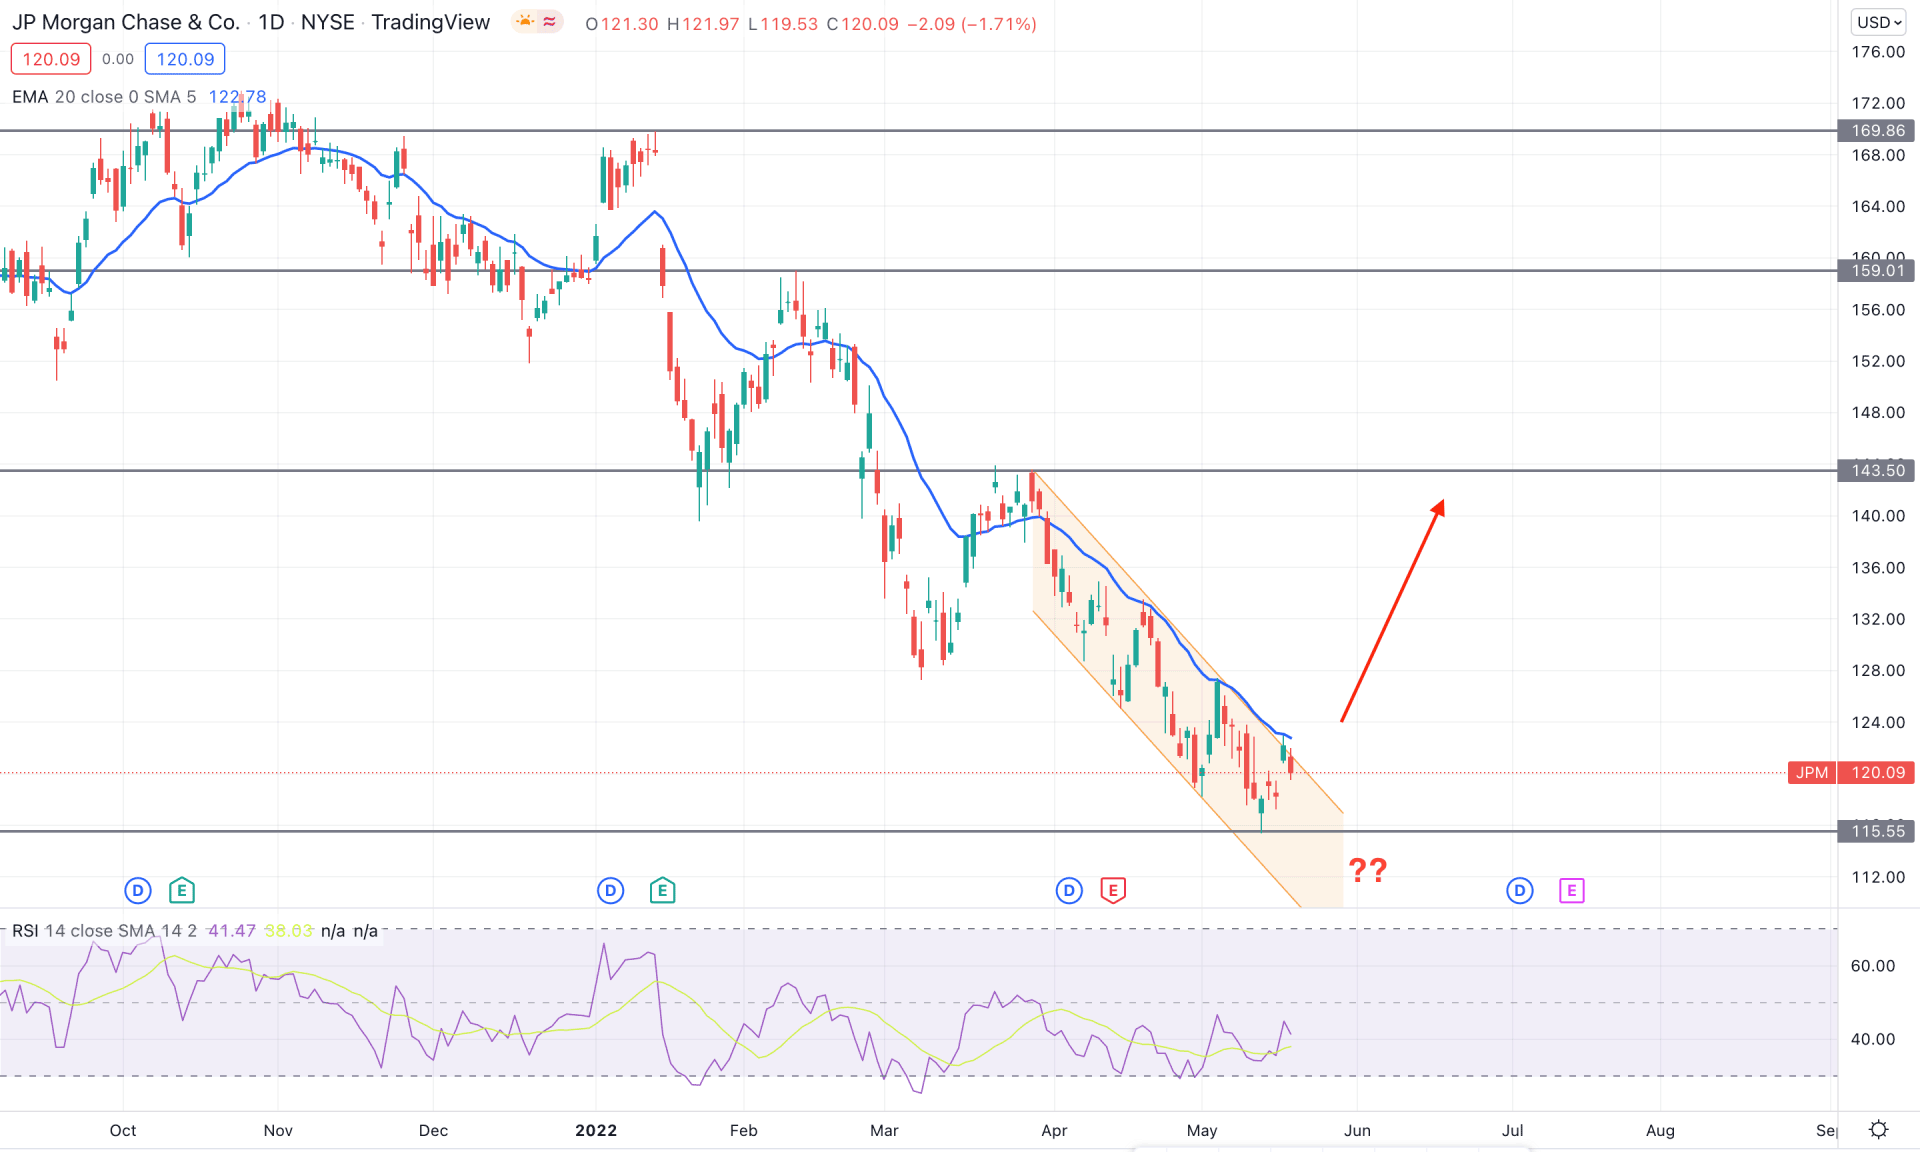
The selling pressure in JPM is still holding its momentum as the price remained stable below the dynamic 20 EMA for a considerable time. However, the selling pressure reached the 5 June 2022 swing high from where a bullish trend appeared with an Iceland pattern. The recent price action within the bearish channel indicates that the stock failed to find the momentum from the Fed rate hike, although the effect of the rising interest rate is pending.
The above image shows the daily chart of JPMorgan Chase stock (JPM), where the RSI is corrective below the neutral 50 level. However, as the RSI rebounded from the oversold 30 level, any bullish sign in the price chart is more likely to work out than bears. The dynamic 20 EMA works as an immediate resistance to the price where the violation of the dynamic 20 EMA with a bullish channel breakout would be the first sign of the possible bullish trend.
Based on the daily chart, investors should monitor how the price trades within the channel where a bullish daily candle above the 124.00 to 126.00 area would increase the buying pressure towards the 143.50 resistance level. On the other hand, the 115.55 level is the ultimate barrier for bulls, where a break below the 115.00 level with a bearish daily candle would lower the price target towards the 105.00 support level.

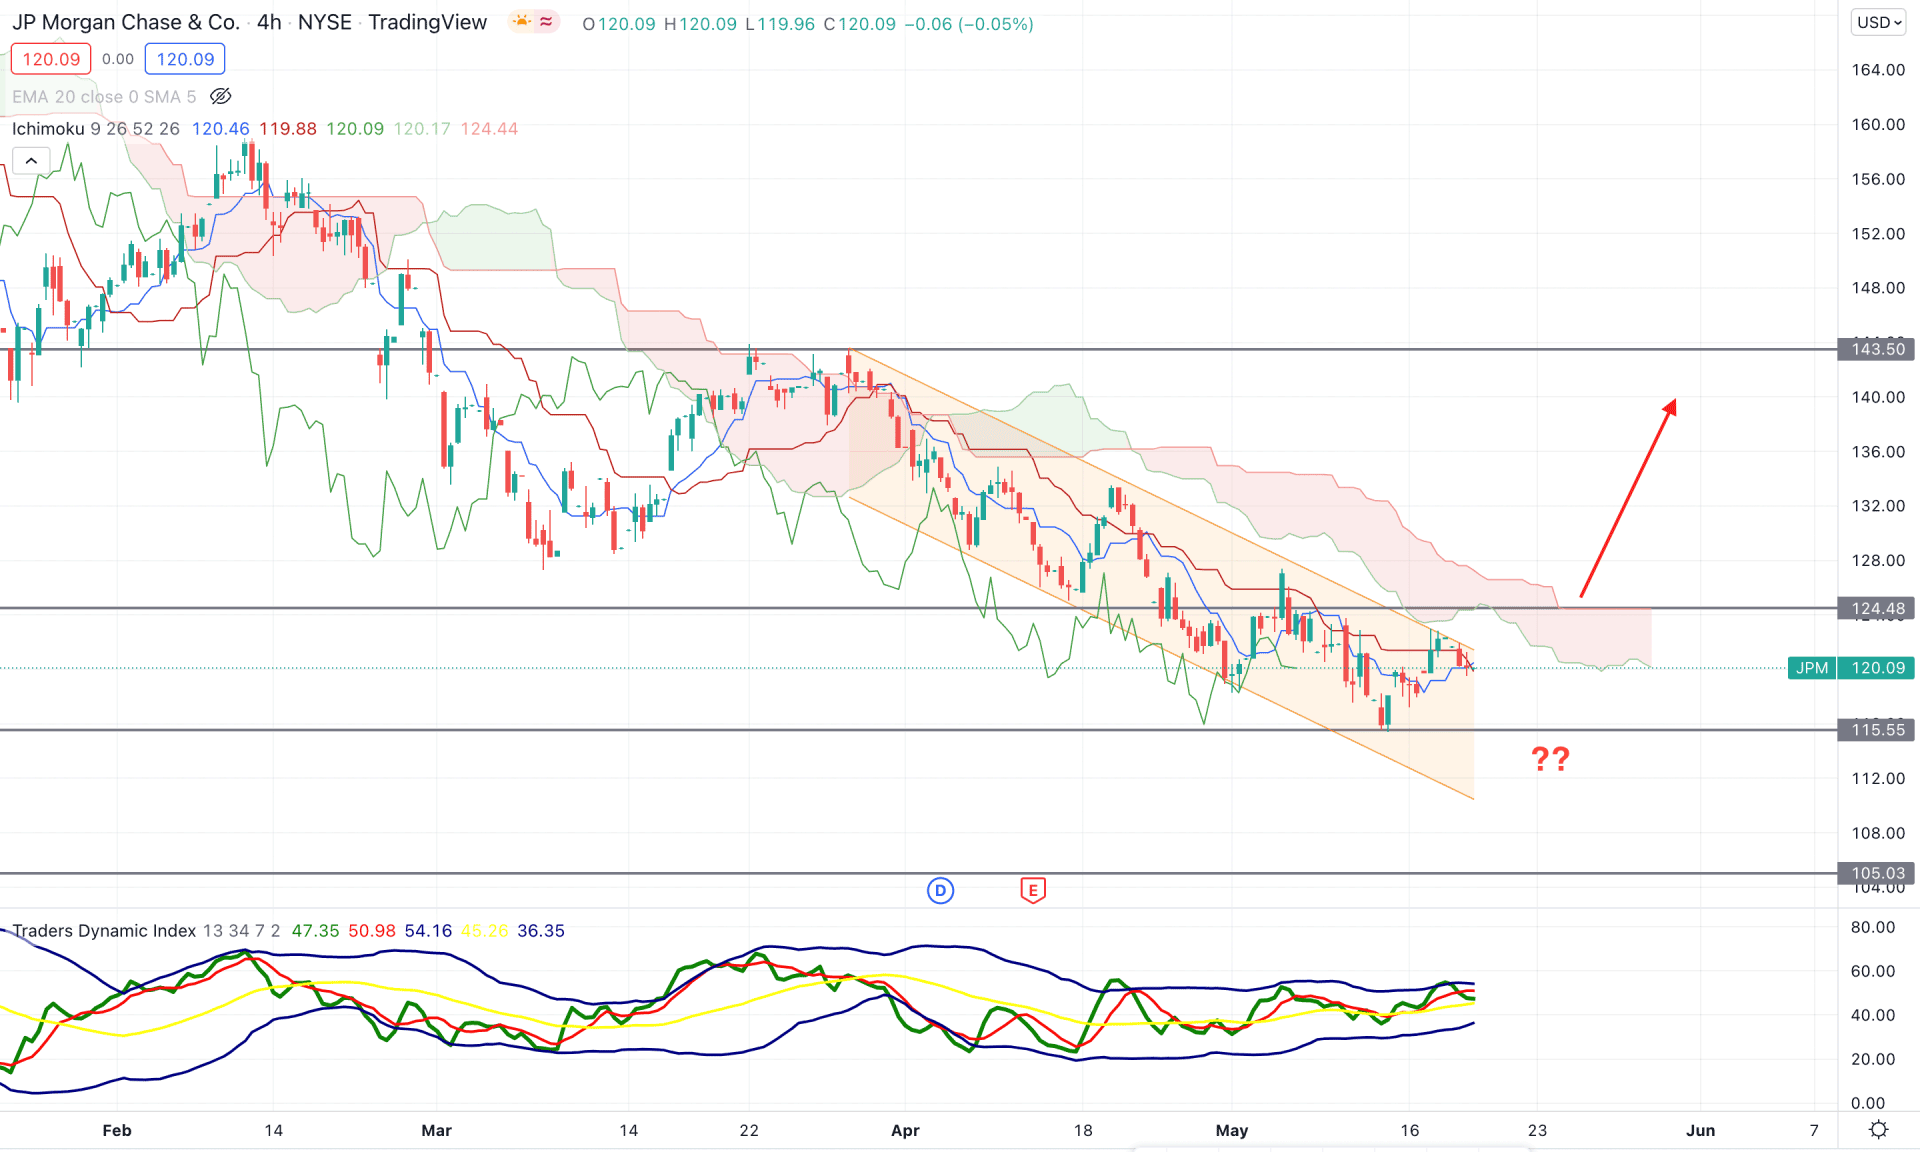
According to the Ichimoku Cloud, the broader market direction in the JPMorgan stock remained bearish as the current price is below the Kumo Cloud, while the Future Cloud is extremely bearish. On the other hand, the current trend below the Kumo Cloud has become corrective within the channel, where any breakout above the Cloud resistance might work as a key price reversal.
The above image shows that the Traders Dynamic Index Line reached the upper band before moving below the neutral 50 level. In that case, Meanwhile, the dynamic Tenkan Sen and Kijun Sen moved closer, indicating fewer investors’ activity in the price.
Based on the H4 contest, investors should wait for a breakout where a bullish H4 close above the 124.88 static resistance level would increase the possibility of testing the 143.50 resistance level. On the other hand, as the long-term trend remains bearish, a new swing low below the 115.55 level would lower the price towards the 105.00 area.

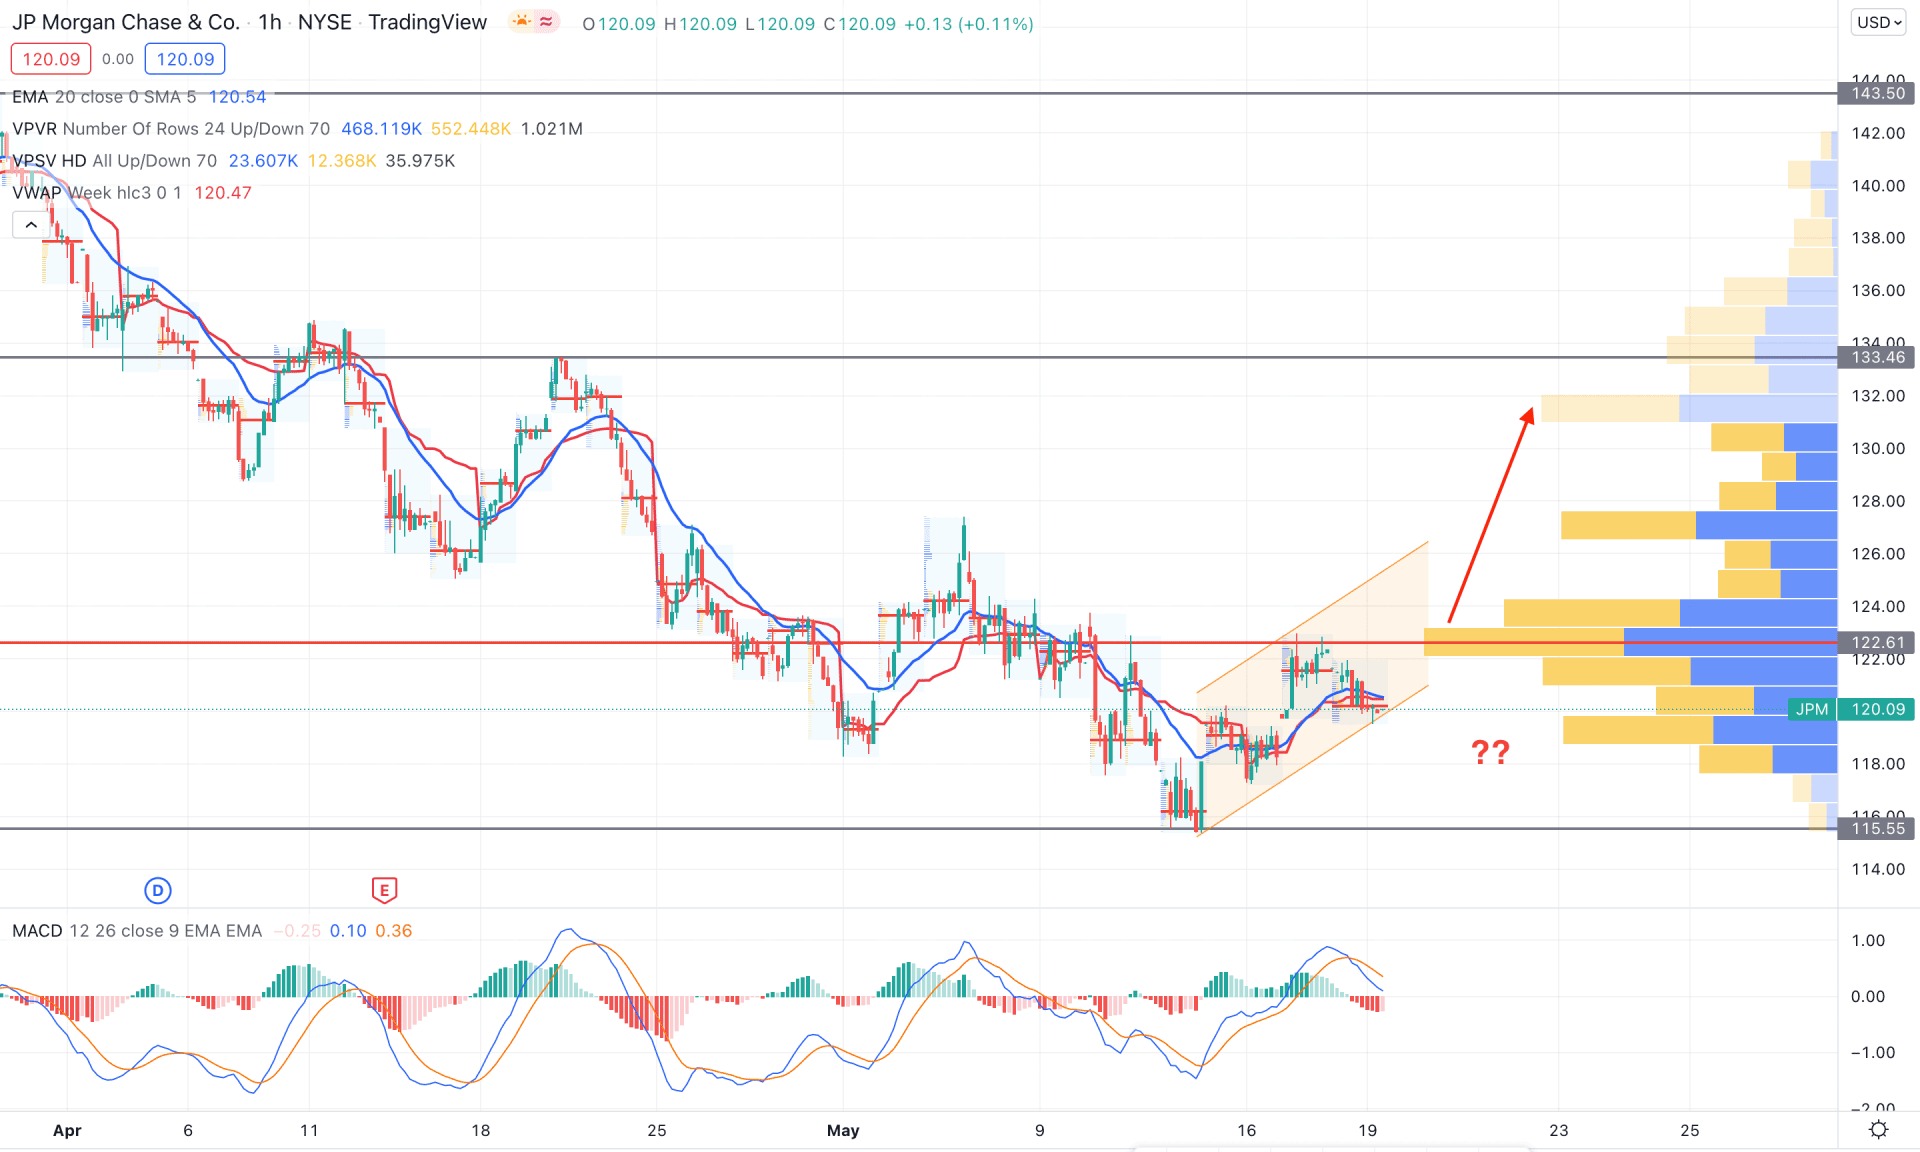
In the intraday H1 chart, the highest volume from the visible range is at the 122.61 level, which may be a strong barrier for bulls. Moreover, the current lower low formation is supported by the H1 close below the dynamic 20 EMA, where the extension of the current bearish trend is solid.
The above image shows that the MACD Histogram remained bearish while the MACD Line pushed lower with a bearish crossover. Meanwhile, the dynamic weekly VWAP is above the price and working as minor resistance. Based on this structure, a new bearish swing low may form until bulls take over the 122.61 level with a bullish H1 close. Therefore, the buying approach should come with a new swing low above the 124.00 level, where the main target would be testing the 122.46 resistance level.
On the other hand, as the current selling pressure is intense, a new H1 candle below the dynamic weekly VWAP may extend the current momentum towards the 110.0 area.
As per the current market context, JPM bulls need a strong breakout from the current bearish channel that may raise the price towards the 143.50 key resistance level. On the other hand, the broader market trend is still bearish in the intraday chart, where finding a selling opportunity might provide a higher return.