
Published: January 19th, 2023
The last time JPMorgan Chase & Co. reported its quarterly earnings was on January 13. For the quarter, the company made a $3.57 profit per share, which was $0.43 more than what analysts expected of $3.14.
For the quarter, the company made $34.55 billion in revenue, which is more than the $34.23 billion that analysts had predicted. The net margin for JPMorgan Chase & Co. was 24.34%, and the return on equity was 14.68%.
Sales at JPMorgan Chase & Co. were up 18.1% from the same quarter last year. In the same time period last year, the company's EPS was $3.33.
The company also just announced a quarterly dividend, which will be funded on January 31. Those who own shares as of Friday, January 6th, will get a dividend of $1.00.
This is equal to a dividend of $4.00 per year and a yield of 2.84%. The date when the dividend is no longer paid is January 5th. The dividend payout ratio (DPR) for JPMorgan Chase & Co. is 33.11%.
Like other banking stocks the increased interest rates have appeared as a blessing for the JPMorgan Chase & Co but the effect was not good due to the stock valuation.
Let’s see the future price prediction from the JPMorgan Chase & Co stock (JPM) technical analysis:
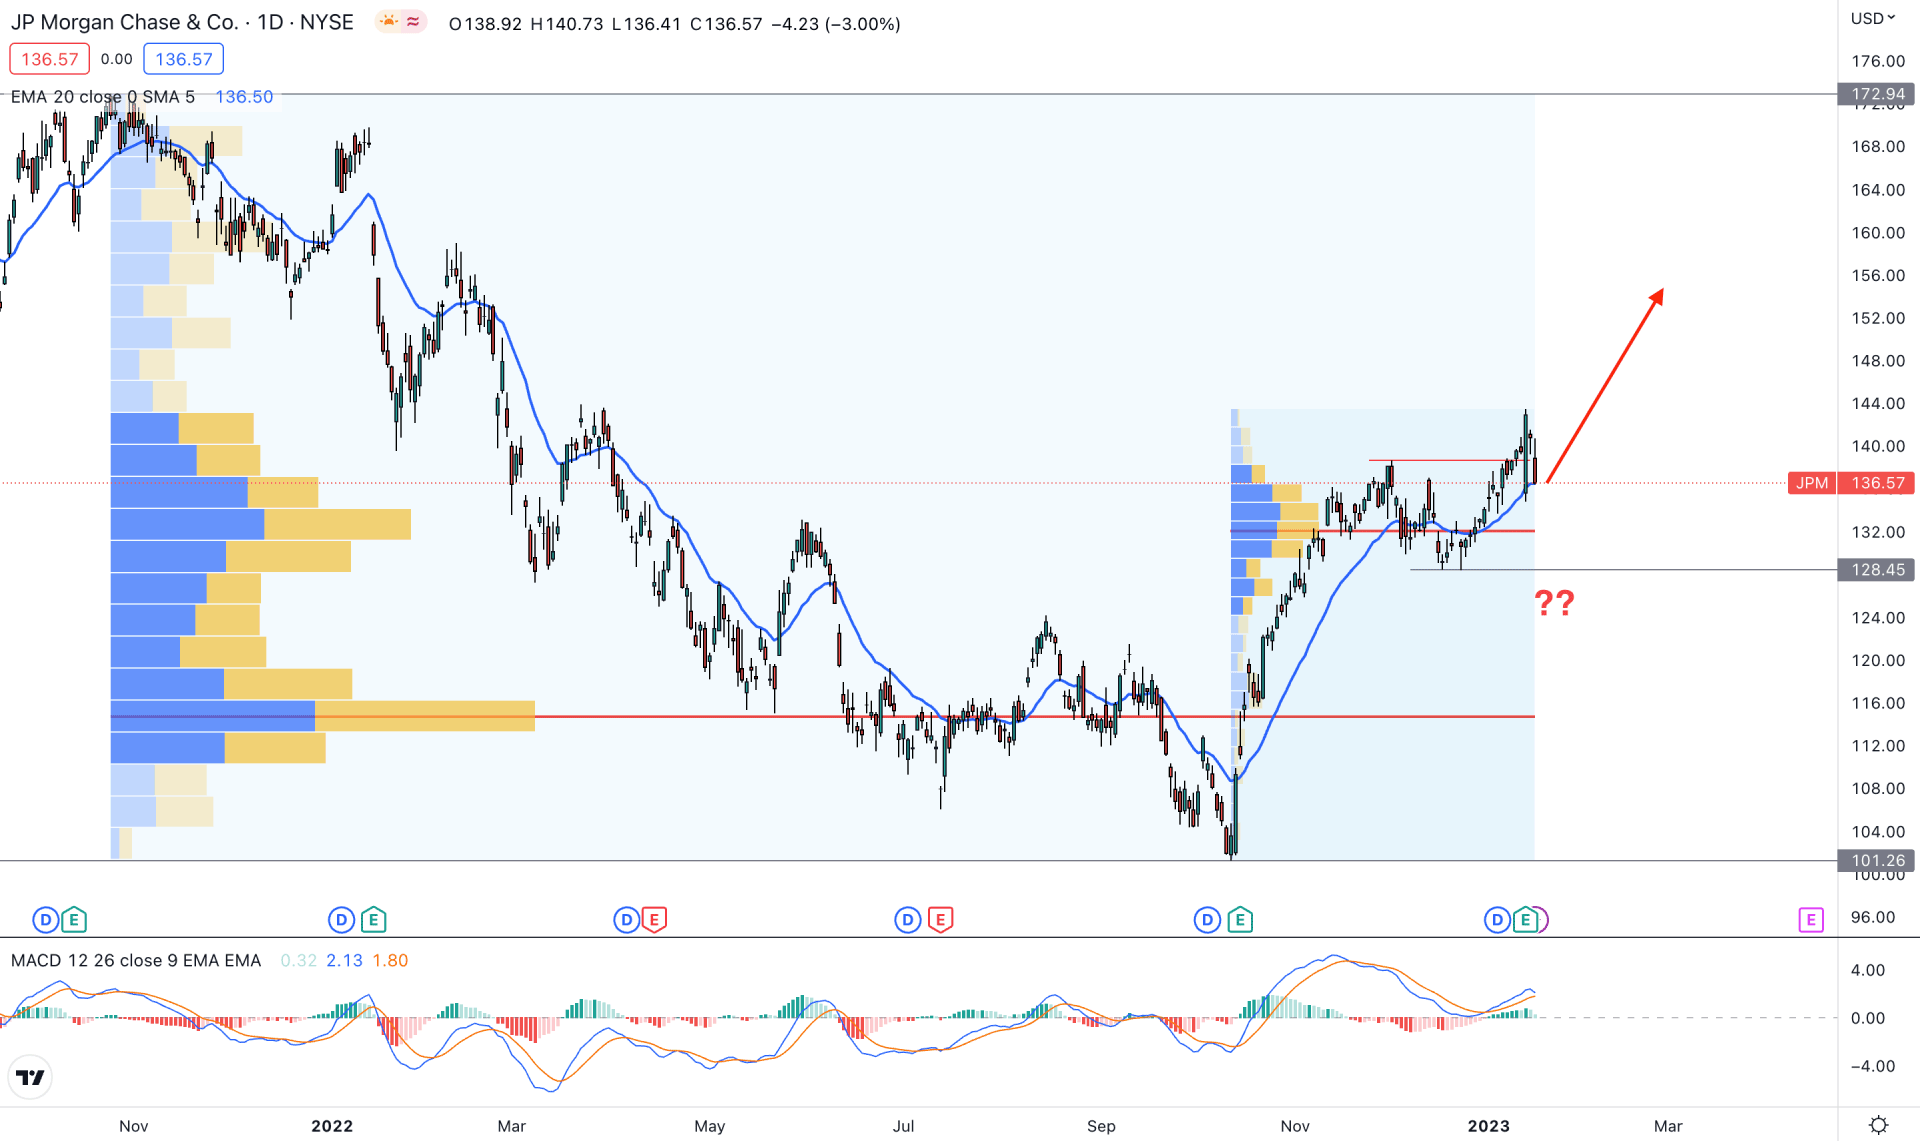
In the daily timeframe, the current price is trading 34.82% higher from the 101.26 swing low. As the price is already trading 20% higher from the latest swing level, we can consider the primary outlook as bullish.
From the left to right, the massive upside pressure from the 101.26 low came with a bullish Quasimodo formation, which will be the bottom of the current tradable range. On the upside, the price has not set any top, which increased the possibility of moving even higher in the coming hours.
In the latest price behavior, bulls made another sell-side liquidity grab with a new higher high formation at the 128.45 swing low. Moreover, the high volume level from October to January is below the current price, which is a sign of strong institutional traders’ interest in this instrument.
The 20-day Exponential Moving Average is the immediate support to bulls, while the current MACD EMA’s are above the neutral line.
Based on the daily outlook, the bullish possibility in this instrument is potent as long as it trades above the 128.46 support level. In that case, the primary idea is to look for long opportunities, where the ultimate target is to reach the 172.94 key resistance level.
On the downside, a sharp bearish daily close below the 124.00 level could validate the bearish possibility, which can lower the price toward the 101.26 area.
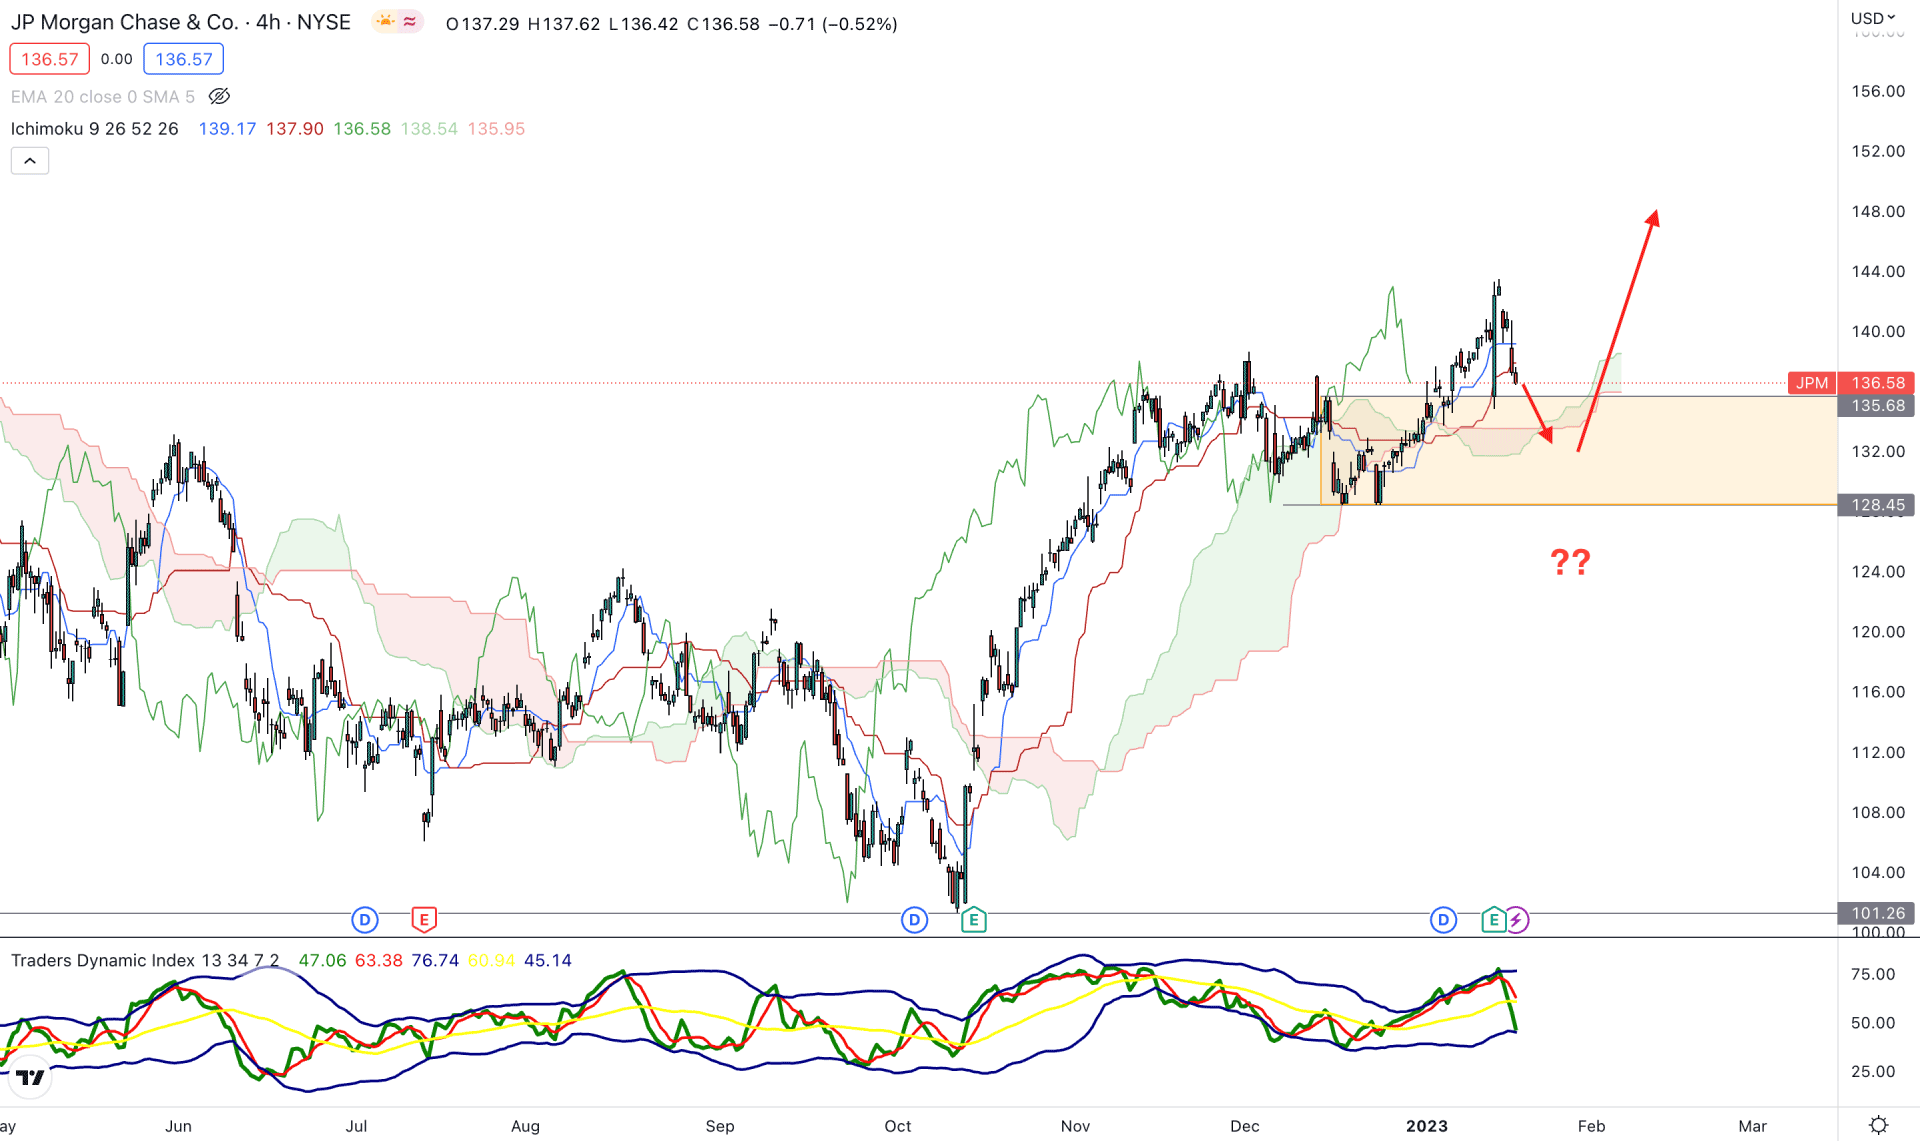
In the H4 timeframe, the broader outlook is bullish as the current price is trading with an impulsive pressure above the Ichimoku Kumo Cloud. After making a decent upside pressure in October 2022, the price kept moving higher by making lower highs. As there is no significant lower low visible from the current trend, the ideal approach would be to look for long opportunities.
In the Future Cloud, the Senkou Span A is above B, while both of these lines are moving upwards. It is a sign that short-term and medium-term investors are looking for long opportunities in this instrument. Moreover, the Lagging Span is also above the price, which is providing confluence support to bulls.
In the indicator window, the Traders Dynamic Index reached the upper boundary from where a selling pressure has come. However, the long opportunities are valid as long as the traders dynamic index is holding its position at about 50% area.
Based on the above price behavior, investors should look for long opportunities if there is a bullish rejection candlestick from the 135.68 to the 128.45 area.
On the bearish side, strong selling pressure and an H4 candle below the 128.00 level would indicate the first sign of a possible bearish trend towards the 101.00 area.
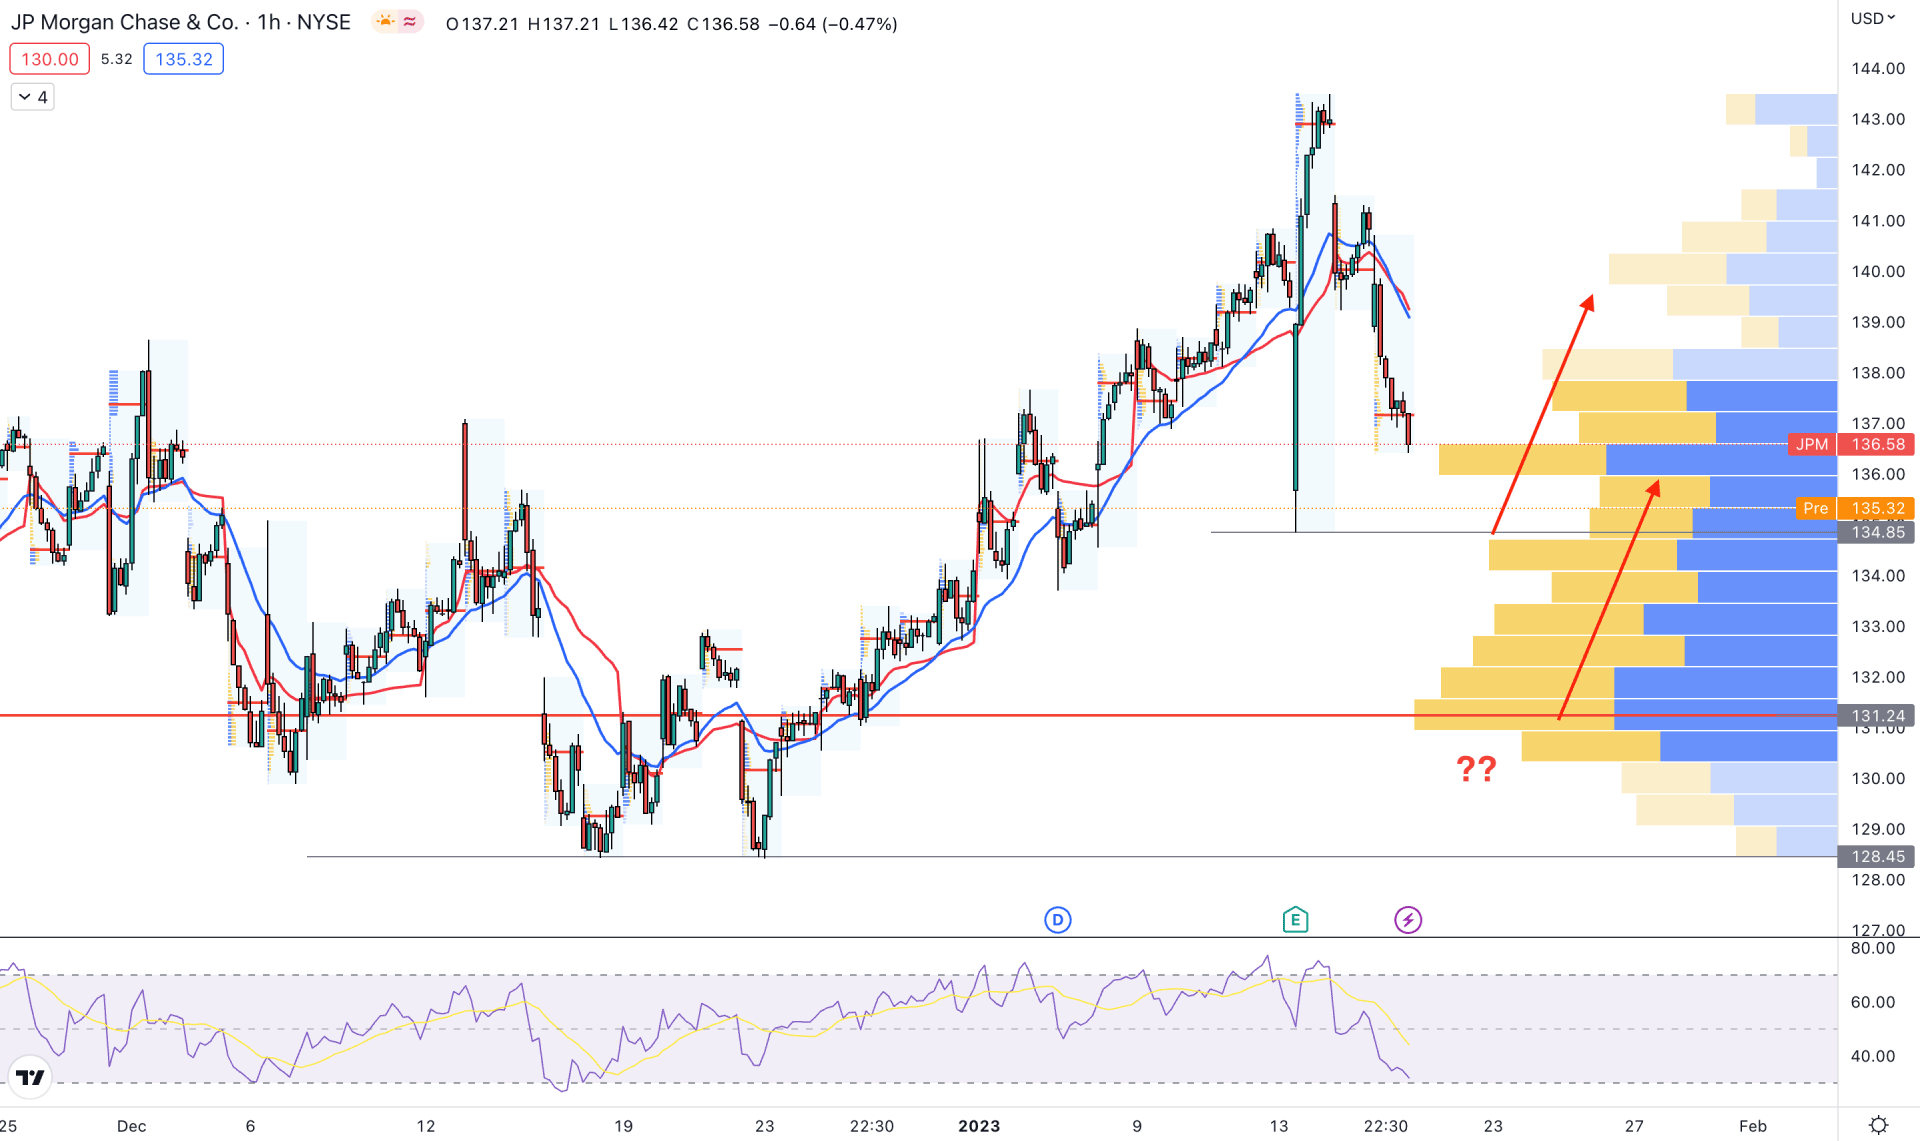
In the hourly chart, a significant bearish correction is seen, which is not enough to say that the bullish trend is over.
The visible range high volume level is at 131.24 level, which would be the last hope for bulls. The dynamic 20 EMA and VWAP are already above the price, while the RSI is near the 30% area.
Therefore, any bullish rejection from the 134.85 to 131.24 zone with a candle close above the 20 EMA could validate the buying opportunity, targeting the 150.00 area.
Based on the current price outlook, a buying opportunity is valid in this instrument and any bullish rejection from intraday swings could offer an investment opportunity.
However, investors should closely monitor how the Fed reacts to the interest rate increase, where a more hawkish tone could increase the bearishness to the US stock market.


