![Johnson & Johnson Stock [JNJ] is at Critical 171.00 Event-Level – Can Buyers Take Control?](https://d3kvcd8uuqwmxt.cloudfront.net/filecache/articles_img/tech-analysis-main-page.jpg_766_6138af76422ec6.61553656.jpeg)
Published: September 8th, 2021
Johnson & Johnson showed better-than-expected Q2 earnings that pushed investors to rely on this instrument, except the question continued to plague the COVID-19 vaccine. The US regulation warned that the J&J shot might tie to an immune condition named Guillain-Barre syndrome. As a result, regulators pushed J&J to pause the use of injections temporarily.
In the second quarter, Johnson & Johnson showed earnings of $2.48 per share with $23.31 billion in sales. The earning represented a 48.5% surge while the sales increased by 27.1%. Moreover, JNJ projected the full-year outlook with $9.50- $9.60 per share with the possibility of sales growth by 9.5% to 10.5%.
Overall, Johnson & Johnson’s quarterly earnings reports are above the satisfactory 25% level, which is strong evidence that the JNJ stock will grow higher. First, however, investors should focus on how the price is reacting on the 171.00 event level.
Let’s see the upcoming price direction from the Johnson & Johnson [JNJ] technical analysis:
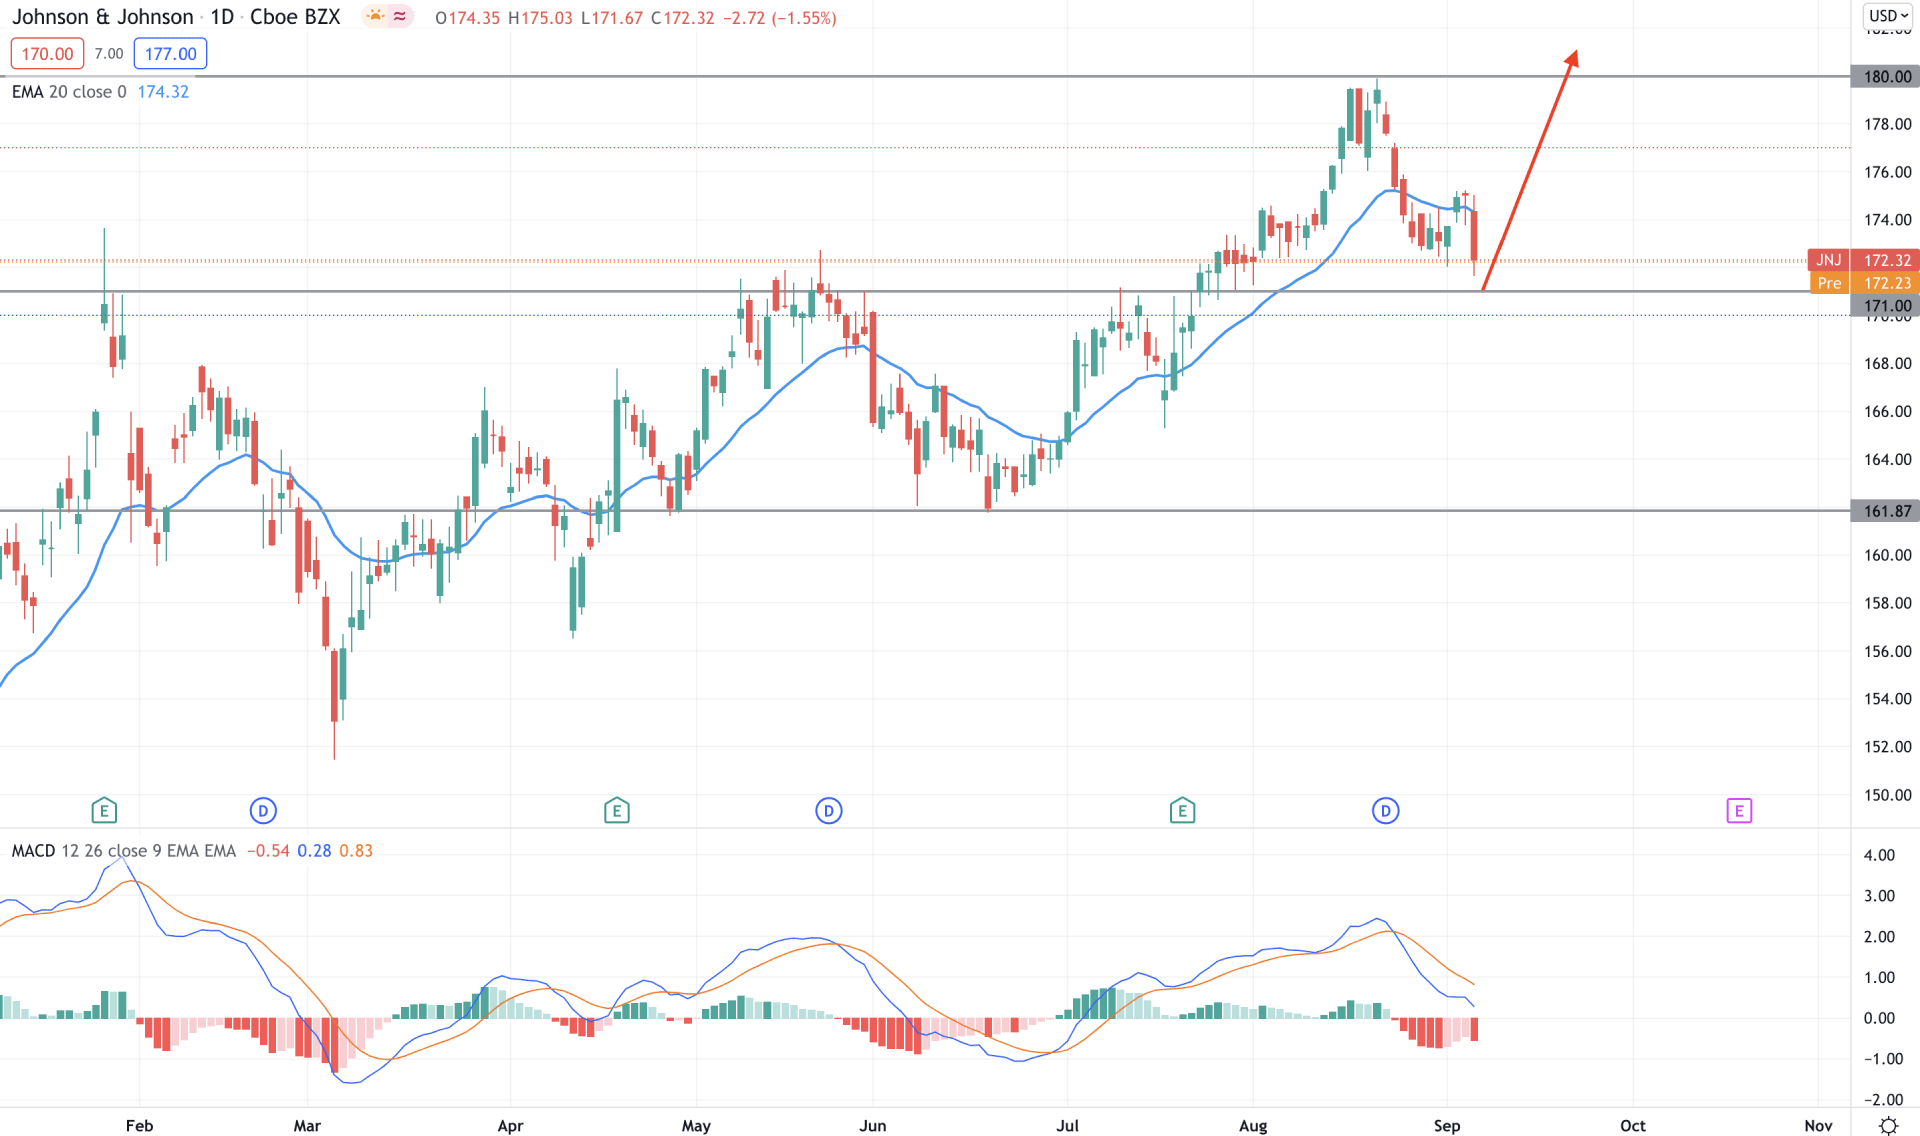
Johnson & Johnson stock is trading within a bullish trend where the price reached the 179.92 all-time high from where a bearish pressure came. Moreover, the price moved below the dynamic 20 EMA with a bearish rejection and formed a new swing low at the 171.67 level. However, the price is still above the 171.00 event level, and investors should closely monitor how the price reacts on this level.
The indicator window shows that the MACD Histogram turned bearish and formed a new low this week. Therefore, any bearish daily candle below the 171.00 event level with the current MACD sentiment is more likely to extend the bearish pressure towards the 161.87 support level.
On the other hand, the overall market structure is bullish, and the price is still above the 171.00 level. Therefore, any rebound with a bullish daily close above the dynamic 20 EMA may alter the current market structure and take the price higher towards the 180.00 level.
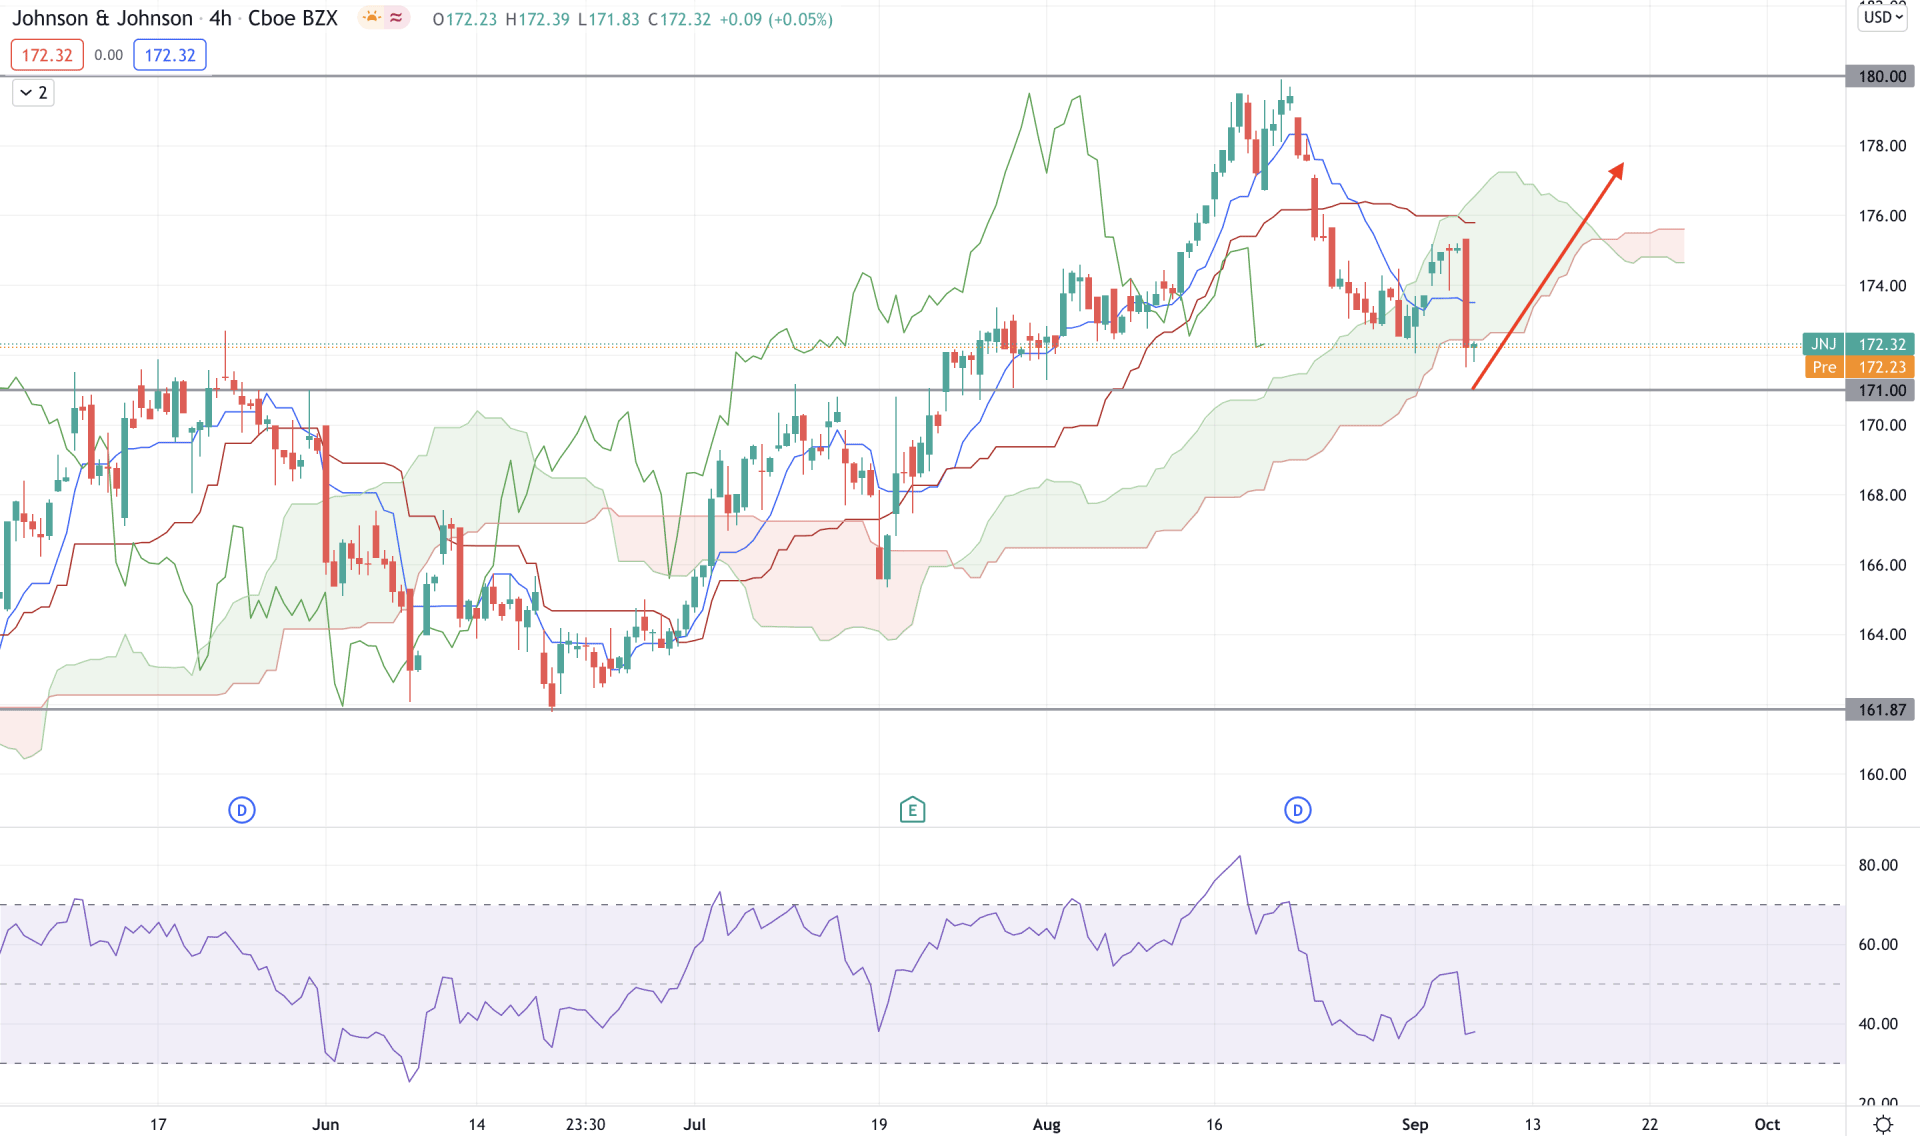
According to the H4 timeframe, Johnson & Johnson stock has remained stable above the Ichimoku Kumo Cloud from July 19. However, the most recent counter impulsive momentum took the price towards the cloud support area. Moreover, the future cloud turned bearish as the Senkou Span A moved below the Senkou Span B and pointed downwards.
The above image shows that the price moved below the dynamic Tenkan Sen with a strong bearish candle. Moreover, the Tenkan Sen crossed down the Kijun Sen and worked as a resistance to the price. Meanwhile, the Relative Strength Index is bearish and yet to reach the oversold 30 levels.
Based on the H4 structure, the price is more likely to extend the bearish pressure towards the 166.00 swing low. However, any bullish rejection from the 171.00 level may raise a bullish correction towards the cloud resistance 177.00 level.
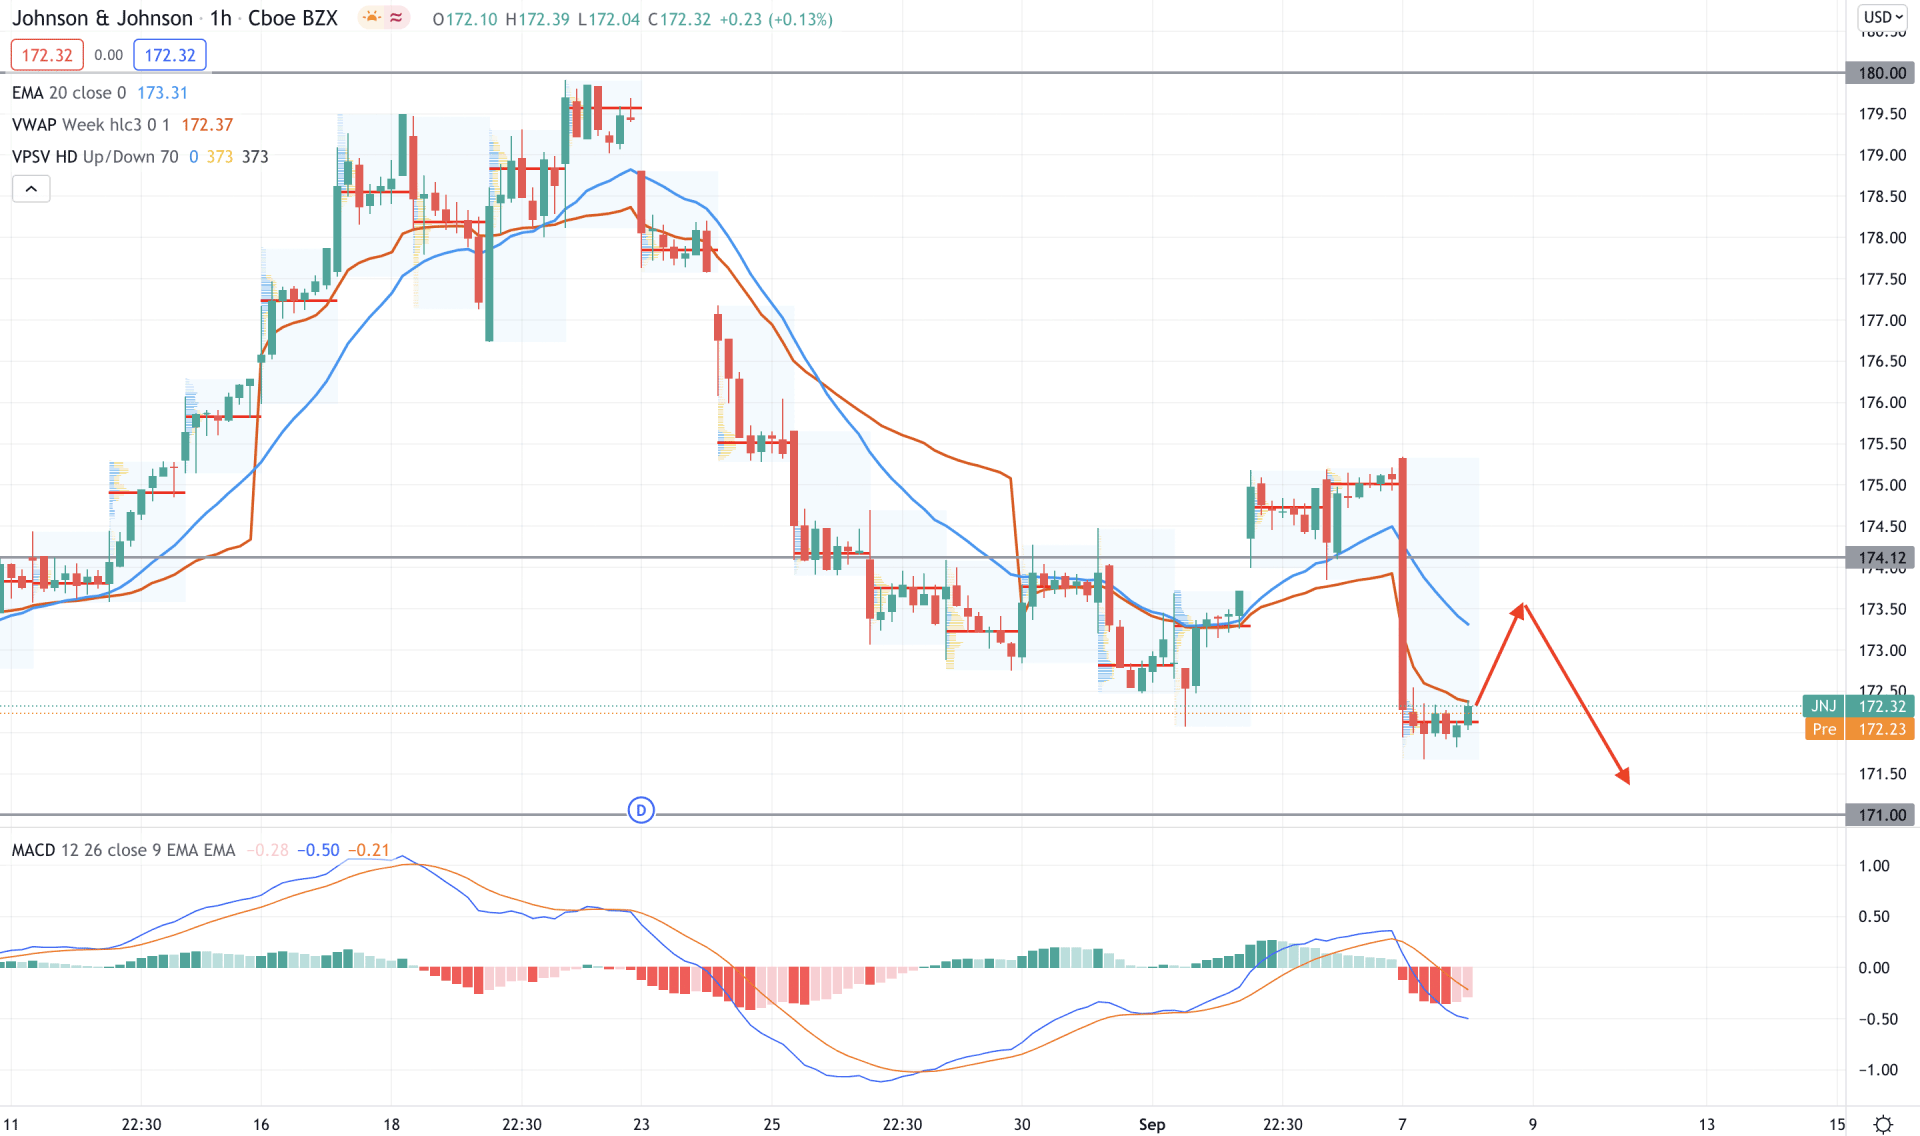
In the intraday chart, Johnson & Johnson stock faces a bearish pressure as soon as the price moves below the 174.14 event-level with an impulsive bearish pressure. Therefore, bears may attempt to take the price lower until bulls are taking the price above the 174.14 level.
The above image shows that the price moved lower from the 174.98 intraday high volume level with a massive bearish H1 close. Moreover, the price moved below the dynamic 20 EMA and weekly vwap and closed the day with a corrective momentum at the 172.14 high volume level.
In this context, buyers should wait until the price moves above the 174.14 level with a bullish H1 close. On the other hand, a break below the 171.00 level with a bearish H1 close may alter the current market structure.
As of the above discussion, we can say that the Johnson & Johnson Stock is facing a bearish pressure in the intraday chart. However, the overall market structure is bullish in the higher timeframe, and any rebound with a bullish H4 close above the Dynamic Kijun Sen may resume the broader trend active.
On the other hand, sellers’ should wait for a bearish daily close and correction below the 171.00 level to rely on the possible bearish pressure towards the 165.00 level.


