

Published: July 14th, 2026
In 2026, Johnson & Johnson (JNJ) has subtly reappeared as one of the better-performing large-cap healthcare companies.
Investors are focusing on the medical services giant's second-quarter report, which is scheduled to be released this week.
Johnson & Johnson gives investors a mix of conservative traits, steady earnings growth, and a superior dividend. Moreover, it is one of the finest financial statements in corporate America, even if many tech stocks still fetch high prices.
According to analysts' projections, Q2 EPS will be around $2.85 on sales of $25.18 billion, which is a moderate increase of 3% and 6% over the same quarter last year, respectively.
Johnson & Johnson's pricing is still very appealing when compared to several large-cap medical peers and the overall market, even though it has hit new highs.
With a dividend yield of 2.09%, JNJ is considerably above the 1.03% average of the S&P 500 and about on pace with its industry average. Johnson & Johnson has continuously shown that it can make significant investments in R&D, mergers, and innovation while also rewarding shareholders with yearly dividend increases.
Let's see the further aspect of the JNJ multi-time frame analysis:
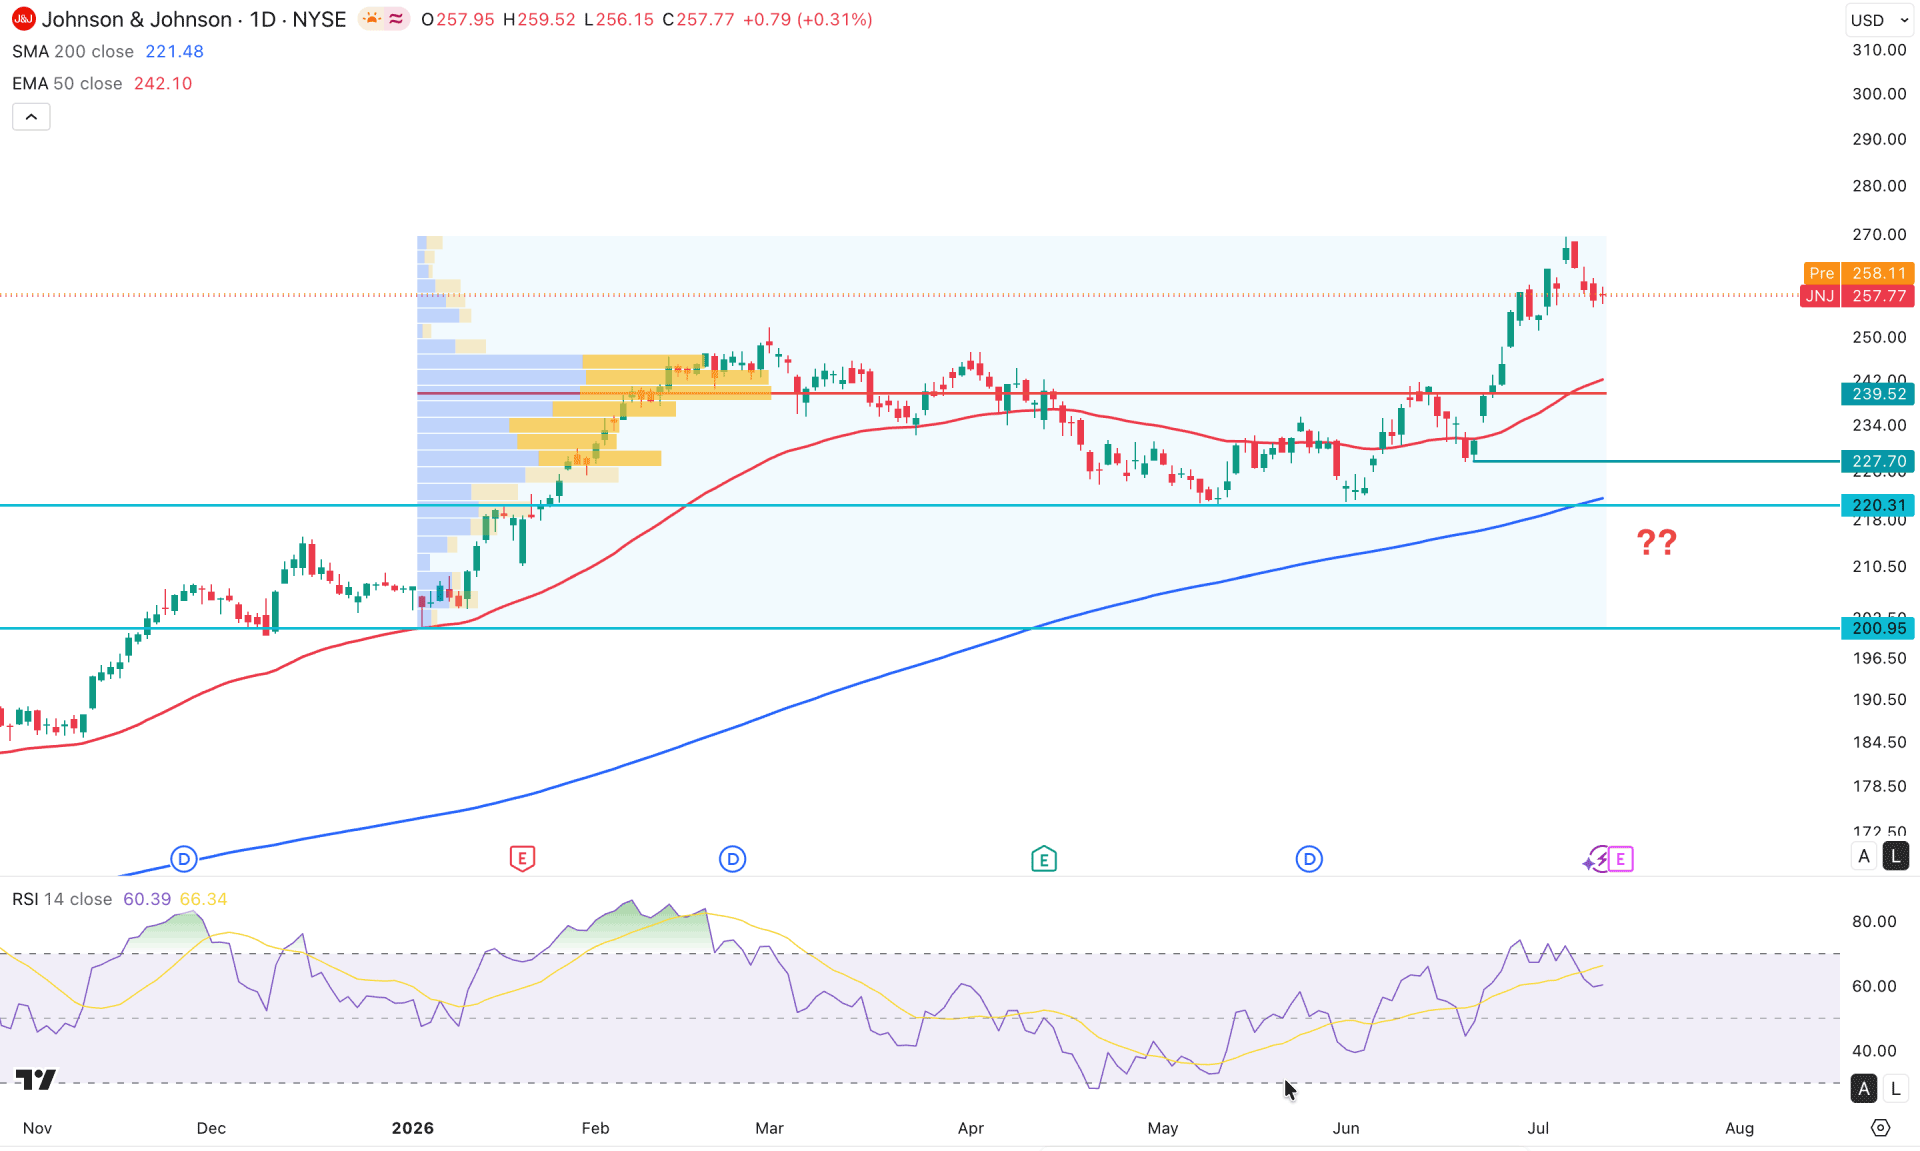
In the daily chart of Johnson & Johnson stock, a prolonged bullish trend continuation is visible, and the most recent price is trading near the all-time high level. As the current price is aiming higher from a valid bearish correction, more pressure is anticipated.
Looking at the higher timeframe, the monthly candlestick suggests a valid bullish momentum after three consecutive corrective bearish months. As the most recent price is moving above the existing monthly engulfing breakout, the primary anticipation would be to look for long trades. The weekly timeframe shows a sign of correction, as the recent candlestick closed as an inside bar with a valid buy-side liquidity grab.
As per the volume, the buyers are dominating the market, as the largest level since January 2026 is at 239.511, which is well below the current price.
In the main price chart, the recent price shows an immediate recovery from the 269.93 swing high, signalling a potential bearish correction. The 200-day SMA and 50-day EMA are below the current price with a bullish slope, where the gap with the current price is extended. Primarily, it is a sign of a strong bull trend where a minor downside correction is still pending as a mean reversion.
The Relative Strength Index shows no sign of a bullish overextension, as the current line is hovering below the 70.00 line with a divergence.
Based on the daily market outlook, a minor correction is pending in the JNJ stock, where the crucial level to look at is the 251.14 swing low. A break below this swing level could increase the possibility of testing the 239.52 high-volume support level before reaching the 227.70 area.
On the other hand, a failure to push the price below the 239.50 support level could increase the possibility of a bullish swing and a continuation beyond the 300.00 psychological limit. In that case, an immediate opportunity might appear from a valid rebound from the 50-day EMA area.
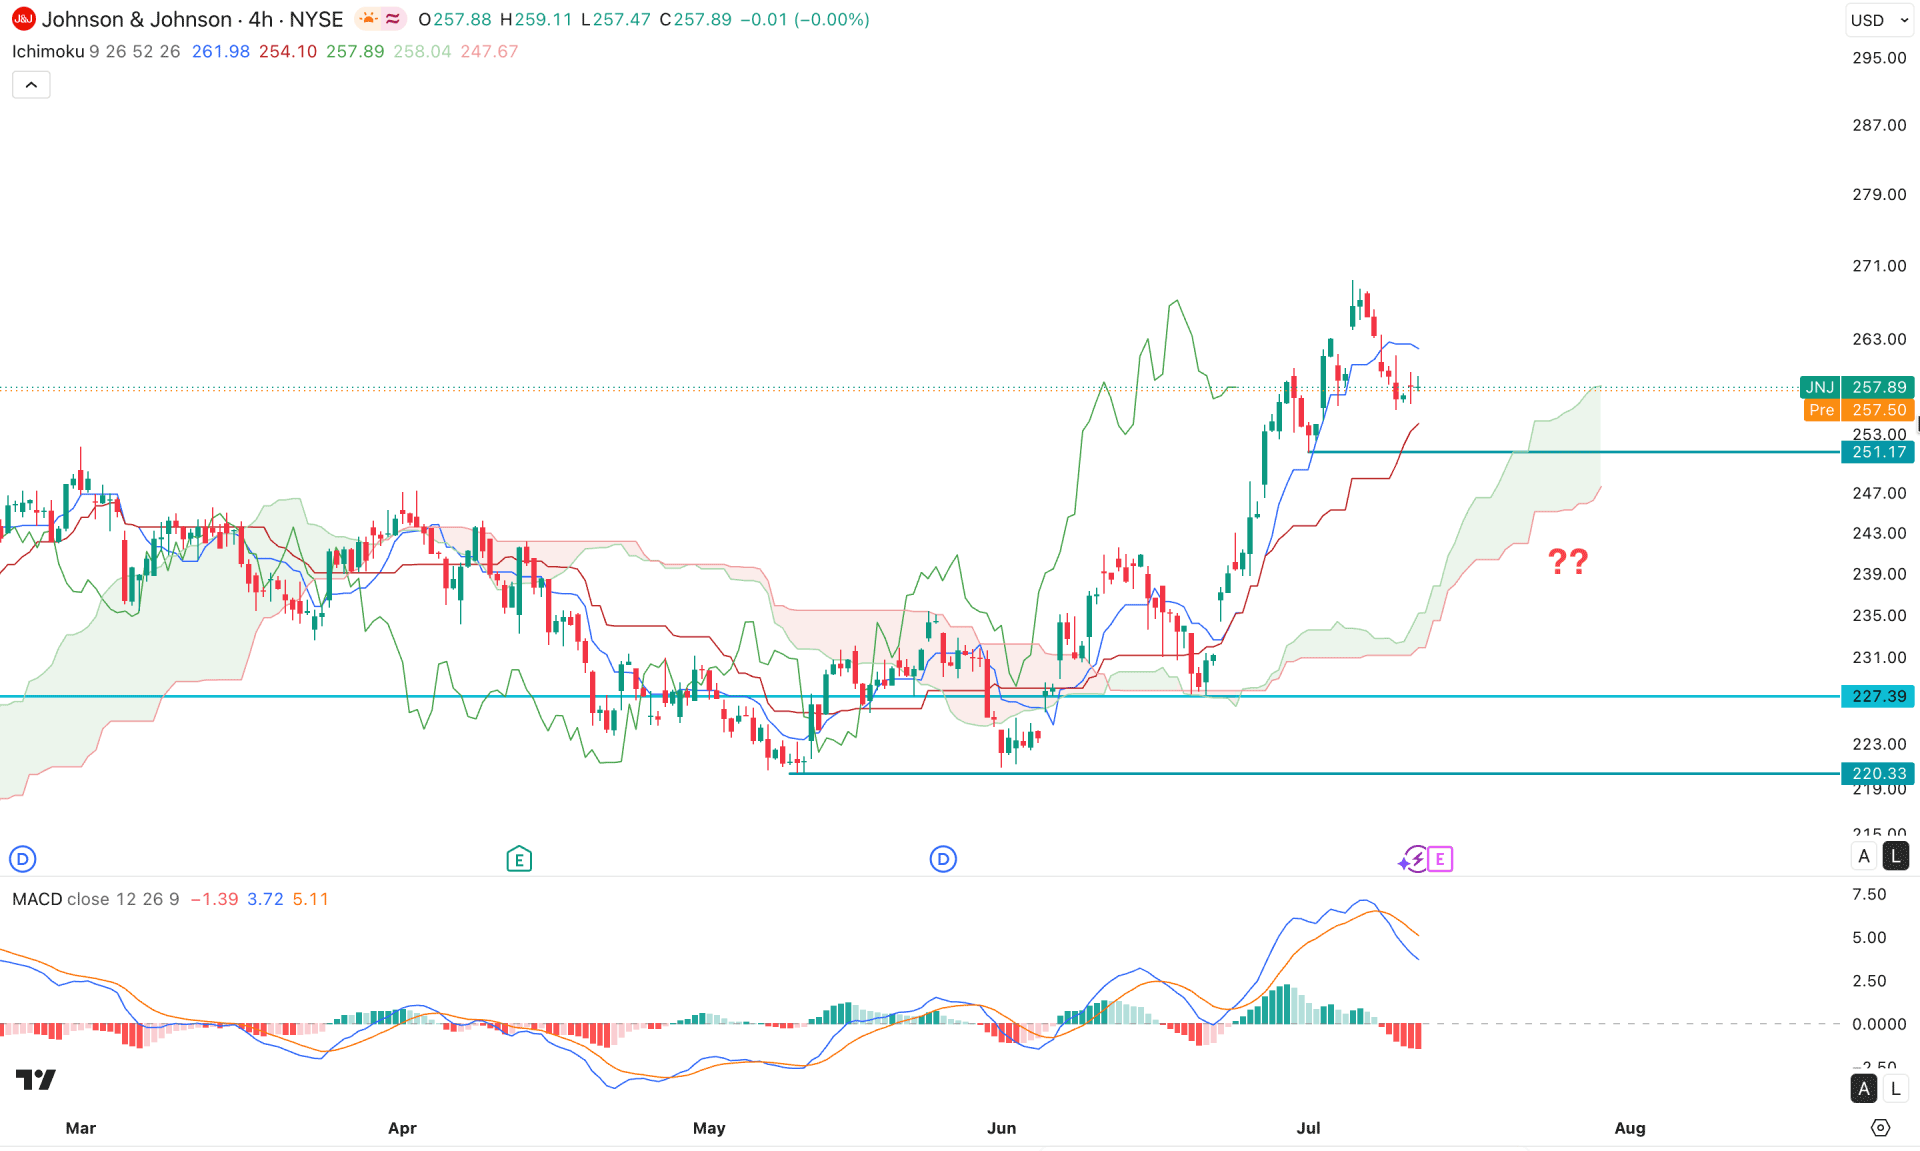
In the four-hour chart of JNJ, the ongoing buy pressure is visible above the Kumo cloud area. The future cloud is supporting bulls. Primarily, a bullish breakout with a valid retest from the cloud support signals a possible bullish strength continuation opportunity.
In the indicator window, the MACD histogram is hovering below the neutral level for a considerable time, where the signal line is at the highest level in the last four months. It is a sign of an extreme bullish condition in the market, from where a moderate downside correction is pending.
Based on this outlook, the momentum is valid as long as it trades above the Kumo cloud support. The immediate static support is located at the 251.17 level. A bullish response from this area could increase the possibility of moving beyond the 280.00 level. However, a bearish break below the 251.17 level might extend the downside correction towards the 232.50 area.
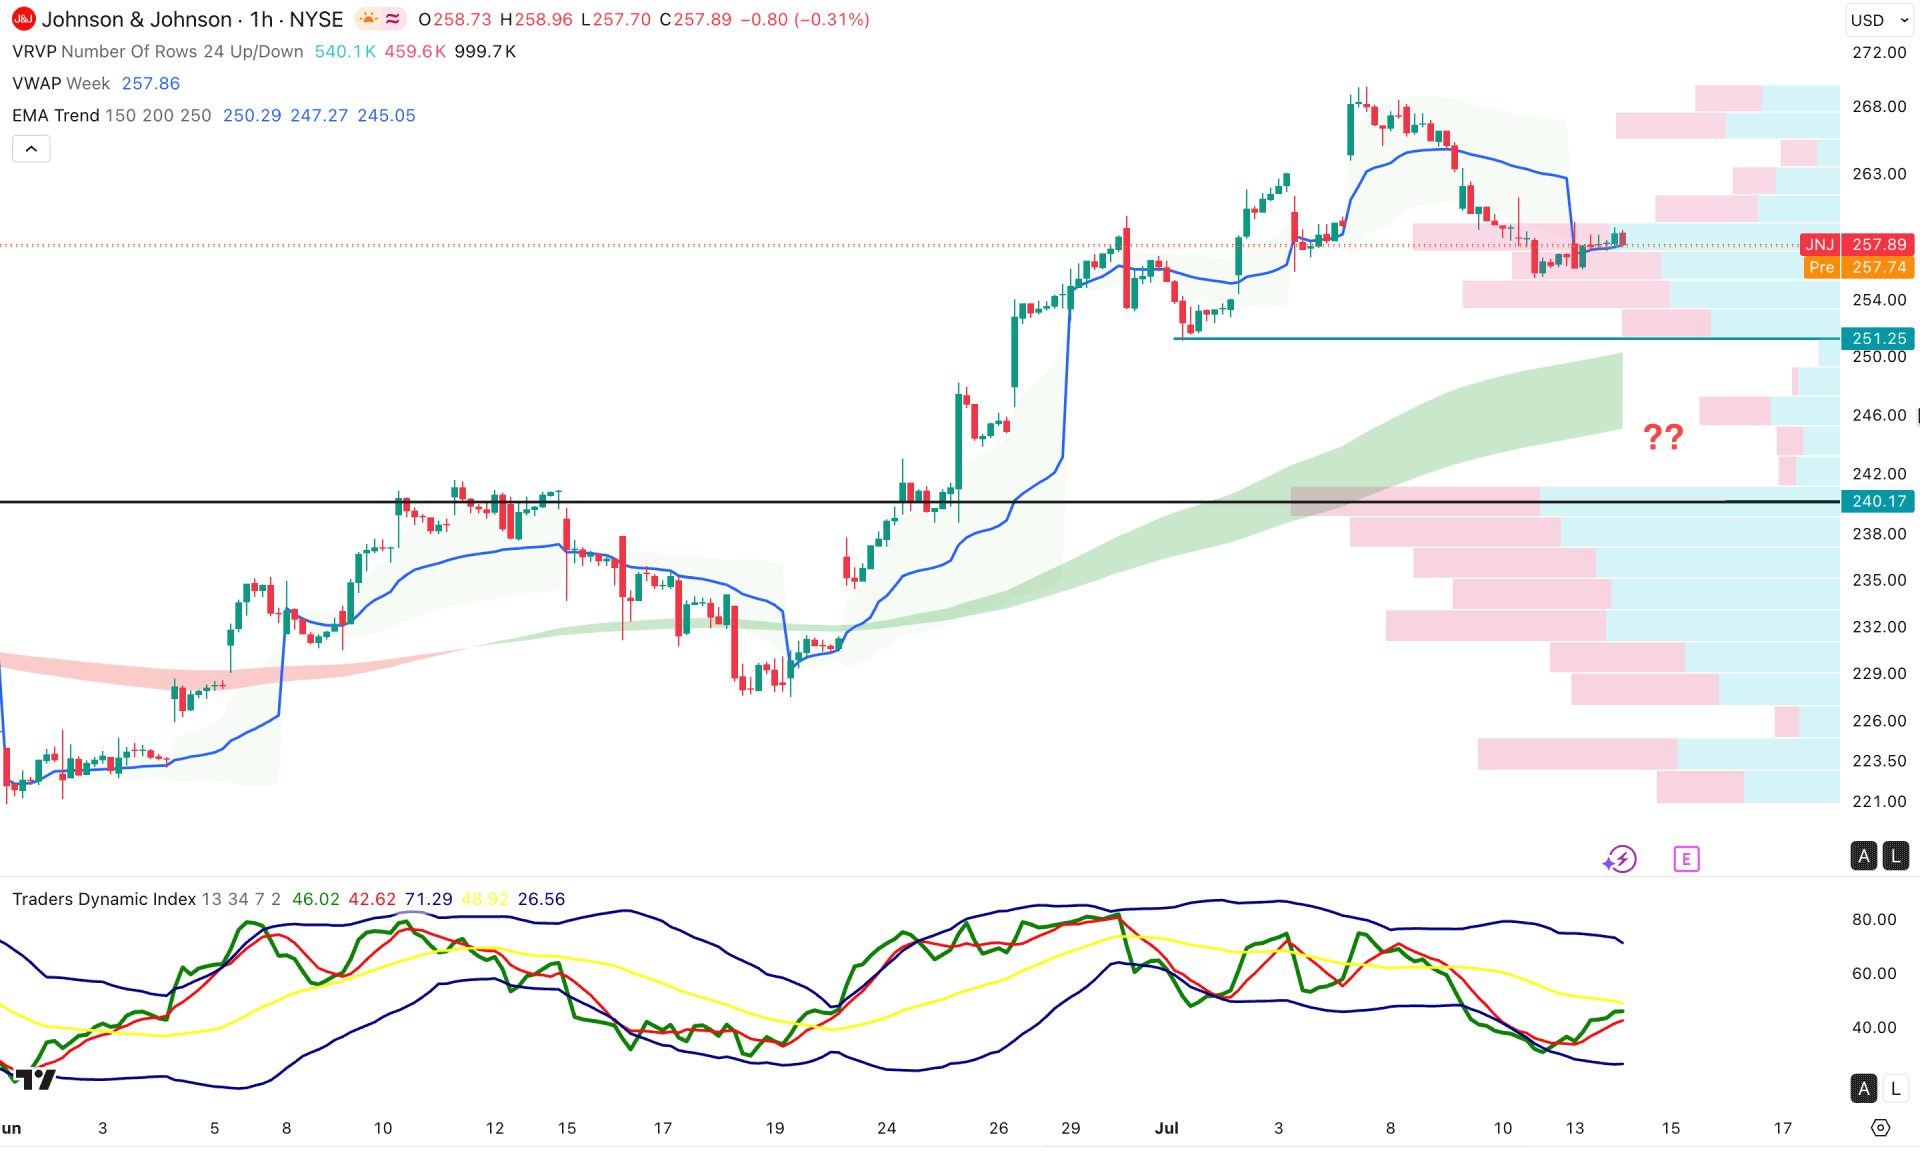
In the hourly timeframe, the price is trading at a bullish overextended area from the intraday high volume area. As selling pressure is visible from the weekly VWAP level, which is above the current price and working as an immediate resistance. On the other hand, the EMA wave is below the current price and hovering above the 240.17 high-volume support level. As the gap between the current price and high-volume support is expanded, a moderate downside correction is likely.
In the secondary indicator window, the Traders Dynamic Index is aiming lower below the 50.0 neutral line, suggesting active selling pressure in the market.
Based on this market outlook, the immediate support to look at is the 251.25 level. A break below this line could increase the possibility of testing the 240.10 high-volume support level. However, within this area, a recovery above the weekly VWAP level is possible to open a short-term long opportunity. On the bullish side, the primary target level is the 268.00 area before heading above the 280.00 level.
Based on the overall market structure, JNJ is trading within a strong bullish trend, and the recent price is overextended above the 260.00 level. Although a moderate downside correction is still pending, the price may show a bullish recovery after testing any available key support level.


