
Published: April 8th, 2025
With its JitoSOL liquid stakes pool and an assortment of MEV goods, Jito Network plays a significant role in the Solana ecosystem.
Users can use JitoSOL in place of SOL. Holders receive yield by staking to maintain SOL's liquidity and DeFi chances. In a unique way, JitoSOL offers its holders extra benefits from the transaction revenue generated by MEV harvesting on Solana.
Profit potential attributable to the particular sequence in which a transaction is executed is described by maximum accessible value or MEV. If there is a significant exchange on Orca, for instance, the price of the pool may drop below that of Raydium or Serum. The price differential will cause traders to scramble to benefit, and this exchange is known as MEV.
By tokenizing staked resources into Vault Receipt Tokens (VRTs), Jito (Re) staking enhances flexibility and liquidity. Jito (Re)staking allows NCNs to maximize tokenomics and security by customizing staking rules, fines, and rewards. This restocking module's distinctive qualities make it the perfect option for utilizing shared security to create new networks.
This integration allows users to keep liquidity, increase their staking rewards, and become more aware of possible airdrops inside the Solana network.
Let's see the upcoming price direction of this token from the JTO/USDT technical analysis:
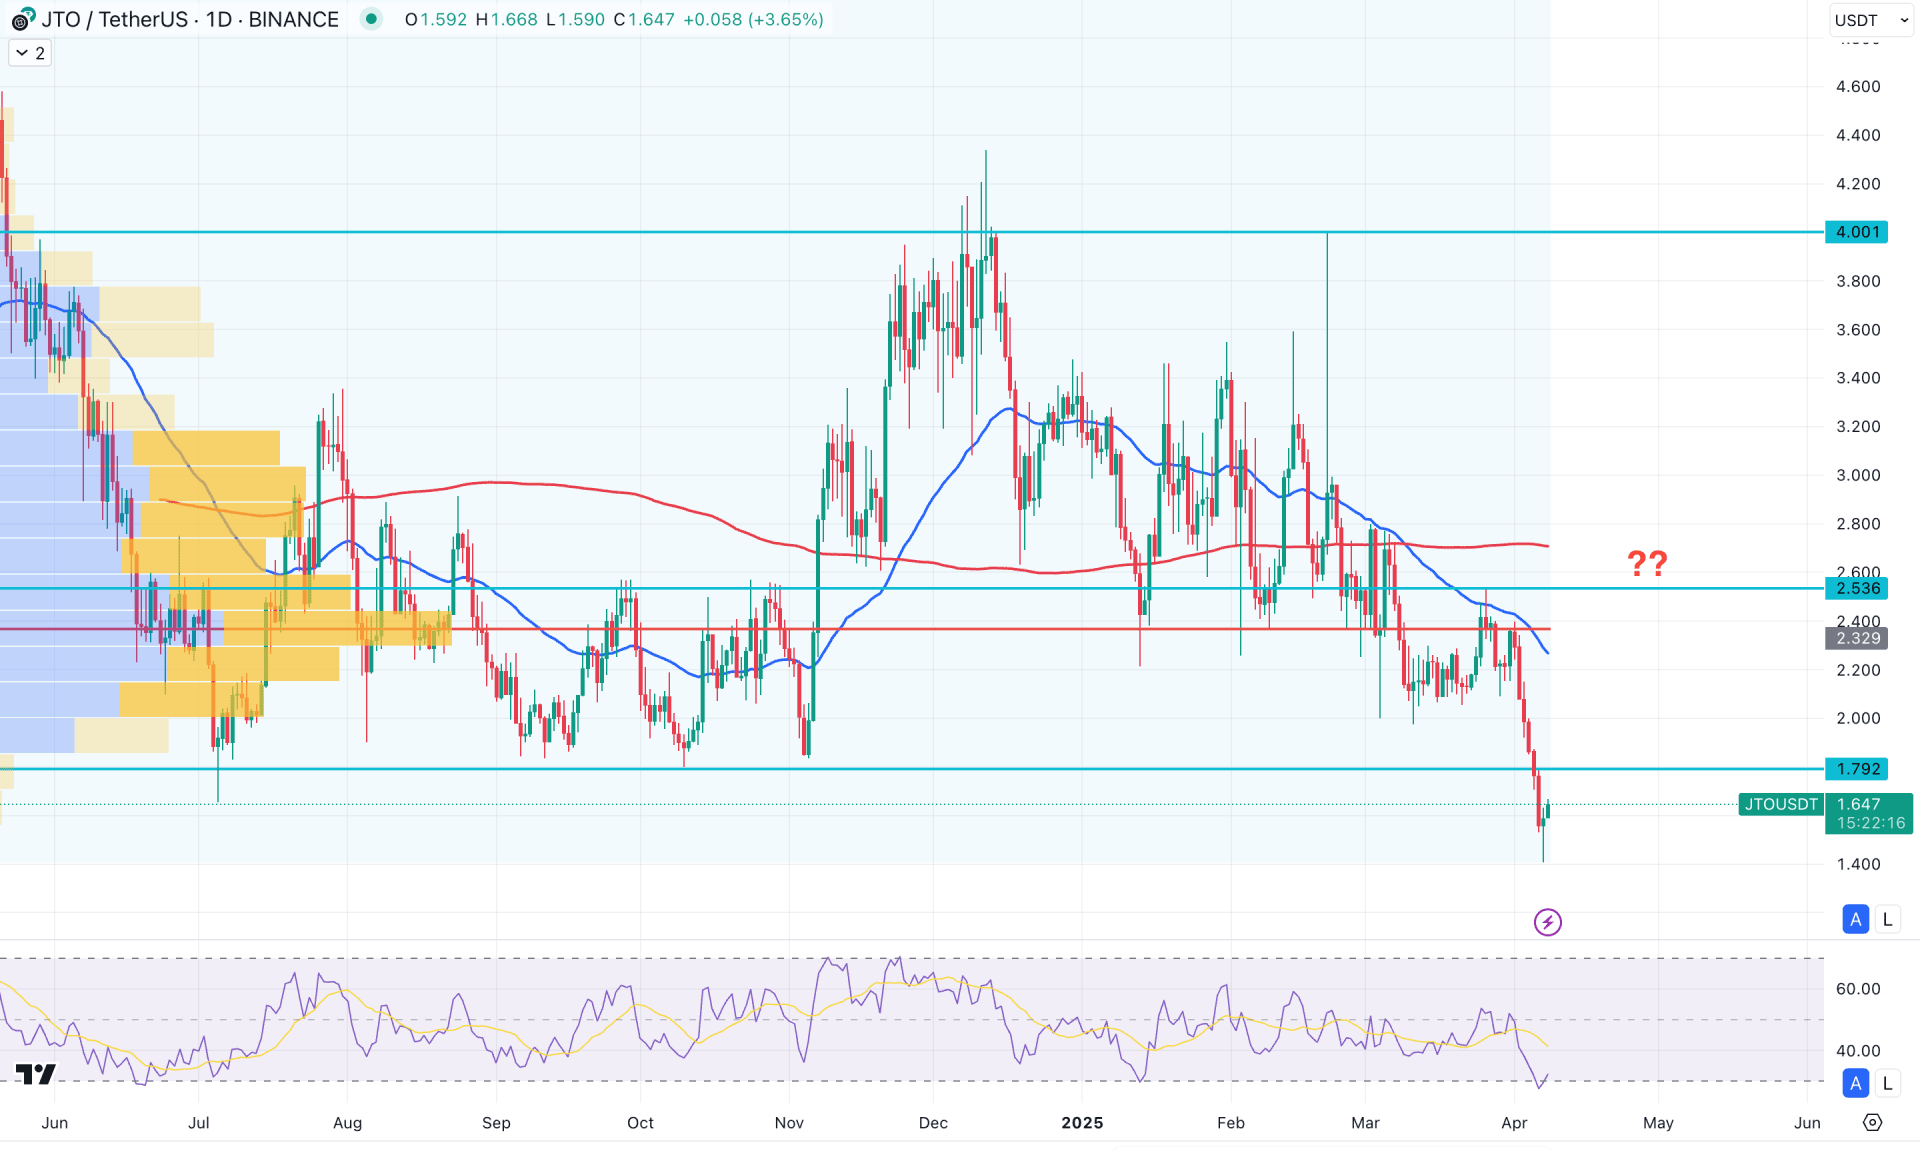
In the daily chart of Jito (JTO/USDT), the price trades within a massive liquidity zone following the break of a multi-month low. In this context, buyers are likely to be wiped out, and the price may initiate a stable trend. Investors should closely monitor the price action, as any valid bullish reversal could shift the ongoing bearish momentum.
Confirmation from higher time frames is crucial for this instrument. The monthly candle has been closing bearish for three consecutive months. Moreover, the market is currently trading below a 16-month low, from which a bullish recovery is highly possible. However, the weekly timeframe tells a different story. The latest weekly candle close has formed a valid drop-base-drop pattern. In that case, the bullish outlook from the monthly chart must align with a recovery on the weekly chart—supported by a valid candlestick formation.
In the volume profile, a similar outlook is visible. The most actively traded levels since May 2024 lie within the current consolidation zone. As the latest weekly candle closed with a bearish engulfing pattern, a clear bullish push is needed before anticipating a potential bullish trend.
Looking at the main chart, the 200-day SMA remains flat, positioned above the current consolidation area. Meanwhile, the 50-day EMA has a bearish slope and is trading with approximately a 35% gap below the current price. As the price is now extended from the dynamic moving average lines, a bullish reversal is still pending as part of a mean reversion.
In the indicator window, the Relative Strength Index (RSI) has reached its lowest level ever recorded. Currently, the RSI line is above the 30.00 oversold level, showing signs of a bullish recovery.
Based on the current market structure, the primary anticipation for this year is a minor bullish recovery. However, the major market trend will remain bearish as long as the 50-day EMA stays above the current price. In that scenario, any downside pressure from the 2.39–2.08 order block could trigger a move toward the 1.000 psychological support.
On the other hand, a recovery above the 2.40 level could signal a bullish shift from the existing liquidity zone. In that case, the price may open room to reach the 4.001 psychological resistance soon.
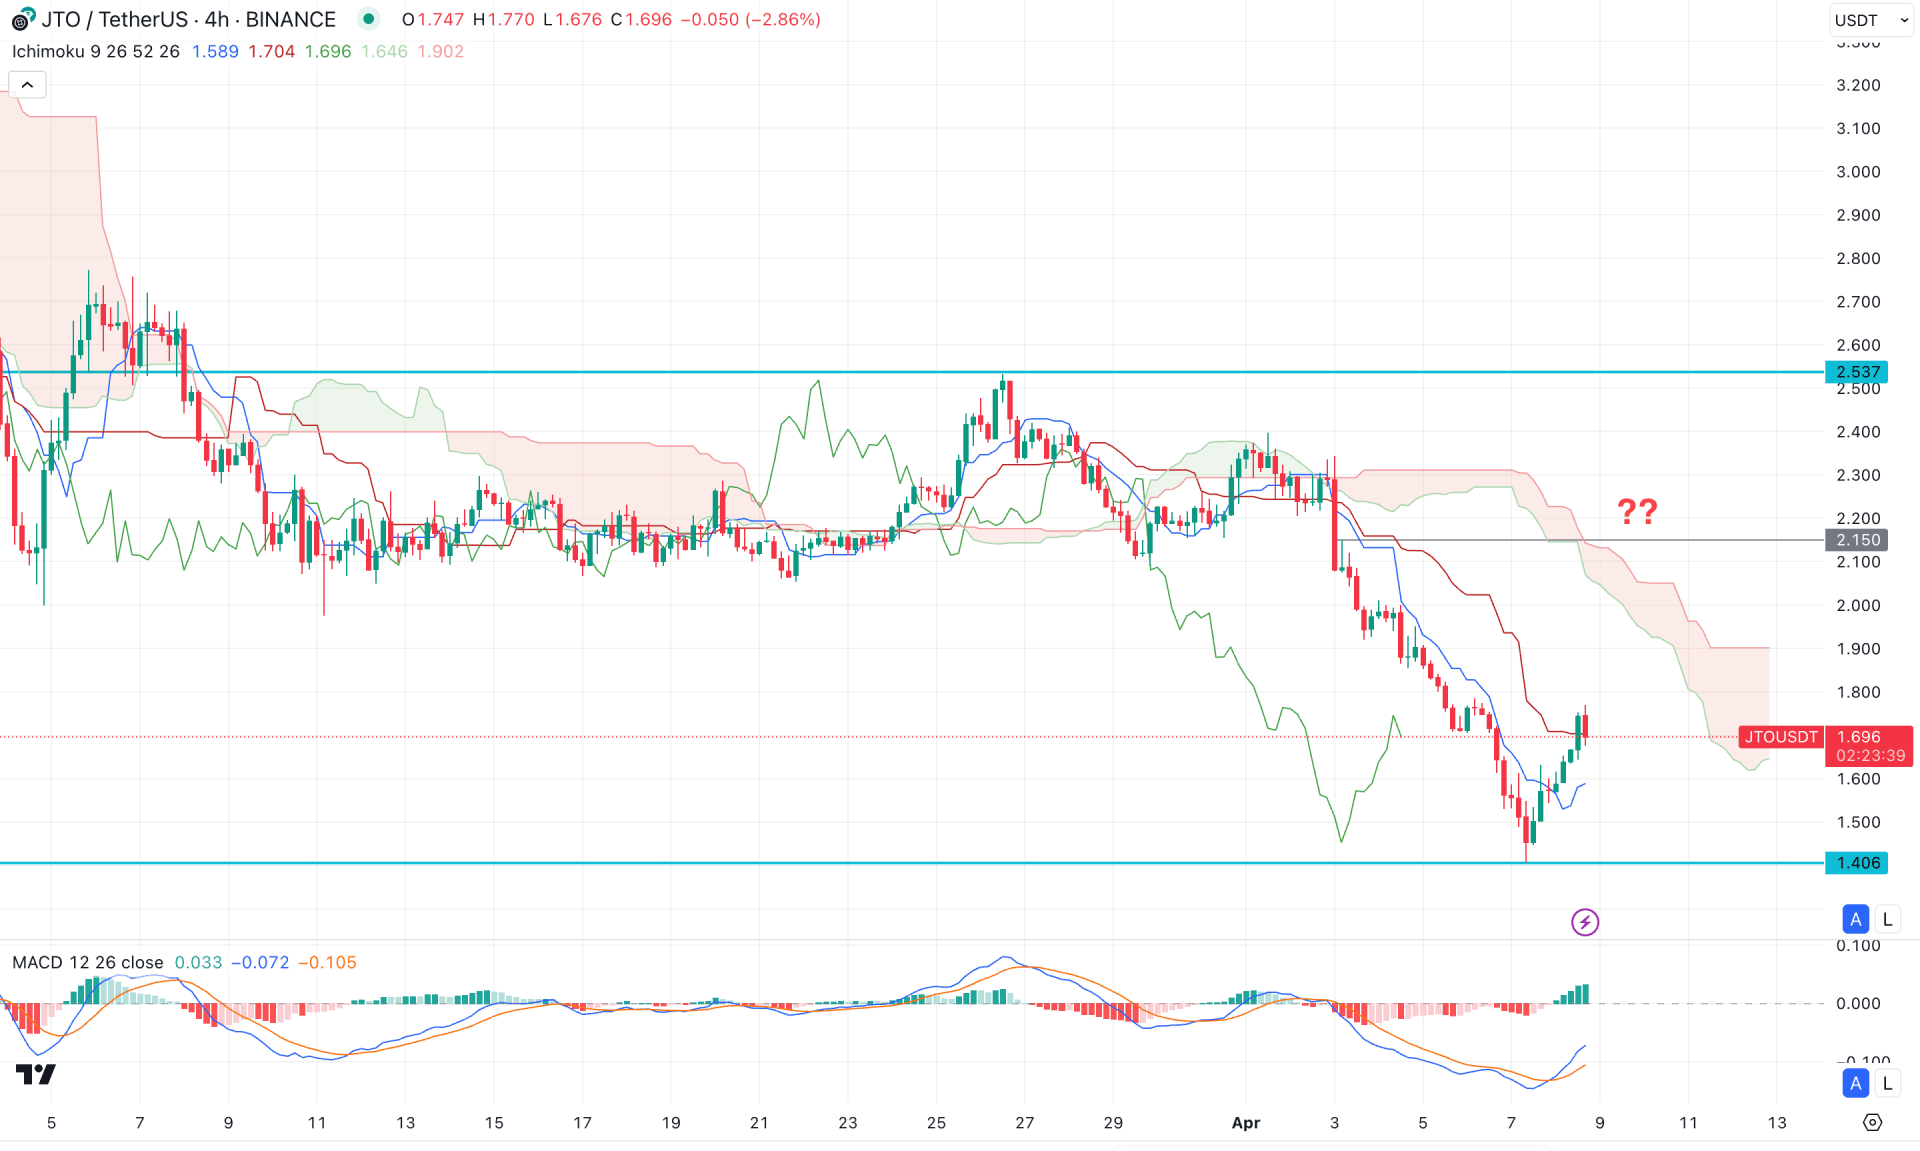
In the four-hour timeframe, the current price trades bearishly after a potential range breakout. As a result, the price extended its downside momentum below the dynamic Ichimoku Cloud area. Furthermore, the future cloud remains thick and stable, indicating a strong bearish sentiment.
In the indicator window, a bottom formation is visible as the signal line crosses the MACD line in a bullish crossover within the negative zone. Additionally, the histogram bars have shown five consecutive bullish lines, indicating an increased buyer activity in the market.
Overall, the Kumo B Span plays an important role in this timeframe, acting as the dynamic resistance zone and the immediate barrier for buyers. Even though a broader bullish recovery is expected before the continuation of the current trend, investors should closely monitor how the price reacts around the nearby travel resistance zone.
The primary strategy during this period is to look for short trade setups after the price revisits the 1.800–2.100 area, ideally confirmed by a bearish reversal candlestick pattern.
On the other hand, an immediate bullish recovery with a stable move above the 2.300 level could signal a counter-trend impulsive rally. If that happens, the price may reverse trends toward the 3.2000 psychological resistance area.
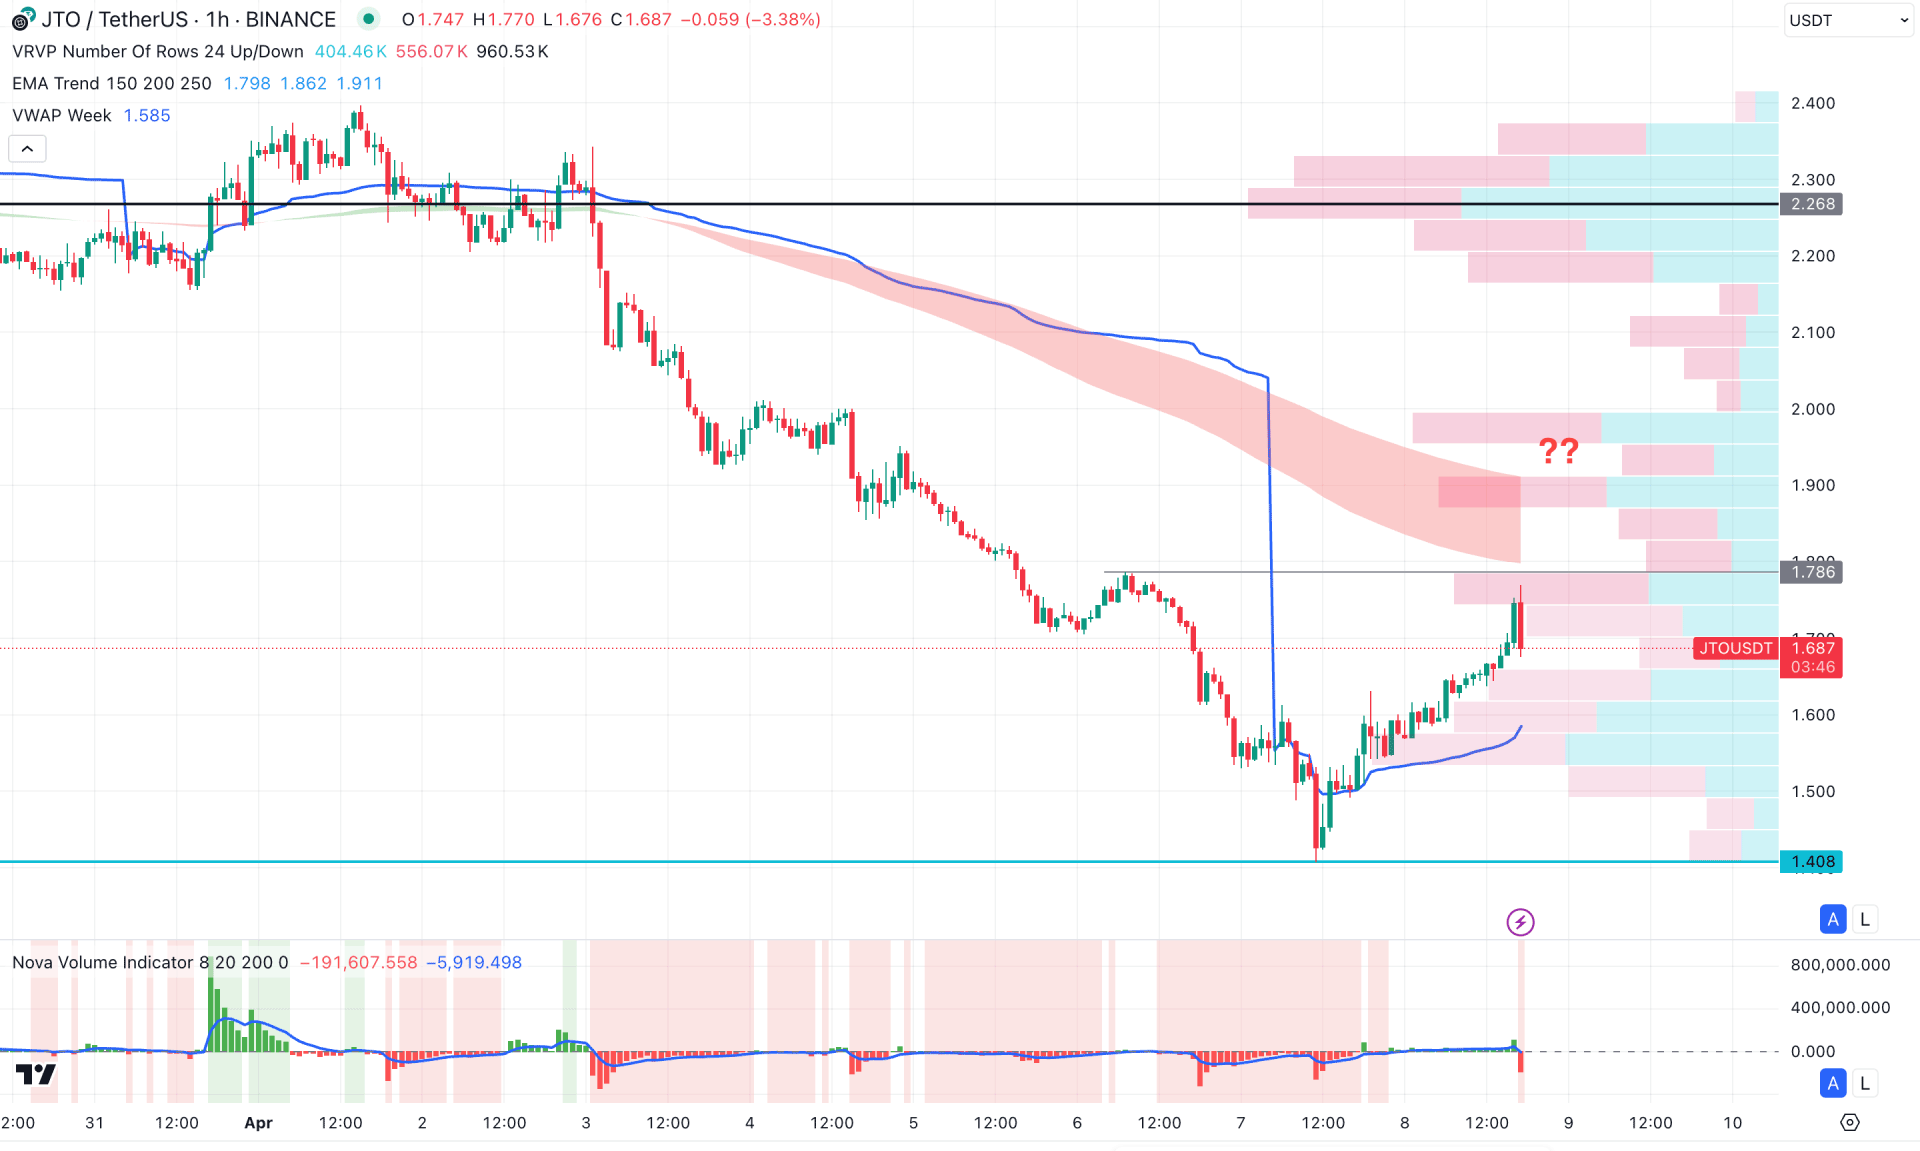
In the hourly time frame, the recent price shows an ongoing bearish pressure where the current price is hovering below the EMA wave. Primarily, the price will likely extend the bearish pressure as long as the EMA wave is above the current price.
On the other hand, the volume looks positive for sellers, whereas the volume histogram shows a bearish break with a red histogram.
Based on this outlook, the bearish is likely to extend, where the weekly VWAP is the immediate support. A bearish H1 candle below this dynamic line could extend the selling pressure.
On the other hand, ongoing selling pressure could initiate an extended bullish correction after overcoming the EMA wave. However, the intraday trend must overcome the high volume line before forming a trend reversal.
Based on the current market outlook, JTO/USDT is more likely to form a stable trend as a potential liquidity zone is reached. However, the most probable long opportunity could come after rebounding above the daily high volume area.


