
Published: March 24th, 2026
Jefferies stock has been trading 40% lower since the beginning of the year. However, the recent news that the second-largest bank in Japan, Sumitomo Mitsui Financial Group, is eager to take over the company is a positive factor.
According to the latest news, Sumitomo Mitsui Banking Corp is the largest stakeholder in Jefferies after Vanguard and BlackRock. However, the possibility of the takeover is not yet confirmed, as Jefferies executives might not agree to sell while the share price is falling.
Jefferies stock is having buying pressure as soon as the news is released. The company is valued at $8 billion and has been struggling since January 2026.
The bank is facing strong scrutiny regarding its lending facility, with concerns about the private equity loan.
Let's see the complete price action of this stock from the JEF price analysis:
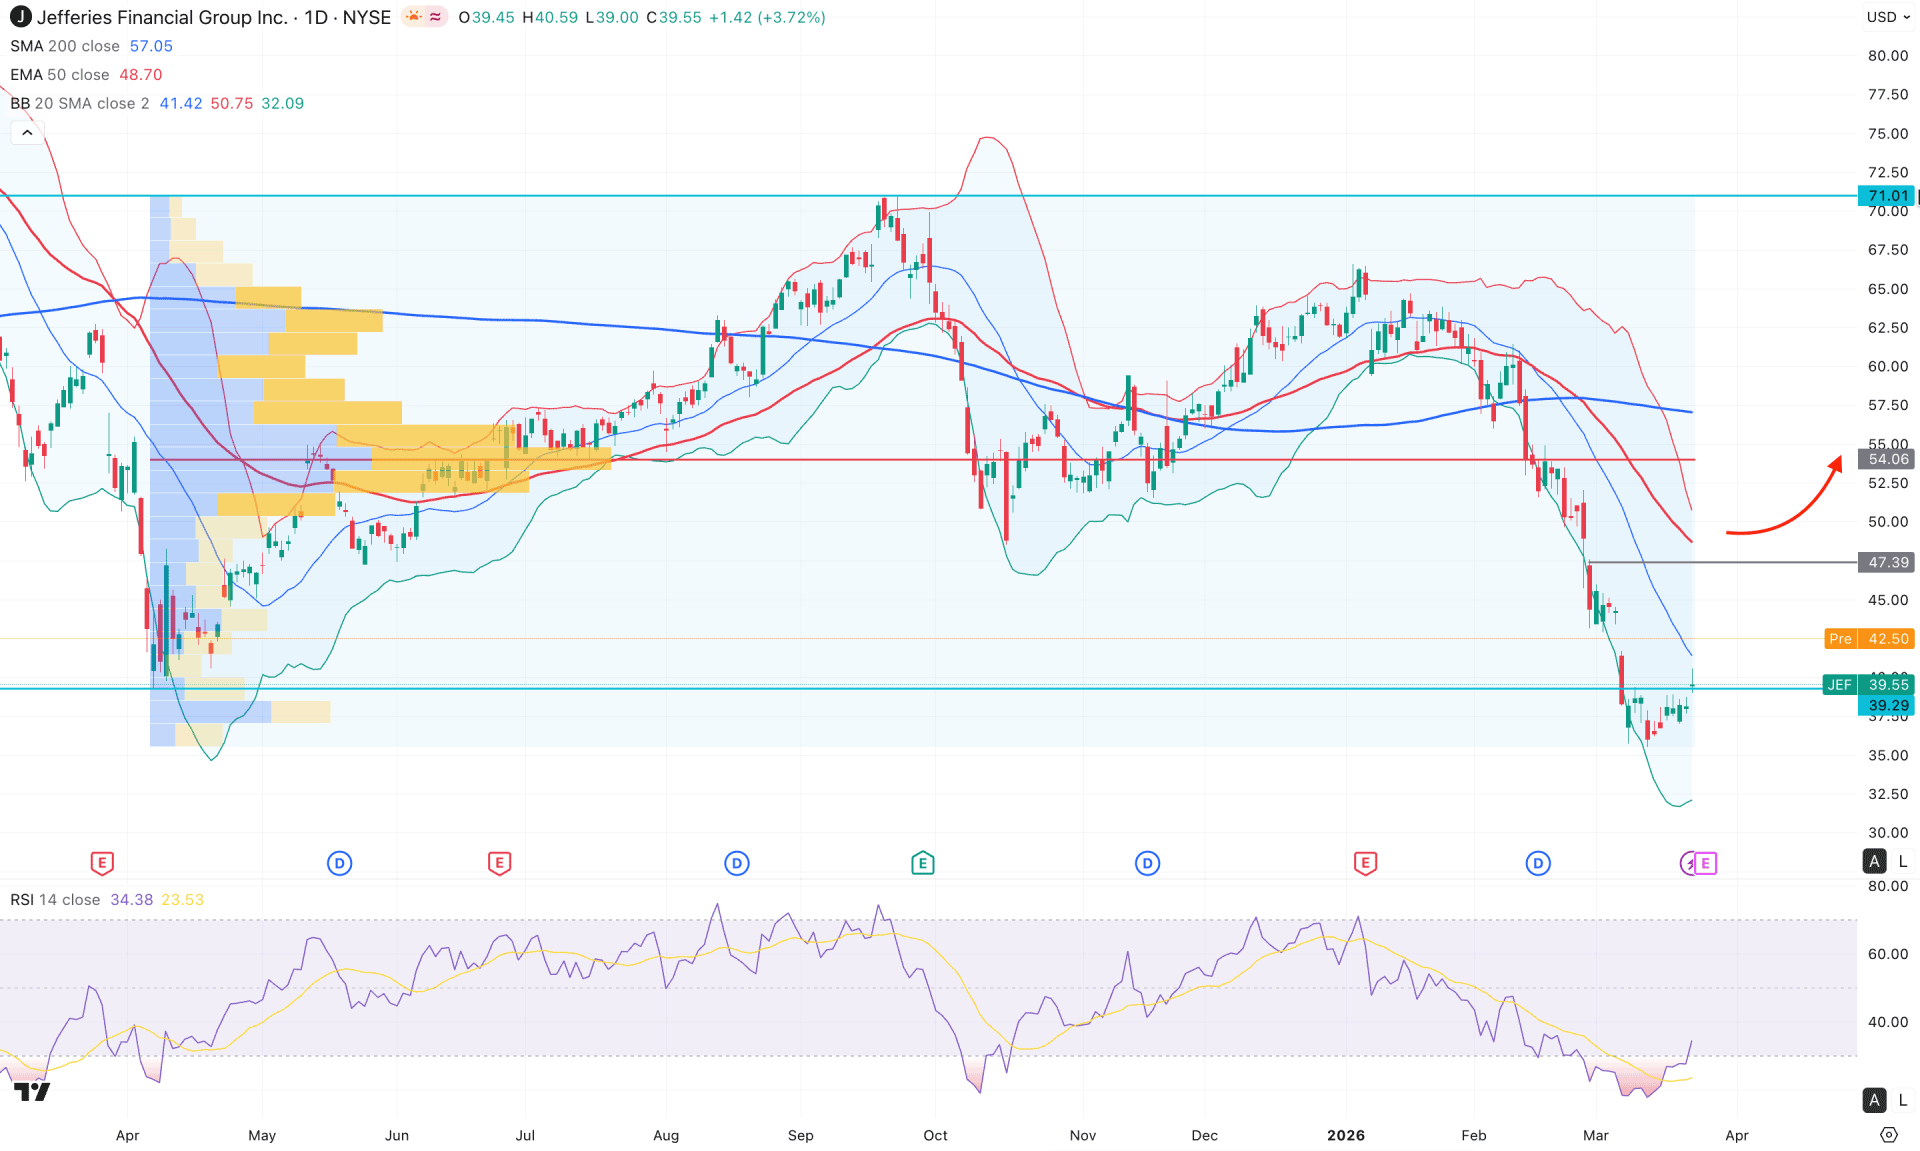
In the daily chart of JEF, the major market momentum is bearish as the recent price has dropped more than 40% on a single swing. However, the recent price has reached a deeper liquidity zone from where a strong liquidity sweep is possible. As the price is still trading within the bearish trend, more confirmation is needed before validating a bottom.
In the monthly chart, a bearish trend continuation is visible where the momentum has started to lose as soon as the price dipped below the 2025 low. As a result, the weekly timeframe has formed multiple indecision candles at the bottom, from where a considerable bullish correction is possible.
In terms of volume, minor bullish pressure is possible, as the most significant level since April 2025 is at 54.06, which is well above the current price. Moreover, some minor high-volume activity has formed at the bottom, suggesting a bullish correction but not a trend reversal.
In the main price chart, the 200-day Simple Moving Average and 50-day EMA are above the current price, forming a Death Cross. However, the gap between the current price and the dynamic lines has widened, suggesting a bullish correction as a mean-reversion.
Moreover, the price is trading sideways along the Mid Bollinger Bands line, while the Lower Bollinger Bands line has a bullish slope. This is a sign of minor buying pressure, where a bearish continuation is possible.
The phase reached the oversold zone as the RSI rebounded from the 30.00 level for the first time since October 2025. Moreover, the Average Directional Index (ADX) has reached the 60.00 level and has become sideways. In that case, a downward line in the ADX could signal a corrective trend in the coming days.
Based on the overall market structure, the JEF is trading at a significant low from where a bullish correction is possible. The buying pressure is supported by the recent collaboration with a Japanese company, but a bullish rebound could follow a daily close above 47.39. On the bullish side, the immediate resistance is at the 57.33 level, which is in line with the 200-day SMA, while the major resistance is at the 71.01 level.
The alternative trading approach is to find a bearish reversal at the Mid Bollinger Bands line, which might increase the possibility of a bearish trend continuation. A bearish break below the 36.00 line could open the door to the 30.00 area.
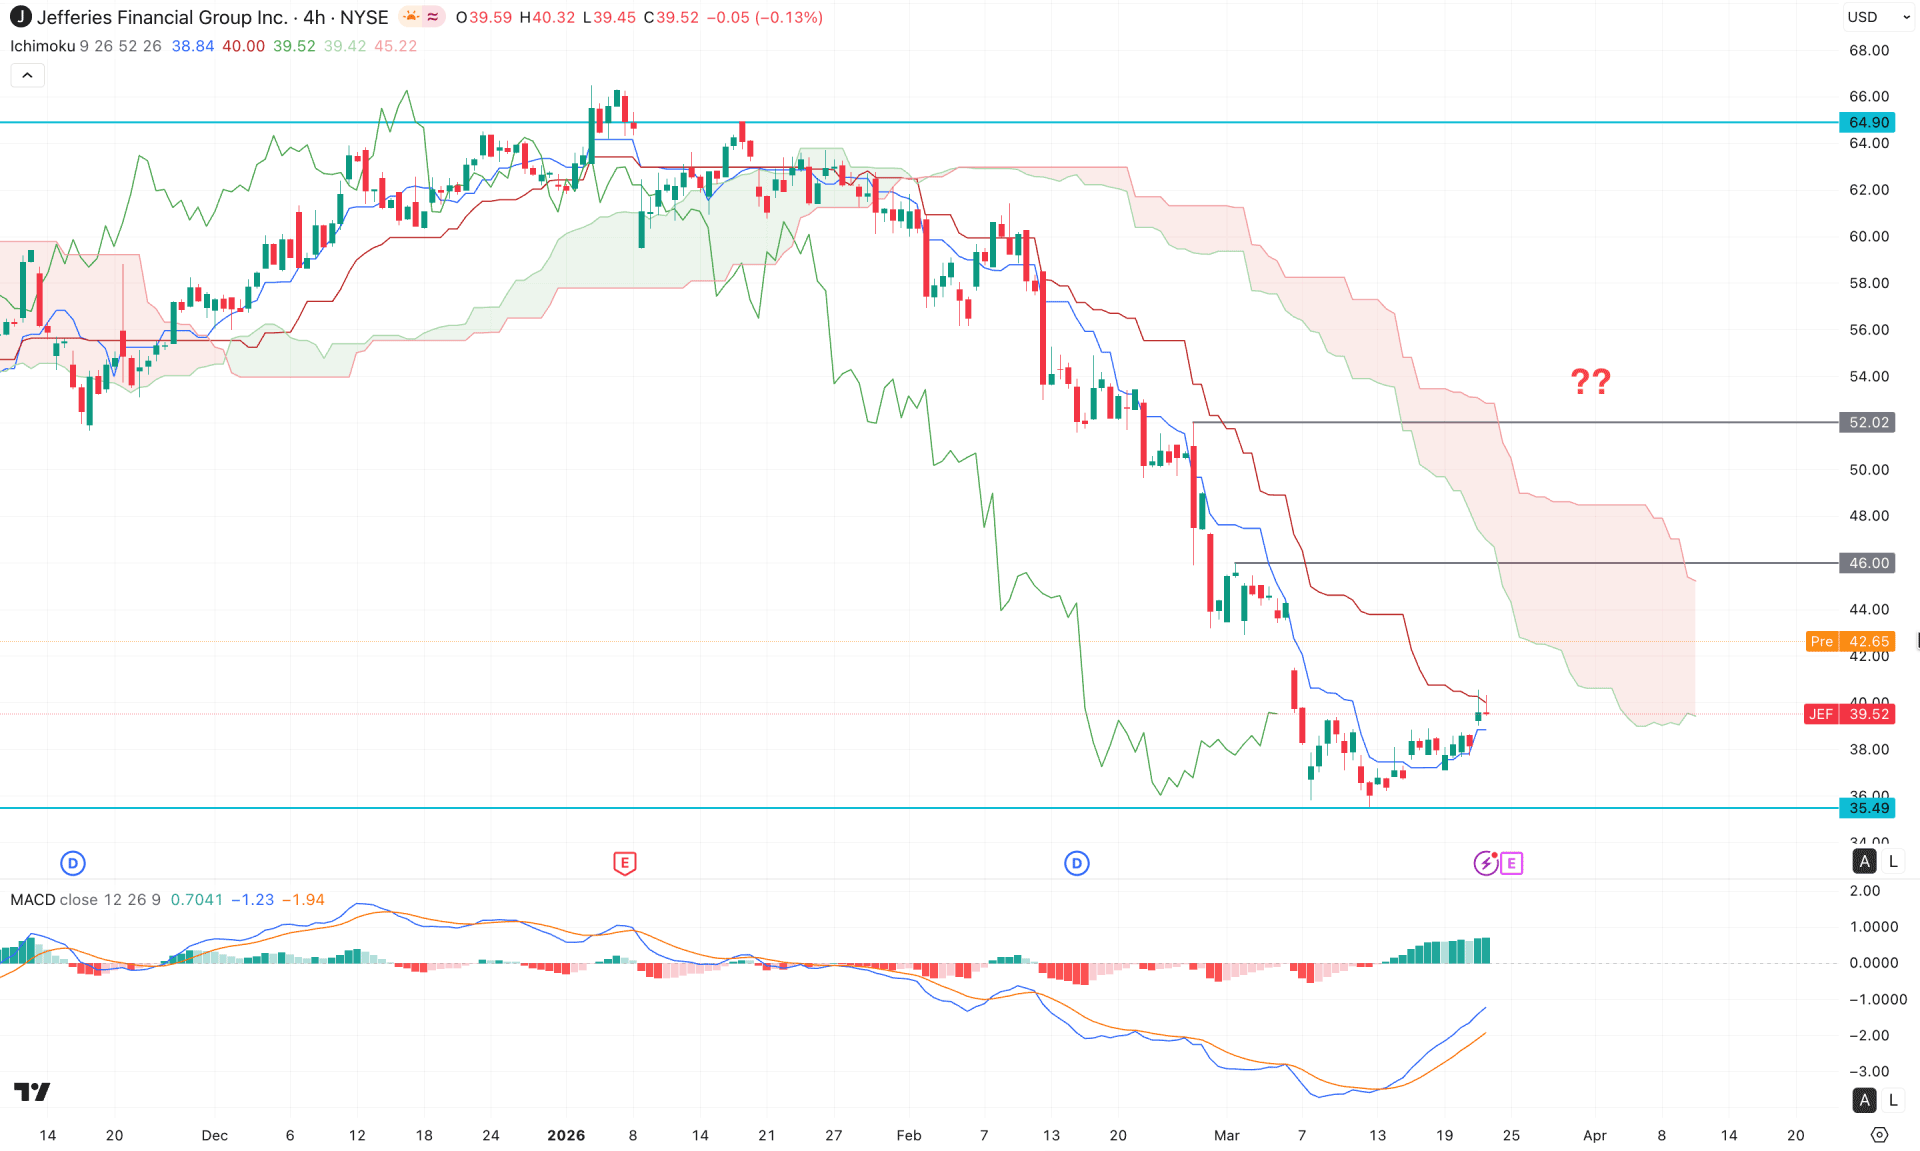
On the four-hour chart of JEF, the current price is trading bearishly below the Kumo cloud area, where momentum remains sideways. As a result, the price has rebounded above the Kijun-sen level, signaling a potential bullish recovery in the coming hours. On the other hand, the future cloud is still positive with two bullish spans, where Senkou Span A remains above Senkou Span B with strong thickness.
The indicator window shows a slightly different picture. The MACD histogram has maintained positive bars for a considerable period. Moreover, the signal line has formed a bottom with a bullish crossover, indicating confluence buying pressure.
Based on the H4 market structure, the price has a higher probability of extending upward as part of a bullish correction. The immediate resistance is located at the 46.00 level, followed by the 52.02 level. Failure to break above these resistance levels could pose a challenge for buyers, as it may lead to a continuation of the existing downtrend toward the 35.49 level.
On the other hand, a breakout above the 52.02 level with a bullish four-hour candle close could increase the likelihood of a recovery toward the 64.90 level.
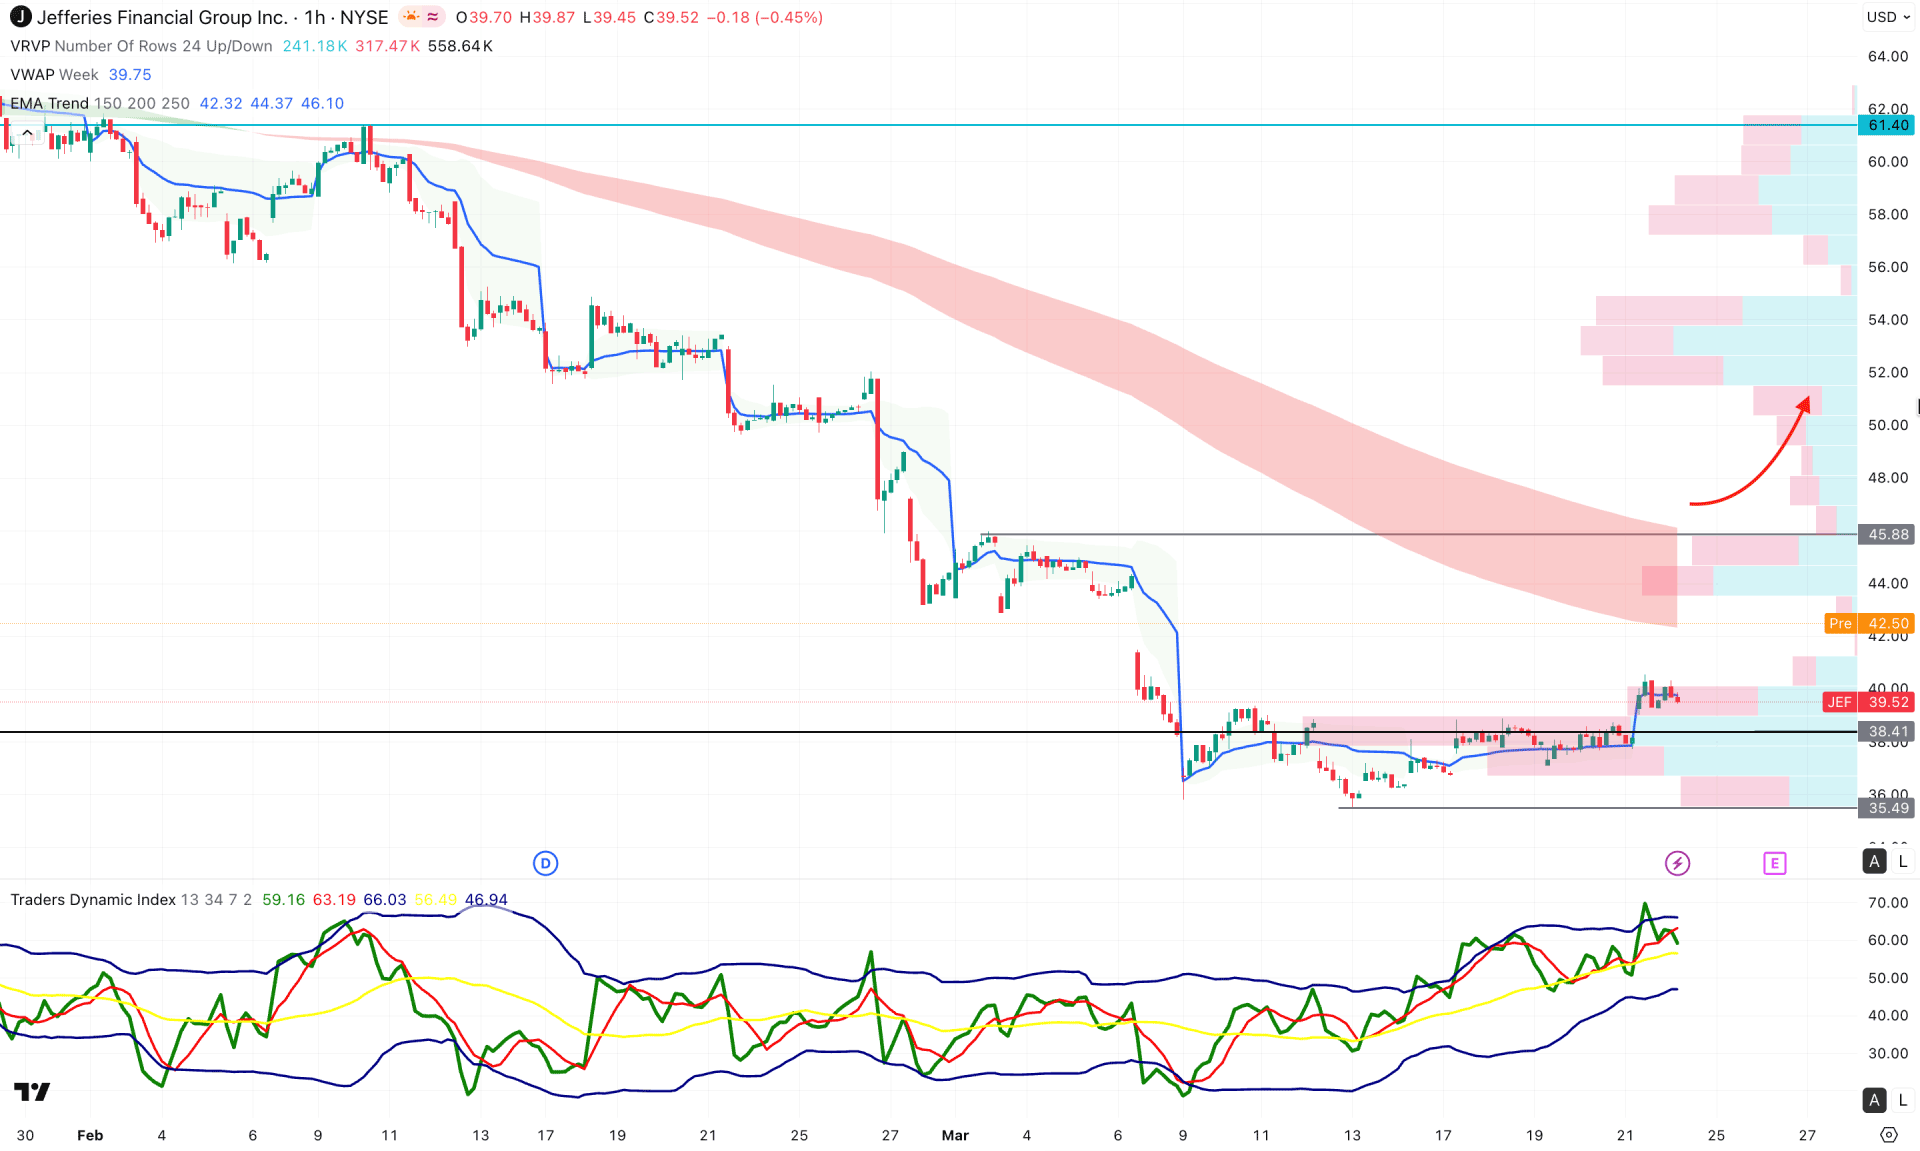
In the hourly timeframe, the JEF price is trading sideways at the session low, suggesting an ongoing selling pressure. However, an immediate bullish range breakout is visible with fundamental support, suggesting a bullish correction.
On the other hand, the EMA wave is still above the current price and working as a major resistance. The Traders Dynamic Index (TDI) is hovering at the upper peak area, suggesting an extreme bullish condition.
Based on the overall market structure, the price is still trading bearish where enough momentum is needed before going long. A bullish reversal with a stable price above the 45.88 high could take the price above the 50.00 level.
However, an immediate selling pressure might come in case the price fails to hold the momentum above the 36.00 level.
Based on the current market scenario, the JEF is trading at the crucial bottom from where a stable trend could be formed. Investors should closely monitor the current price action as a valid bottom formation with a decent recovery could be an early long opportunity.


