
Published: October 7th, 2025
PepsiCo, Inc. (PEP) is anticipated to release its third-quarter 2025 financial results on October 9, prior to the opening bell. Analysts estimate the third-quarter revenues at $23.9 billion, which represents a 2.4% decrease from the reported amount for the same quarter last year. The consensus estimate for quarterly profits is $2.27, which is a 1.7% drop from the $2.31 posted in the same quarter last year.
The company recorded a 4.4% profit surprise in the most recent quarter. Over the last four quarters, it has produced an average earnings shock of 1.01%.
It is anticipated that PepsiCo's third-quarter 2025 performance was enhanced by the ongoing growth in its beverage businesses in North America and abroad. Approximately forty per cent of net revenues are generated by the company's overseas division, which continues to be a major growth driver. In the third quarter, the company's global business is anticipated to show strength in both convenience and beverage foods.
Thanks to targeted innovation and cost-cutting measures, PepsiCo is well-suited to rekindle expansion in Quaker Foods and gain more market share in the nutritious food sector. The company's third-quarter results should show the benefits of this initiative.
PepsiCo's approach to boost efficiency, finance innovation, and encourage margin expansion continues to be based on its emphasis on efficiency and digital transformation. Automation, standardisation, and a greater use of digital data and tools analytics are driving the company's ongoing, enterprise-wide productivity efforts.
Let's see the further outlook of this stock from the PEP multi-timeframe analysis:
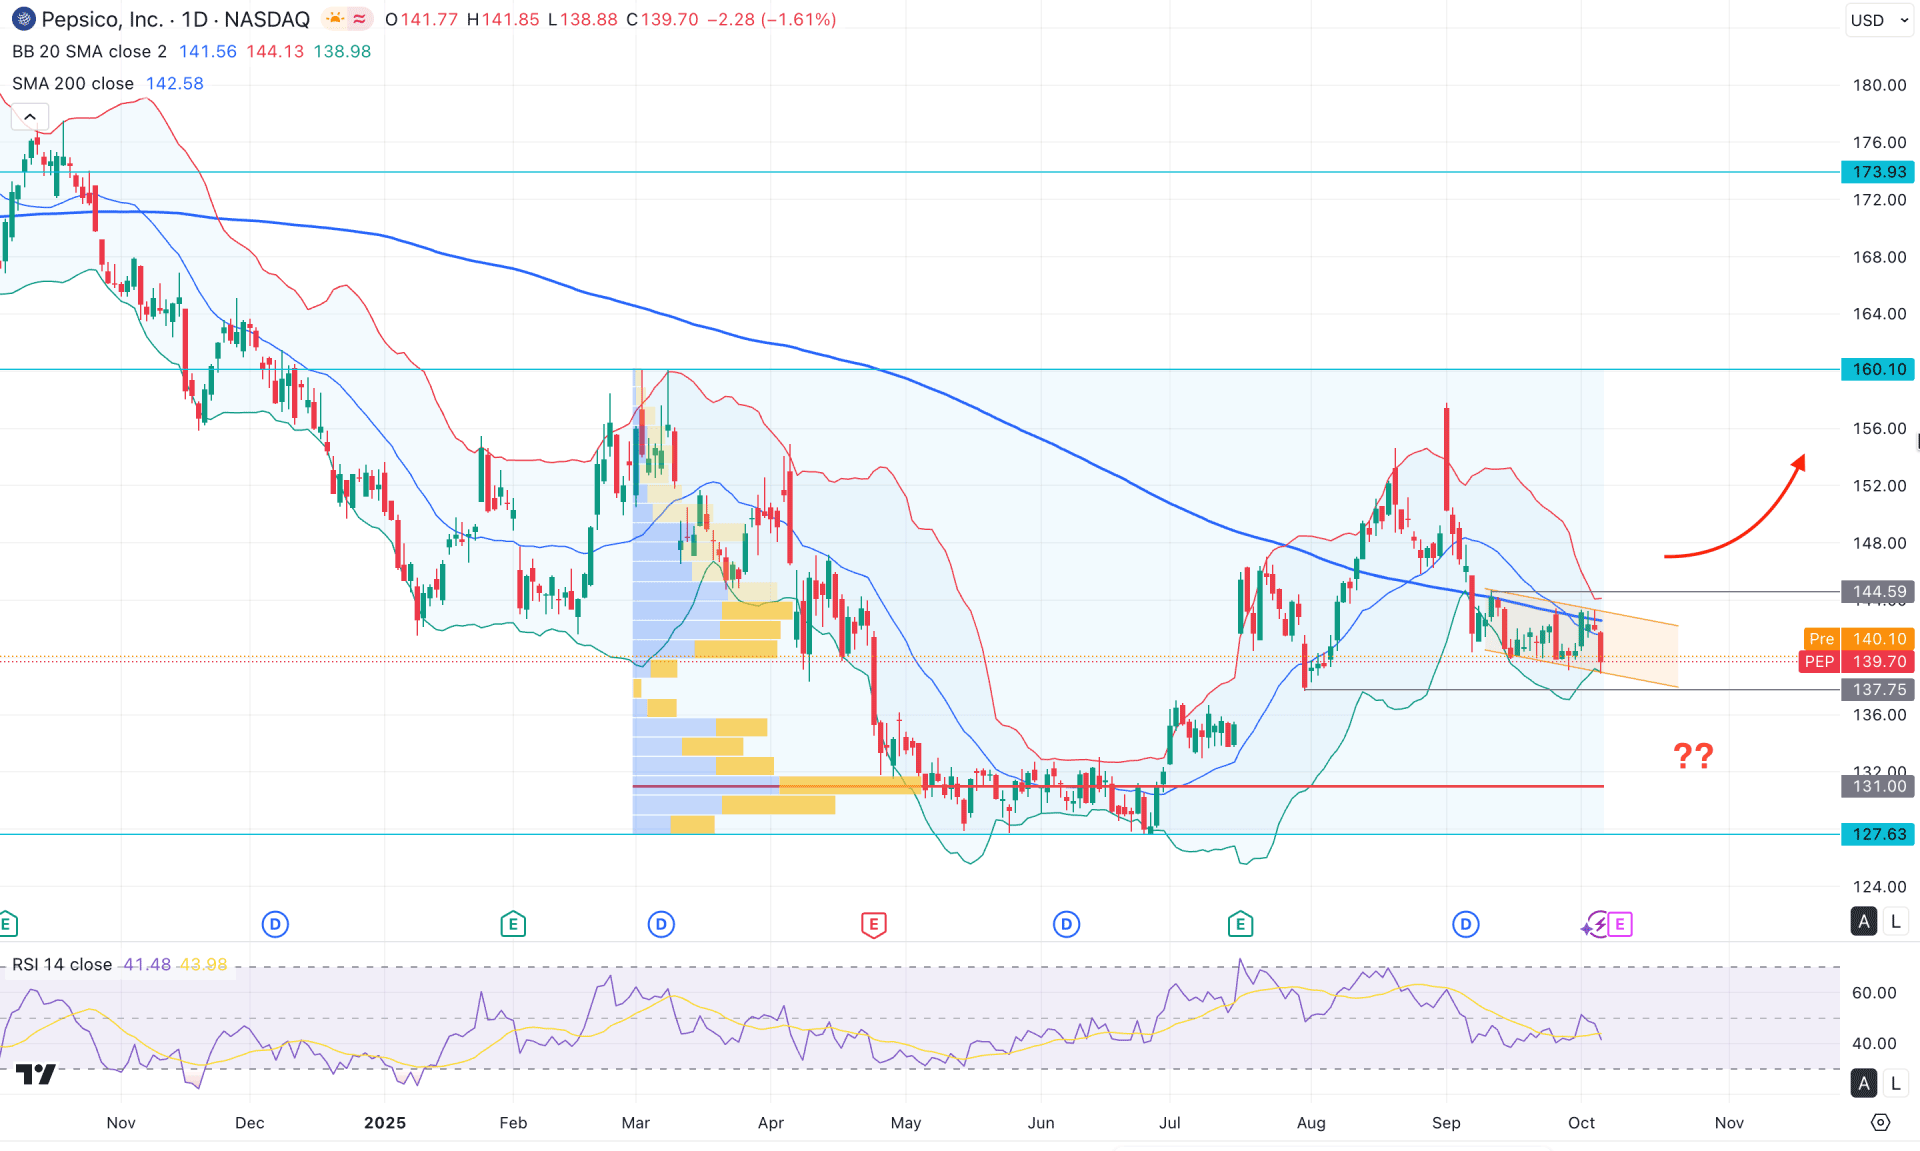
In the daily chart, PepsiCo's stock is trading within a range-bound market, where a valid breakout could initiate a trend-trading opportunity. Currently, the price is moving sideways after a sharp recovery from the July 2025 low. An additional bullish push could establish a stable upward trend.
In the higher timeframe, the broader market structure appears bearish, as the current price is trending lower following a strong bearish month and a head-and-shoulders breakout. In this case, investors should closely monitor how the price behaves near the bottom formed in June 2025. As long as the price remains above this crucial low, a bullish reversal could occur.
On the daily timeframe, a descending channel is evident, with the 200-day Simple Moving Average acting as strong resistance. However, the price is currently trading above the high-volume line initiated in March 2025, which signals notable buyer presence.
In the main indicator window, the Bollinger Bands are pointing downward, while the recent prices are moving between the mid and lower Bands. Since both the mid-Bollinger Band and the 200-day SMA are acting as confluence resistance levels, further confirmation is needed before anticipating a stable trend formation.
In the secondary indicator window, ongoing selling pressure is visible from the Relative Strength Index (RSI), as the recent lines are heading downward below the 50.00 neutral level.
Based on the overall market structure, sideways momentum is visible, with immediate support located near the 137.75 level. A failure to hold above 137.75 could expose the next support at 127.63.
Alternatively, a bullish breakout with a daily close above 144.59 would validate a descending channel breakout and open the path toward the 160.10 key resistance level. If the price sustains above this area, it could resume the major bullish trend, targeting the 180.00 psychological level.
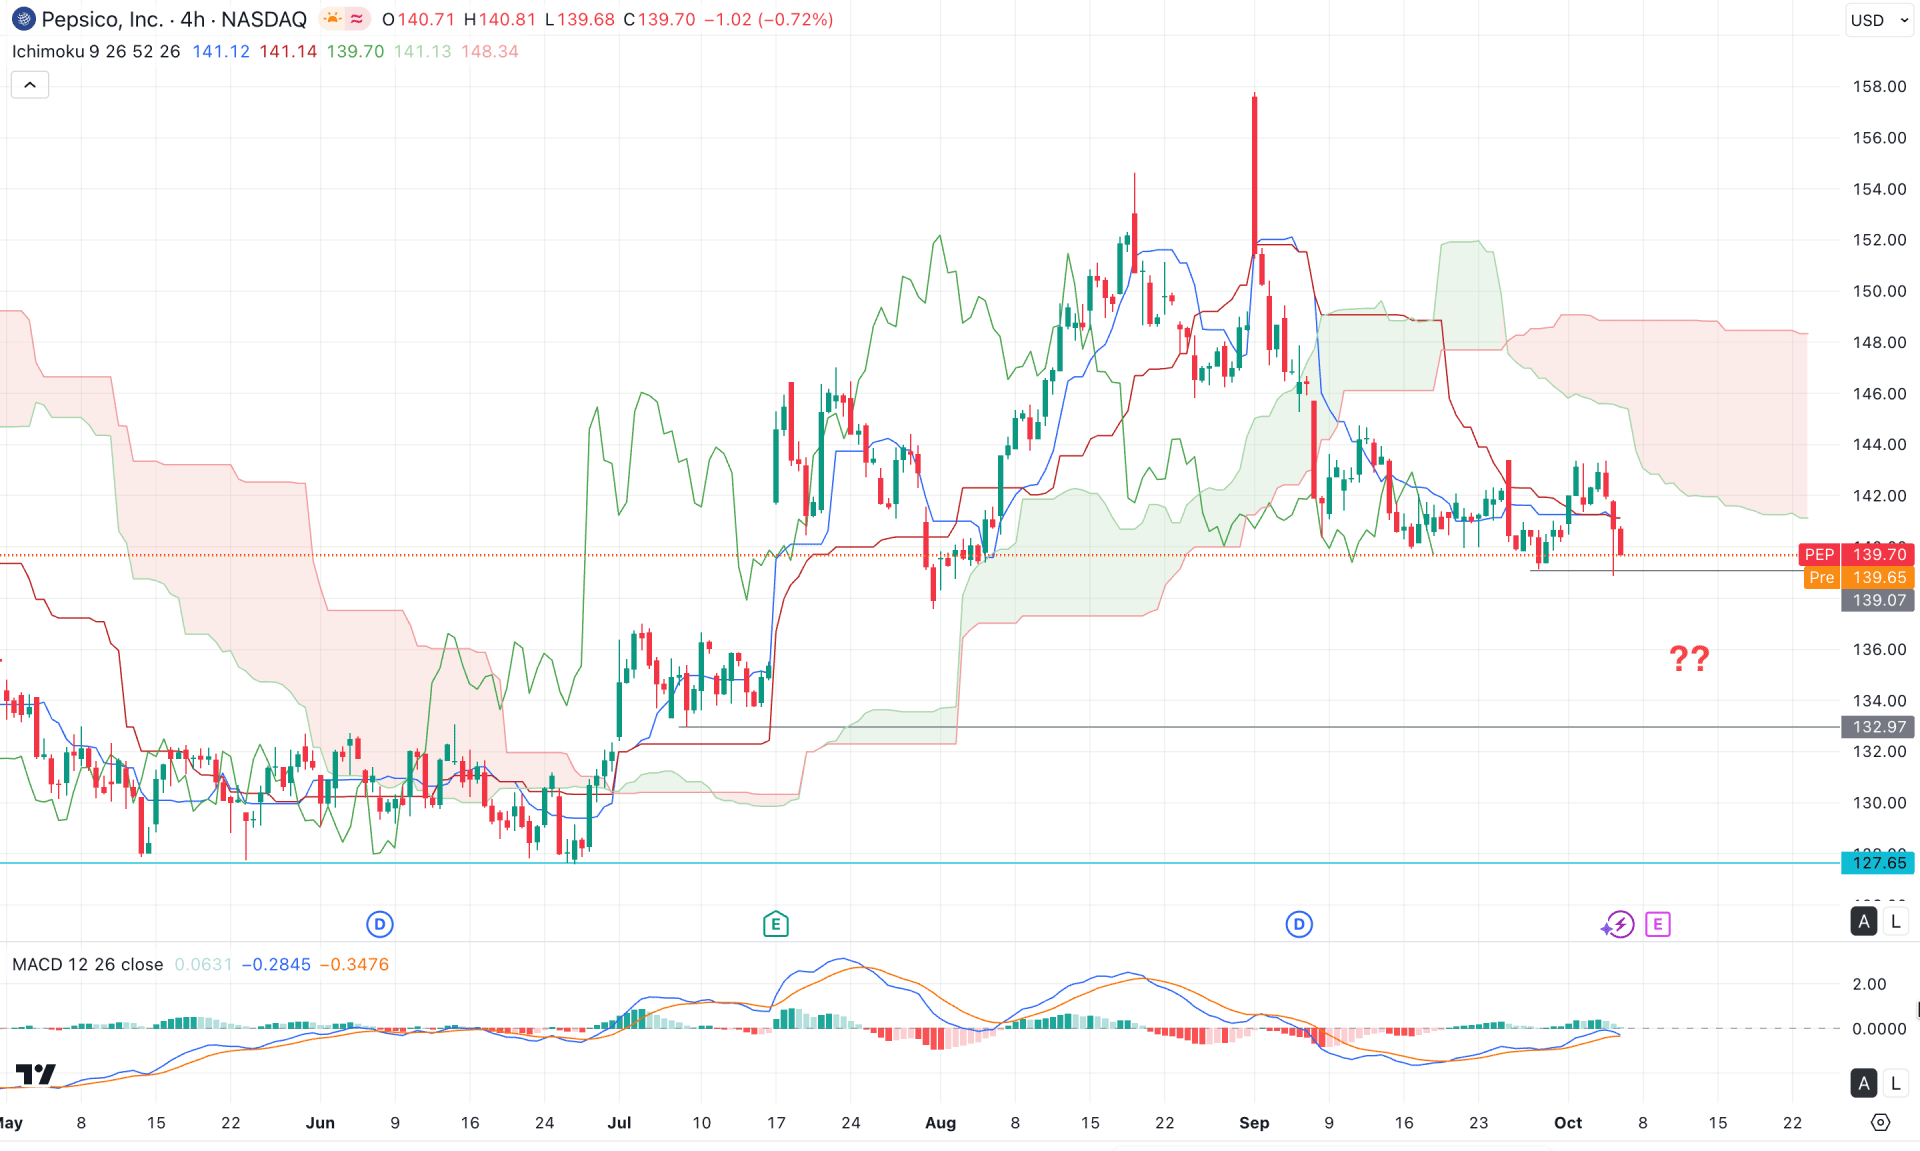
In the four-hour timeframe, a bullish exhaustion is visible as the price failed to maintain momentum above the Kumo Cloud area, which led to an immediate breakdown followed by sideways consolidation. As long as the price continues trading below the Ichimoku Cloud, the bearish opportunity remains strong.
In the Ichimoku Cloud indicator, both future lines are sloping downward, and the thickening cloud suggests the potential for a bearish breakout. The dynamic lines are moving closer together and forming a flat shape, signalling sideways momentum in the market.
In the indicator window, the MACD histogram is showing a decline in bullish pressure and approaching the neutral point, where a bearish crossover appears to be forming between the signal lines.
Based on the overall market structure, a break and H4 close below the 139.07 level could present a high-probability short opportunity, with the initial target at 132.97, followed by 127.65 in the extended move.
On the other hand, a bullish recovery would require strong volume support to establish a stable position above the 148.00 level, which could then open the path toward the 158.00 area.
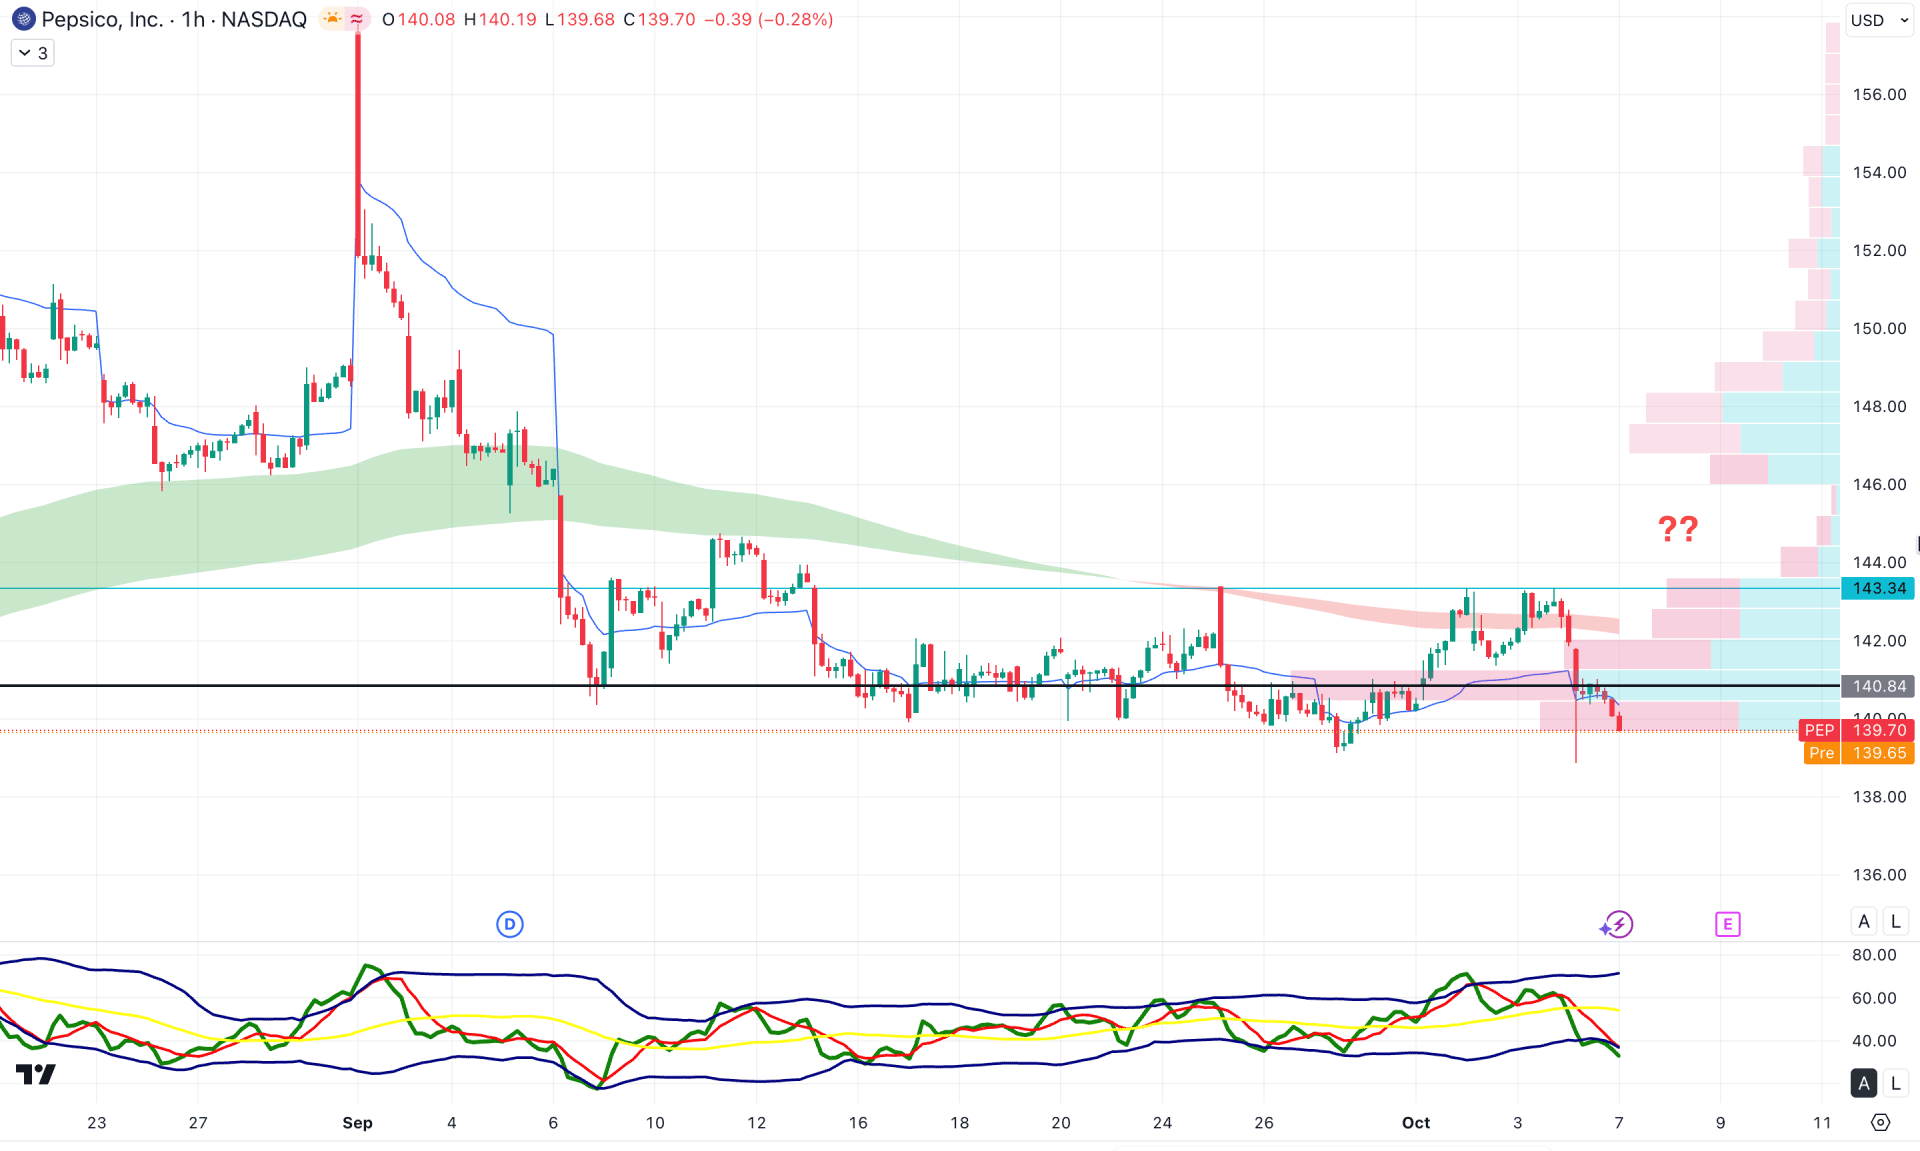
In the hourly timeframe, the immediate range-bound market is experiencing selling pressure from the intraday high volume line, positioned near the 140.84 level. Moreover, the Exponential Moving Average wave and weekly VWAP line are both sloping downward, signalling a bearish crossover.
Based on the current market structure, a continuation phase is likely, as no solid bottom has yet been established. The immediate support to monitor is near the 136.00 level. However, sufficient buy-side liquidity exists above the 143.34 level, which may need to be taken out before confirming the bearish scenario.
In that case, a bullish setup with a stable price above the 144.02 level could offer an alternative trading opportunity, potentially driving the price toward the 154.00 psychological level.
From a broader perspective, PepsiCo's stock is trading within a sideways phase, though the long-term market bias remains bullish. In this case, a bullish continuation would require a solid bottom formation on the daily chart.
Investors should closely monitor price behaviour following the earnings release, as any upbeat results could validate a bullish range breakout, paving the way for a continuation of the major uptrend.


